Science Education
>

Evaluating Regional Pulmonary Deposition using Patient-Specific 3D Printed Lung Models

Instructor Prep
concepts
Student Protocol
JoVE Journal
Bioengineering
A subscription to JoVE is required to view this content.  Sign in or start your free trial.
JoVE Journal Bioengineering
Evaluating Regional Pulmonary Deposition using Patient-Specific 3D Printed Lung Models

1. Preparation of 3D printed experimental components

NOTE: All software used in the protocol are indicated in the Table of Materials. Additionally, the slicing software utilized is specific to the 3D printer listed in the Table of Materials; however, this protocol can be extended to a wide range of stereolithography (SLA) 3D printers.

  1. Convert patient CT scans to 3D objects (.stl files).
    NOTE: For a more detailed discussion of the geometric features of the specific lung model used in these studies, refer to Feng et al.5.
    1. Render CT scans into a 3D object using CT scan software (see Table of Materials). Open the CT scan and create a mask on the airspace using the Threshold tool with a setting in the range of -800 to -1000. Using the 3D Preview tool, view the 3D rendering and export the object (File | Export) as an .stl file.
    2. Importing the files into mesh editing software (see Table of Materials), remove any jagged features using the Select tool (Sculpt | Brushes: "Shrink/Smooth" | Properties: Strength (50), Size (10), Depth(0)). Smooth the surface (Ctrl+A | Deform | Smooth | Smoothing (0.2), Smoothing Scale (1)).
    3. In mesh editing software, extend the wall of these objects by 2 mm (Ctrl+A | Edit | Offset), and allow the inner object to remain hollow such that only the wall remains. Slice the object (Select | Edit | Plane Cut) at the trachea to form an inlet and at generations 2 or 3 where the object branches off to each lobe to create outlets (Figure 1A).
      NOTE: The thickness of 2 mm was chosen based on the acceptable feature sizes specified by the manufacturer of the 3D printer listed in the Table of Materials. This thickness can be adjusted based on the specifications of the 3D printer available if the interior geometry of the model is maintained.
  2. Modify patient lung model outlet geometries to be compatible with previously designed lobe outlet cap components (Figure 1B,C) listed in the Table of Materials.
    1. Import the 3D object, which replicates the CT scan on the inside, has a wall thickness of 2 mm, and is open at the inlet and outlets, into 3D modeling software (see Table of Materials) as a Solid Body (Open | Mesh Files | Options | Solid Body).
    2. Create a plane based on a face at each of the outlets (Insert | Reference Geometry | Plane). Using the splicing tool, trace the inner wall and outer wall of the outlet in a sketch on the plane (Sketch | Spline).
    3. Loft a cylinder (OD 18.5 mm, ID 12.5 mm, H 15.15 mm) to connect to the inner and outer wall of the model, thus extending the outlet to be uniform at each lobe (Features | Lofted Boss/Base). Add a notch around the edge of the outlet to match with the cap (Features | Extruded Cut | Offset).
      NOTE: The cap (Figure 1D) is a hollow cylinder matching the dimensions of the outlets and having a shelf that interconnects with the notch of the model outlet. One end of the cap is blocked such that the ID is smaller than the rest of the part, this ensures a tight fit around the barbed tubing connection (Figure 1E). The barbed tubing connection is a barbed cone-shape such that the barbing fits through the opening of the cap, but the rest of the part does not, allowing the tubing connection to securely fit in the cap. Thus, the cap fits tightly around both the barbed tubing connection and the lung model (Figure 1F,G).
    4. Modify the inlet of the lung model depending on the desired experimental conditions. The throat and glottal regions can be included to mimic a patient that can breathe on their own (Figure 1B). Regions above the trachea can be removed using an extruded cut to mimic an intubated patient on ventilator support (Features | Extruded Cut) (Figure 1C).
  3. Orient and support experimental components in slicing software provided by the 3D printer manufacturer.
    1. Import 3D part files into 3D printer slicing software and choose the appropriate resin. Use a hard resin to print the lung models and barbed tubing connections, and a soft resin to print the caps.
      NOTE: The resin used for printing the caps must have elastic properties to allow it to stretch over the lobe outlet and create an airtight seal.
    2. Set the part orientation such that any “islands” and unvented volumes are minimized. The best orientation for the lung models is with the lobe outlets facing away from the print platform. Ensure both the barbed tubing connections and the caps have the wider portions facing the print platform.
      NOTE: Individual slices can be viewed to check for the appearance of “islands,” sections of the part that first appear in a slice without being connected to the main body of the part. The review function can be used to check for slices with unvented volumes, areas where uncured resin can get trapped inside the part during printing. Both “islands” and unvented volumes decrease print quality and could lead to print failure.
    3. Viewing each slice individually, add supports to any remaining “islands” in the part as well as any areas with significant overhangs. Export and view the slices for the print to verify all areas are properly supported.
  4. Print experimental components and complete post-processing as per manufacturer instructions.
    NOTE: All post-processing steps described below are specific to the 3D printer listed in the Table of Materials. When utilizing alternate printers or materials, adjust these steps to reflect manufacturer instructions.
    1. For parts printed in soft resin, wash with ≥99% purity isopropyl alcohol (IPA) to remove excess uncured resin and thermal cure in a convection oven for 8 h according to manufacturer specifications.
      NOTE: Parts printed in soft resin can be very delicate immediately after printing, so special care should be taken during cleaning steps. Exposure to IPA should be kept below the material’s solvent exposure limit to prevent part degradation.
    2. For parts printed in hard resin, wash with IPA to remove excess uncured resin and cure in a UV oven (365 nm light at 5-10 mW/cm2) for 1 min per side.
      NOTE: To evaluate the accuracy of the 3D printed replica, it is recommended to use μCT scanning of the printed part and CT scan software to compare, quantitatively, variations between the original 3D rendering and the 3D printed replica.

2. Assembly of tubing system for flow rate control

  1. Screw 1/4” barbed tube fittings into the side of the manifold with 6 ports (Figure 2A-6) and a 3/8” barbed tube fitting into the remaining port.
  2. Cut 1/4" tubing to desired lengths and insert into each end of the push-to-connect valves (Figure 2A-5). Attach each valve to one of the 1/4" fittings inserted in the manifold.
  3. Connect a flow meter (Figure 2A-4) to the other end of each valve.
  4. Position the tubing system on top of the wooden board such that the manifold’s single 3/8” fitting extends past the edge of the board. To secure in place, add two screws to the side of the wooden board and attach the manifold to the screws using wire.
  5. Add four screws positioned around each of the valves and flow meters and use wire to secure each of them to the wooden board (Figure 2E).
  6. With approximately 6” of 3/8” ID tubing, connect the manifold to an in-line 0.1 µm pore size vacuum grade filter. Connect the other end of the filter to the flow controller using another 6” of 3/8” ID tubing
    NOTE: The tubing system only needs to be assembled once.

3. Assembly of lobe outlet caps with patient lung model

NOTE: This portion of the protocol must be completed prior to every experimental run.

  1. Insert barbed tubing connection into the cap with nozzle protruding through the opening in the cap base. First, insert one end of the oval barbed tubing connection base into the cap. Then, carefully stretch the flexible cap over the other end of the oval base, taking special care not to crack the thin base.
    NOTE: Newly printed caps may be stiffer than desired and can be stretched out by running two fingers along the cap interior.
  2. Cut 10 μm filter paper such that it is slightly larger than the outlet area. Fold the filter paper over the lobe outlet and hold in place with one hand.
  3. With the other hand, use tweezers to stretch the cap with barbed tubing connection over the outlet. Press the cap down until the cap’s notch matches up with the corresponding notch on the lobe outlet (Figure 2C).
    NOTE: Ripping the filter paper in this step can invalidate results, so special care should be taken to avoid excessive force when pressing the cap onto the outlet.
  4. Repeat for all remaining lobe outlets (Figure 2D).

4. Generation of clinically relevant air flow profile

NOTE: This portion of the protocol must be completed prior to every experimental run.

  1. Connect each lung model lobe outlet to the tubing of the corresponding flow meter and valve, taking care not to apply too much lateral pressure to the barbed tubing connection. Attach the electronic flow meter to the lung model mouth inlet to measure total air flow rate to the lung model.
  2. Turn on the flow controller (Figure 2A-7) and vacuum pump (Figure 2A-8). Select the “test setup” setting on the flow controller and slowly increase the flow rate until the electronic flow meter displays the desired total flow rate.
  3. Using the valves (Figure 2E-5), adjust the flow rate through each of the five lung lobes: Right Upper (RU), Right Middle (RM), Right Lower (RL), Left Upper (LU), and Left Lower (LL). Once the lobe flow rates shown on the flow meters (Figure 2E-4) are steady at the desired value, check the overall flow rate again on the electronic flow meter to verify that there are no leaks in the system.
    1. If there is a discrepancy in the total flow rate, lower the flow rate with the flow controller, set all valves to the fully open configuration, and repeat steps 4.2 and 4.3.
      NOTE: Results presented here were obtained using air flow profiles based on data reported by Sul et al.10 These lobar flow fractions were calculated using thin-slice computed tomography images of patient lungs at full inspiration and expiration, comparing the relative changes in the volume of each lung lobe. Results are presented for two distinct flow conditions, both at an overall inlet flow rate of 1 L/min. The healthy lung lobe outlet flow profile is distributed to each outlet by the following percentage of the inlet flow: LL-23.7%, LU-23.7%, RL-18.7%, RM-14.0%, RU-20.3%. The COPD lobe outlet flow profile is distributed between each outlet by the following percentage of the inlet flow: LL-10.0%, LU-29.0%, RL-13.0%, RM-5.0%, RU-43.0%9,10.
  4. Exit the “test setup” function of the flow controller but leave the vacuum pump on.
    NOTE: Turning the vacuum pump off in between setting the flow rates and performing the deposition experiment can lead to inaccuracies in the flow profile generated. It is recommended to leave the vacuum pump on once desired flow rates are set to complete the aerosol deposition testing.

5. Delivery of aerosol to the lung model

NOTE: Experiments must be performed in a fume hood with the sash closed to minimize exposure to any aerosols generated by the nebulizer.

  1. Fill nebulizer with solution of desired fluorescent particles (Figure 2A-1) and connect to the lung model inlet (Figure 2B).
    NOTE: Results presented here were obtained using 30 mL of a 1:100 dilution of 1 μm fluorescent polystyrene particles in methanol.
    1. To validate the experimental setup, connect the nebulizer directly to the lung model inlet without any targeting device.
    2. To measure the efficacy of a targeting device, connect the nebulizer to the device and insert the device into the lung model.
  2. Connect the compressed air line to the nebulizer and close the fume hood sash as much as possible.
  3. Set the flow controller to run for one 10 s trial. Before pressing start, open the compressed air valve slightly to begin generating an aerosol within the nebulizer.
  4. Press start on the flow controller and immediately open the compressed air valve fully. Once the flow controller reaches about 9 s, begin to close the compressed air valve.
  5. Once the compressed air valve is fully closed, disconnect the nebulizer from the compressed air line, fully close the fume hood sash, shut off the vacuum pump, and let any aerosols clear from the fume hood for about 10 min.
    NOTE: It is important to shut the vacuum pump off after completing a run to prevent a vacuum from building up within the tubing system.
  6. After waiting for a sufficient amount of time, disconnect the lung model from the tubing system, taking special care not to crack the barbed tubing connections.
  7. Remove the lobe outlet caps by running a pair of tweezers under the edge of the cap and gently lifting it off the lung model.
  8. Remove the filter paper from the cap and place it into a 24 well plate with the side onto which particles deposited being on the bottom facing the well of the plate. Repeat for the remaining outlets and label the well corresponding to each lobe.
    NOTE: To prevent any residual particle deposition from impacting subsequent experiments, it is important to rinse both the lung model and cap components with IPA or appropriate solvent in between runs. This can be collected and included in the analysis as desired. Additionally, a log is kept to ensure all replicas used have been minimally exposed to IPA to maintain part integrity, and visual part inspection is recommended prior to use.

6. Outlet filter paper imaging

  1. Place the well plate into the digital fluorescence microscope and set the microscope to 4x magnification and the appropriate fluorescence channel.
  2. Visually identify which lobe’s filter paper has the highest amount of particle deposition and use the “Auto Expose” function. Take note of the resulting exposure and integration time values.
  3. Apply this exposure to all the filters for the run and assess whether the setting produces a satisfactory image for all high deposition areas of the filters.
    NOTE: Focus settings can be changed from filter to filter; however, all the filters for a given run must be analyzed at the same exposure settings. It is only possible to have one frame of focus at a time, so bends or tears in the filter paper may prevent all the deposited particles in the view from being in focus. This can be avoided by ensuring the filter paper is flat against the bottom of the well plate.
  4. Take at least three images of each lobe’s filter paper at random locations and save as .tiff files.

7. Quantification of particle deposition

  1. Import all the filter paper pictures for a given run into an ImageJ session.
  2. Change each image’s type to 8-bit by selecting Image | Type | 8-bit.
  3. Open the picture with the highest fluorescence and select Image | Adjust | Threshold to open a threshold window. Adjust the threshold values to minimize background signal from the filter paper and clearly define the edges of particles. See Figure 3 for depictions of good-quality and poor-quality thresholding.
    NOTE: For filters with high levels of deposition, a “corona” of fluorescence, caused by the diffraction of light by the filter paper fibers, may be observed around large groupings of particles. When thresholding these images, a range that is too large displays small dots or “feather-like” shapes around these groupings, as observed in the “poor” threshold images in Figure 3. This can be improved by gradually increasing the lower limit of the threshold until the signal from the filter paper fibers is minimized without obscuring the signal from the particles themselves.
  4. Propagate the threshold settings for the highest fluorescence image to all other images.
  5. Quantify the number of particles and the total fluorescent area by selecting Analyze | Analyze Particles.
    NOTE: Data sets are compared using Sidak’s Multiple Comparisons Test and a two-way ANOVA. Additionally, deposition in just the lobe of interest is compared using a Student T-test assuming equal variance.

Evaluating Regional Pulmonary Deposition using Patient-Specific 3D Printed Lung Models

Learning Objectives

Particles in this size range (1-5 μm) and flow conditions (1-10 L/min) follow the fluid stream lines based on both their theoretical Stokes number and in vivo data; therefore, in the absence of a targeted delivery device, particles released into the lung model are expected to deposit according to the percentage of total airflow diverted to each lobe. The relative amounts of particle delivery to each lobe can then be compared to clinical lobe flow rate data obtained through analyzing patient-specific high-resolution computed tomography (HRCT) scans10. A validated experimental set-up will yield a non-targeted particle deposition profile that has no statistically significant difference from the clinical air flow profile. Validation data is presented for two distinct flow conditions: 1 L/min in a healthy lung (Figure 4A) and 1 L/min in a lung affected by COPD (Figure 4B). Under both these conditions, the experimentally determined deposition profile was not statistically different from the clinical data, demonstrating that the set-up accurately mimics the distribution of air flow to each of the lung lobes. These baseline deposition profiles served as the control against which targeted particle deposition profiles are compared.

To illustrate this protocol’s ability to quantify changes in regional pulmonary deposition, data were included for the testing of two different targeting devices: a modified endotracheal (ET) tube (Figure 5B) and a concentric cylinder device (Figure 5E). Both these devices featured a 2 mm ID outlet with tunable location for targeted particle release. The modified ET tube was assessed with the intubated lung model for its ability to target particle deposition to both the Left Lower (LL) Lobe and Right Lower (RL) Lobe. Compared to the non-targeted particle deposition profile, this device generated a nearly four-fold increase in LL Lobe delivery (T-test p=0.004, n=3) in addition to diverting over 96% of delivered particles to the Left Lung (T-test p=0.0001, n=3) (Figure 5A). Altering the release location setting to target the RL Lobe, this device generated more than doubles particle delivery to the RL Lobe (T-test p=0.02, n=3) and diverted 94% of delivered particles to the Right Lung (T-test p=0.0005, n=3) (Figure 5C). This indicates that the device is highly successful in producing the intended deposition profile modulation. The concentric cylinder device was tested in the full lung model with an intended target of the Left Upper (LU) Lobe. Compared to the non-targeted particle deposition profile, this device caused a nearly three-fold increase in LU Lobe delivery (T-test p=0.0003, n=3) in addition to diverting over 87% of delivered particles to the Left Lung (T-test p=0.002, n=3) (Figure 5D). Targeting efficiency can also be observed qualitatively by comparing the images of the target lobe filter to the other outlet filters. As depicted in Figure 3, the most effective targeting method will yield high particle deposition at the intended lobe of interest and low deposition at the remaining lobe outlets. For further demonstrations of the capabilities of this protocol, please see the experiments performed by Kolewe et al9.

Figure 1
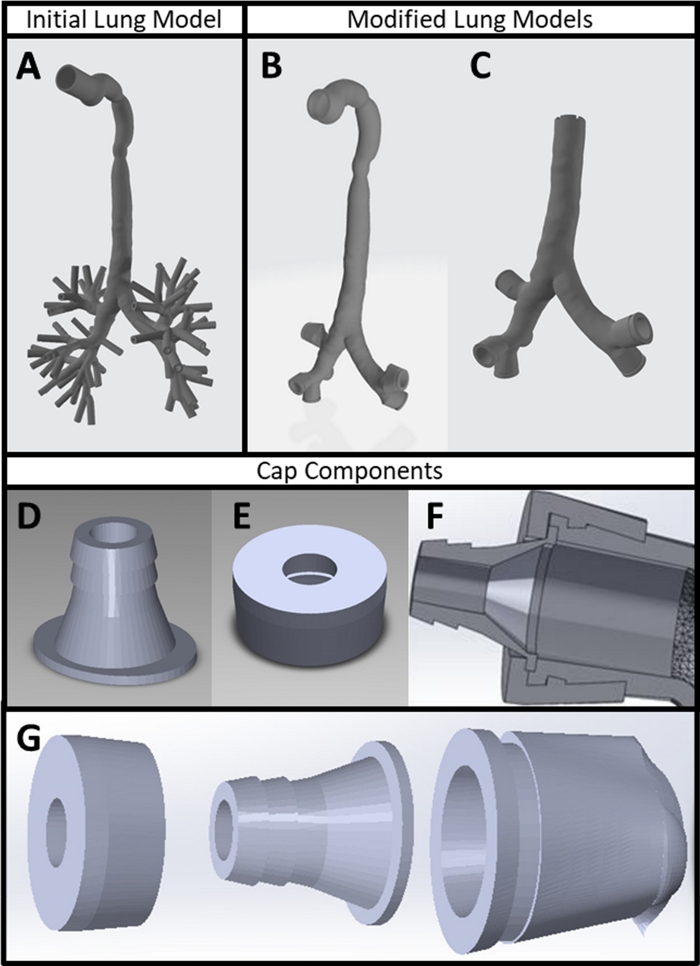
Figure 1: 3D printed experimental components. (A) Patient CT scan converted into 3D part file using CT scan and mesh editing software. (B) Lung model with lobe outlet modifications made in mesh editing and 3D modeling software. (C) Lung model with inlet modified in 3D modeling software to reflect an intubated patient. (D) Barbed tubing connection and (E) cap designed in 3D modeling software. (F) Cross-section of 3D model depicting the interlocking nature of the lung model outlets with the cap and barbed tubing connection. (G) Exploded view of lung model outlet cap assembly. Please click here to view a larger version of this figure.

Figure 2
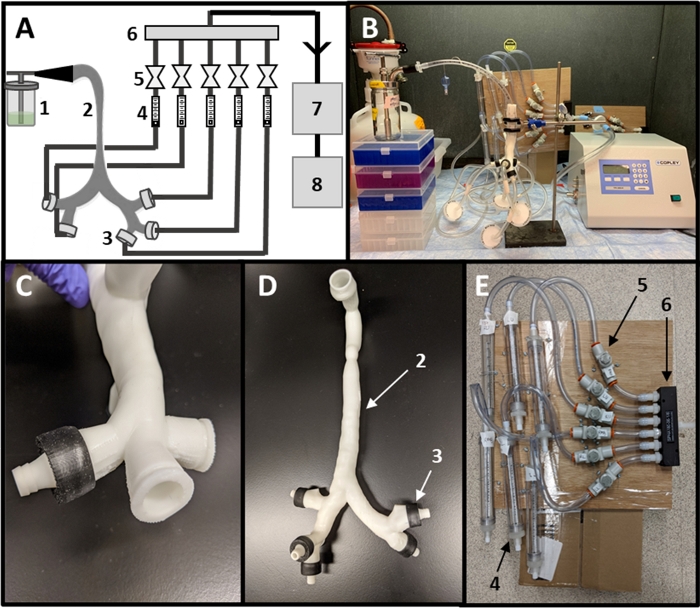
Figure 2: Assembly of experimental setup. (A) Schematic of experimental setup including (1) nebulizer, (2) lung model, (3) outlet caps, (4) flow meters, (5) valves, (6) manifold, (7) flow controller and (8) a vacuum pump. (B) Fully assembled setup. (C) Close-up of lobe outlet with assembled cap. (D) Lung model with all caps added. (E) Close-up of tubing network for setting lobe outlet flow rates. Please click here to view a larger version of this figure.

Figure 3
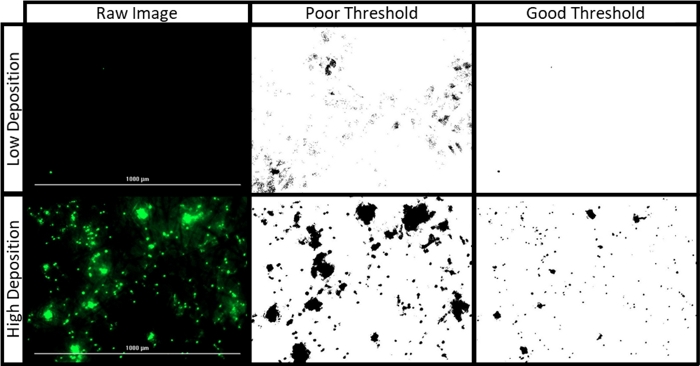
Figure 3: Filter paper image processing. The raw images presented were collected during an experiment to target the left lung using 1 μm fluorescent polystyrene particles at 1 L/min under a healthy breathing profile. The “high” and “low” deposition images depict the LL and RU Lobe filters, respectively. The “good” threshold, applied with a range of 43 to 255, maintains defined edges between individual particles and avoids detection of filter paper fibers. The “poor” threshold, applied with a range of 17 to 255, obscures individual particle borders and overestimates the fluorescent area of the filter. Please click here to view a larger version of this figure.

Figure 4
Figure 4: Experimental setup validation. (A) Validation results for healthy patients and (B) a COPD patient at 1 L/min. All data presented are mean ± SD with three replicates (excepting clinical COPD data, where only one patient was reported). Clinical reference data for healthy and COPD patients were obtained from Sul, et al10. Data sets were compared using Sidak’s Multiple Comparisons Test, and all differences are not significant. Please click here to view a larger version of this figure.

Figure 5
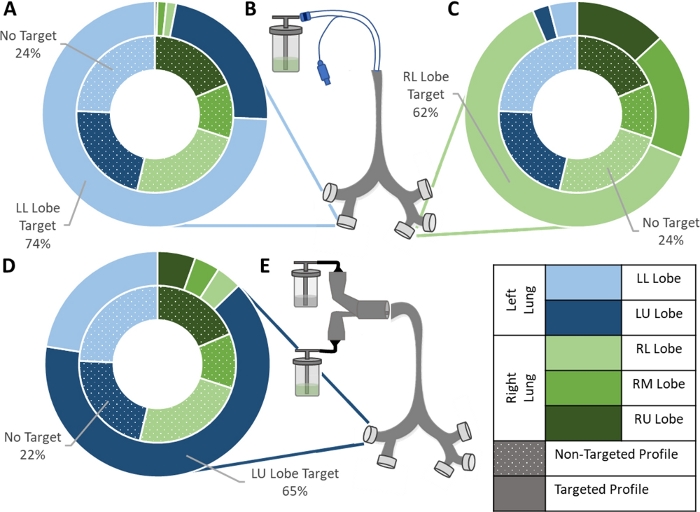
Figure 5: Example data for targeting experiments. (A) Left Lower Lobe and (C) Right Lower Lobe targeting achieved using (B) a modified ET tube delivery system. (D) Left Upper Lobe targeting achieved using (E) a concentric tube delivery system. For all three data sets, the inner ring represents the non-targeted deposition profile obtained during setup validation, and the outer ring represents the deposition profile produced with the addition of the indicated targeting device. Means of three replicates for each setup are shown. Data sets were compared using Sidak’s Multiple Comparisons Test and a Student T-test assuming equal variance. All three setups produced a significant increase in delivery to the lobe of interest: LL Lobe (T-test p=0.004, n=3), RL Lobe (T-test p=0.02, n=3), and LU Lobe (T-test p=0.0003, n=3). Please click here to view a larger version of this figure.

List of Materials

1/4" Plastic Barbed Tube Fitting McMaster Carr 5372K111
10 um Filter Paper Fisher 1093-110
1um Fluorescent Polystyrene Particles Polysciences 15702-10
1um Non-Fluorescent Polystyrene Particles Polysciences 8226
2-Propanol Fisher A516-4 Referred to in protocol as "IPA"
3/8" Plastic Barbed Tube Fitting McMaster Carr 5372K117
Air Flow Meter (1 – 280 mL/min) McMaster Carr 41695K32 Referred to in protocol as "flow meter"
Carbon M1 3D Printer Carbon 3D https://www.carbon3d.com/, Associated software referred to in protocol as "slicing software"
Collison Jet Nebulizer CH Technologies ARGCNB0008 (CN-25) 6 Jet MRE style horizontal collision with glass jar, Referred to in protocol as "nebulizer", http://chtechusa.com/Manuals/MRE_Collison_Manual.pdf
Convection Oven Yamato DKN602
Copley Critical Flow Controller TPK2000 Reve 120V MSP Corp 0001-01-9810 Referred to in protocol as "flow controller"
Copley High Capacity Pump Model HCP5 MSP Corp 0001-01-9982 Referred to in protocol as "vacuum pump"
Cytation BioTek CYT5MPV Multifunctional Spectrophotometer/Fluorescent imager equiped with 4x/20x/40x objectives and DAPI/GFP/TexasRed laser/filter cubes
EPU40 Resin Carbon 3D https://www.carbon3d.com/materials/epu-elastomeric-polyurethane/, Referred to in protocol as "soft resin"
Filter for vacuum pump Whatman 6722-5000
Flow Meter Model DFM 2000 MSP Corp 0001-01-8764 Referred to in protocol as "electronic flow meter"
ImageJ Software ImageJ https://imagej.nih.gov/ij/download.html
Inline Air Flow Control Valve (Push-to-Connect) McMaster Carr 62005K333 Referred to in protocol as "valve"
Inline Filter Devices Whatman WHA67225000
Marine-Grade Plywood Sheet McMaster Carr 62005K333 Referred to in protocol as "wooden board"
Materialise Mimics Software Materialise https://www.materialise.com/en/medical/mimics-innovation-suite, Referred to in protocol as "CT scan software"
Meshmixer Software Autodesk http://www.meshmixer.com/, Referred to in protocol as "mesh editing software"
Methanol Fisher A454-4
Opticure LED Cube APM Technica 102843 Referred to in protocol as "UV oven"
PR25 Resin Carbon 3D https://www.carbon3d.com/materials/uma-urethanemethacrylate, /Referred to in protocol as "hard resin"
PVC Tube for Chemicals McMaster Carr 5231K161 1/4" ID
Screws
SolidWorks Software Dassault Systèmes SolidWorks Corporation https://www.solidworks.com/, Referred to in protocol as "3D modeling software"
Straight Flow Rectangular Manifold McMaster Carr 1125T31
Tubing to Flow Controller McMaster Carr 5233K65 3/8" ID
Wire

Lab Prep

Development of targeted therapies for pulmonary diseases is limited by the availability of preclinical testing methods with the ability to predict regional aerosol delivery. Leveraging 3D printing to generate patient-specific lung models, we outline the design of a high-throughput, in vitro experimental setup for quantifying lobular pulmonary deposition. This system is made with a combination of commercially available and 3D printed components and allows the flow rate through each lobe of the lung to be independently controlled. Delivery of fluorescent aerosols to each lobe is measured using fluorescence microscopy. This protocol has the potential to promote the growth of personalized medicine for respiratory diseases through its ability to model a wide range of patient demographics and disease states. Both the geometry of the 3D printed lung model and the air flow profile setting can be easily modulated to reflect clinical data for patients with varying age, race, and gender. Clinically relevant drug delivery devices, such as the endotracheal tube shown here, can be incorporated into the testing setup to more accurately predict a device’s capacity to target therapeutic delivery to a diseased region of the lung. The versatility of this experimental setup allows it to be customized to reflect a multitude of inhalation conditions, enhancing the rigor of preclinical therapeutic testing.

Development of targeted therapies for pulmonary diseases is limited by the availability of preclinical testing methods with the ability to predict regional aerosol delivery. Leveraging 3D printing to generate patient-specific lung models, we outline the design of a high-throughput, in vitro experimental setup for quantifying lobular pulmonary deposition. This system is made with a combination of commercially available and 3D printed components and allows the flow rate through each lobe of the lung to be independently controlled. Delivery of fluorescent aerosols to each lobe is measured using fluorescence microscopy. This protocol has the potential to promote the growth of personalized medicine for respiratory diseases through its ability to model a wide range of patient demographics and disease states. Both the geometry of the 3D printed lung model and the air flow profile setting can be easily modulated to reflect clinical data for patients with varying age, race, and gender. Clinically relevant drug delivery devices, such as the endotracheal tube shown here, can be incorporated into the testing setup to more accurately predict a device’s capacity to target therapeutic delivery to a diseased region of the lung. The versatility of this experimental setup allows it to be customized to reflect a multitude of inhalation conditions, enhancing the rigor of preclinical therapeutic testing.

Procedure

Development of targeted therapies for pulmonary diseases is limited by the availability of preclinical testing methods with the ability to predict regional aerosol delivery. Leveraging 3D printing to generate patient-specific lung models, we outline the design of a high-throughput, in vitro experimental setup for quantifying lobular pulmonary deposition. This system is made with a combination of commercially available and 3D printed components and allows the flow rate through each lobe of the lung to be independently controlled. Delivery of fluorescent aerosols to each lobe is measured using fluorescence microscopy. This protocol has the potential to promote the growth of personalized medicine for respiratory diseases through its ability to model a wide range of patient demographics and disease states. Both the geometry of the 3D printed lung model and the air flow profile setting can be easily modulated to reflect clinical data for patients with varying age, race, and gender. Clinically relevant drug delivery devices, such as the endotracheal tube shown here, can be incorporated into the testing setup to more accurately predict a device’s capacity to target therapeutic delivery to a diseased region of the lung. The versatility of this experimental setup allows it to be customized to reflect a multitude of inhalation conditions, enhancing the rigor of preclinical therapeutic testing.

Tags