This study involves brain tissue samples from human participants, reviewed and approved by TMH and IITB IEC – (IITB-IEC/2018/019). The participants provided their informed and written consent to participate in this study.
1 Protein extraction from brain tissue
2 Protein quantification and quality check
3 Protein digestion
4 Desalting and peptide quantification
NOTE: Desalting or peptide clean-up is essential before loading the samples for LC-MS/MS. Salts and other contaminants in the sample can clog the columns and cause damage to the instrument as well. The process can be performed using commercially available C18 stage-tips or columns.
5 Transition list preparation of finalized targets
NOTE: A transition refers to the pair of precursors (Q1) to product (Q3) m/z values in an MRM experiment. A peptide can have one to many transitions, with the same Q1 value but different Q3 values. A triple quadrupole mass spectrometer requires information of the transitions for the peptides and their products to be detected. Hence, before starting a targeted experiment, a transition list needs to be prepared. This can be done using the online repository of SRMAtlas6 (https://db.systemsbiology.net/sbeams/cgi/PeptideAtlas/GetTransitions) or an open source software called Skyline7 (https://skyline.ms/project/home/software/Skyline/begin.view).
6 LC parameters
7 MS parameters
NOTE: The explained assay has been developed and optimized for TSQ Altis Triple Quadrupole Mass Spectrometer.
8 Run sequence and Instrument QC
9 Method refinement
We performed relative quantification of 3 proteins from 10 samples, 5 samples from each group of patients with abnormalities in the brain. These proteins included Apolipoprotein A-I (APOA-I), Vimentin (VIM) and Nicotinamide phosphoribosyltransferase (NAMPT) which are known to perform diverse roles in the brain cells. Post-run analysis of the data was performed using Skyline-daily (Ver 20.2.1.286). A total of 10 peptides corresponding to 3 proteins were monitored. These included 3 peptides for APOA-I, 4 peptides for VIM and 3 peptides for NAMPT. The total number of transitions from these 10 peptides amounted to 57. The samples were grouped into either of the two groups depending on the condition they belonged to. Using the group comparisons feature of skyline, the peak abundances of these peptides were compared, and relative quantification values were calculated (Figure 3).
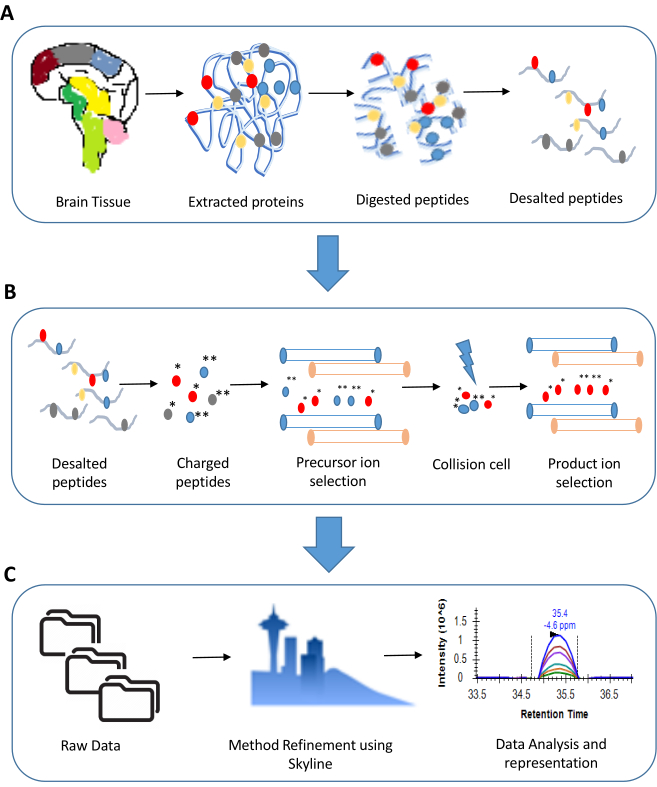
Figure 1: An overview of steps involved in a Multiple Reaction Monitoring experiment. A. Sample preparation for a typical proteomics experiment involves extraction of proteins (for illustration we have shown tissue sample) followed by digestion using trypsin. The digested peptides are ultimately desalted and made LC-MS ready. B. The steps involved in an MRM experiment include precursor and product ion selection based on their m/z values. Only the transitions showing good response are considered for analysis. C. The data analysis in an MRM experiment includes a detailed examination of peak shapes and peak areas. This is ultimately followed by statistical analysis of the results. Please click here to view a larger version of this figure.
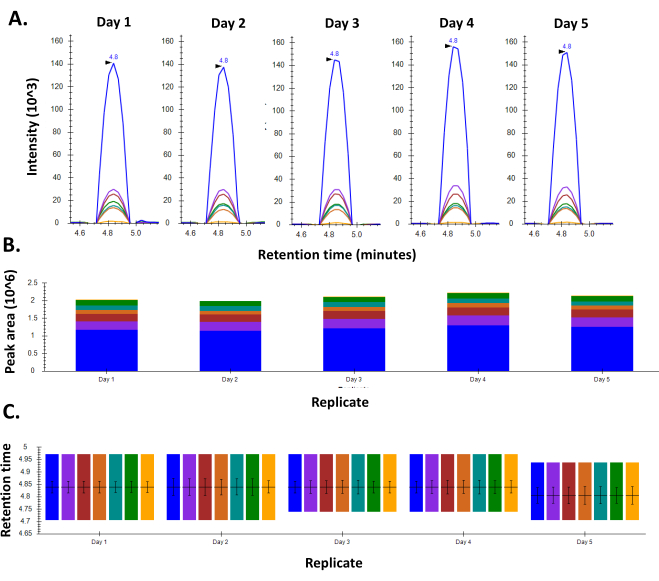
Figure 2: Consistency in response for BSA using an optimized MRM method. A. Chromatogram for a representative peptide of BSA shows consistent peak shape and intensity throughout the five days the experiment was performed. B. Retention time consistency observed for the peptide on all the five days of the experiment C. Peak areas for the peptide as seen over the course of five days in the week. Please click here to view a larger version of this figure.
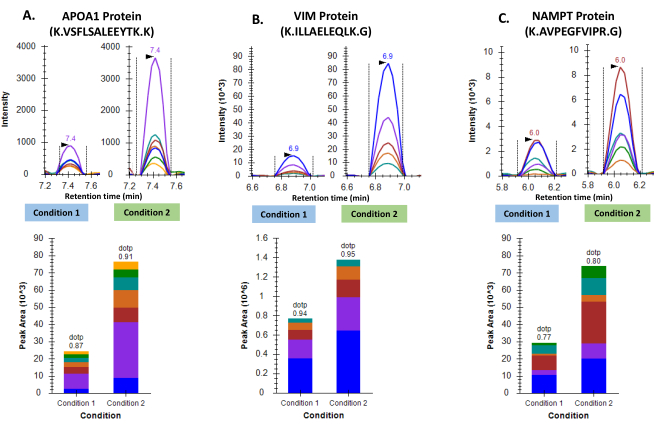
Figure 3: Differential regulation of three proteins in two groups of GBM tumor samples. A. Representative chromatograms for Apolipoprotein A-I and cumulative peak area as seen following inter-group comparison. B. Representative chromatograms for Vimentin and cumulative peak area as seen following inter-group comparison. C. Representative chromatograms for Nicotinamide phosphoribosyltransferase and cumulative peak area as seen following inter-group comparison. Please click here to view a larger version of this figure.
Table S1: Details of 10-minute LC gradient to be used for all samples. Please click here to download this Table.
Table S2: Parameter settings for the ion source. Please click here to download this Table.
Table S3: Parameter settings for MRM method. Please click here to download this Table.
Reagents | |||
Acetonitrile (MS grade) | Fisher Scientific | A/0620/21 | |
Bovine Serum Albumin | HiMedia | TC194-25G | |
Calcium chloride | Fischer Scienific | BP510-500 | |
Formic acid (MS grade) | Fisher Scientific | 147930250 | |
Iodoacetamide | Sigma | 1149-25G | |
Isopropanol (MS grade) | Fisher Scientific | Q13827 | |
Magnesium Chloride | Fischer Scienific | BP214-500 | |
Methanol (MS grade) | Fisher Scientific | A456-4 | |
MS grade water | Pierce | 51140 | |
Phosphate Buffer Saline | HiMedia | TL1006-500ML | |
Protease inhibitor cocktail | Roche Diagnostics | 11873580001 | |
Sodium Chloride | Merck | DF6D661300 | |
TCEP | Sigma | 646547 | |
Tris Base | Merck | 648310 | |
Trypsin (MS grade) | Pierce | 90058 | |
Urea | Merck | MB1D691237 | |
Supplies | |||
Hypersil Gold C18 column | Thermo | 25002-102130 | |
Micropipettes | Gilson | F167380 | |
Stage tips | MilliPore | ZTC18M008 | |
Zirconia/Silica beads | BioSpec products | 11079110z | |
Equipment | |||
Bead beater (Homogeniser) | Bertin Minilys | P000673-MLYS0-A | |
Microplate reader (spectrophotometer) | Thermo | MultiSkan Go | |
pH meter | Eutech | CyberScan pH 510 | |
Probe Sonicator | Sonics Materials, Inc | VCX 130 | |
Shaking Drybath | Thermo | 88880028 | |
TSQ Altis mass spectrometer | Thermo | TSQ02-10002 | |
uHPLC – Vanquish | Thermo | VQF01-20001 | |
Vacuum concentrator | Thermo | Savant ISS 110 |
The proteomic analysis of the human brain tissue over the last decade has greatly enhanced our understanding of the brain. However, brain related disorders continue to be a major contributor of deaths around the world, necessitating the need for even greater understanding of their pathobiology. Traditional antibody-based techniques like western blotting or immunohistochemistry suffer from being low-throughput besides being labor-intensive and qualitative or semi-quantitative. Even conventional mass spectrometry-based shotgun approaches fail to provide conclusive evidence to support a certain hypothesis. Targeted proteomics approaches are largely hypothesis driven and differ from the conventional shotgun proteomics approaches that have been long in use. Multiple reaction monitoring is one such targeted approach that requires the use of a special mass spectrometer called the tandem quadrupole mass spectrometer or triple quadrupole mass spectrometer. In the current study, we have systematically highlighted the major steps involved in performing a successful tandem quadrupole mass spectrometry-based proteomics workflow using human brain tissue with an aim to introduce this workflow to a broader research community.