Science Education
>

Laser Capture Microdissection on Surgical Tissues to Identify Aberrant Gene Expression in Impaired Wound Healing in Type 2 Diabetes

Instructor Prep
concepts
Student Protocol
JoVE Journal
Biology
A subscription to JoVE is required to view this content.  Sign in or start your free trial.
JoVE Journal Biology
Laser Capture Microdissection on Surgical Tissues to Identify Aberrant Gene Expression in Impaired Wound Healing in Type 2 Diabetes

This protocol relies on the provision of human surgical tissue. Ethical approval and informed patient consent were obtained prior to experimentation, and the study conformed with the principles outlined in the Declaration of Helsinki.

1. Collection of tissue and ex vivo wounding

  1. Collect surgical tissue following limb amputation/surgery into a sterile container containing Dulbecco's Modified Eagle Medium (DMEM) with 5% penicillin-streptomycin-fungizone, 2 mM L-glutamine and 10% fetal bovine serum (FBS; complete growth medium).
    NOTE: Tissue collected in this manner can be stored at 4 °C for up to 24 h prior to experimentation. To ensure viability of tissue for ex vivo experiments, it is recommended to process the tissue as soon as possible or to maintain a fixed time gap between collection and wounding to standardize experiments across multiple tissue donations. If the tissue is to be stored for any amount of time, an RNA stabilization solution should be added to the sample to maintain RNA integrity.
  2. Using sterile forceps, transfer the tissue to a 60 mm Petri dish filled with sterile phosphate buffered saline (PBS) supplemented with 5% penicillin-streptomycin-fungizone. Trim the fat off the dermis using a sterile scalpel and/or surgical scissors and discard. Transfer the tissue to a fresh petri dish filled with sterile PBS.
  3. Attach two sterile blades together such that there is a 1 mm gap between the two blades. Score two parallel linear lines, ~1 mm apart, across the length of the epidermis and the upper part of the papillary dermis10,11.
  4. Remove the epidermis between the score lines using sterile forceps and surgical scissors to create a linear wound.
  5. Use a scalpel to cut the tissue into small rectangles (maximum size of 1 cm2) encompassing the wound with intact epidermis on either side.
    NOTE: To maintain tissue and subsequent RNA integrity, steps 1.2-1.5 should be conducted as quickly as possible.
  6. Take an image of the wounded tissue using a microdissection microscope at 4x magnification ensuring the field of view captures the entirety of the wound and the surrounding intact epidermal tissue.
  7. Using sterile forceps, place the tissue rectangles on a tissue culture insert in a 6-well plate and gently pipette 2 mL of complete growth medium into the well. This will ensure that the sample is cultured at the liquid-air interface.
  8. Incubate at 37 °C in 5% CO2 in air for up to 120 h.
    ​NOTE: The tissue should be imaged on a microdissection microscope at the same magnification as in step 1.6 at the end of the incubation. Images can also be taken every 24 h if necessary.

2. Tissue fixation and cryosectioning

  1. Snap freeze the tissue in liquid nitrogen. Place a small amount of cryostat-compatible cutting medium onto a cryostat chuck and embed the tissue within it. Orient the tissue perpendicular to the chuck so that the cutting face will cut through all the layers of the skin including the wounded area. Store at -80 °C.
    NOTE: The protocol can be paused here.
  2. Clean the cryostat at room temperature with 70% ethanol and RNase decontamination spray. Set the cryostat temperature to -28 °C.
  3. Check that the orientation of chuck and cryostat blade can produce sections that encompass the full thickness of the tissue including the wounded tissue and underlying dermis.
  4. Using the cryostat, cut up to ten 7 µm sections from each wound and place on to RNA-free microdissection slides.
  5. Store the slides in the original box that the microdissections slides were provided in at -80 °C to ensure an RNase-free environment.
    ​NOTE: The protocol can be paused here but be aware RNA degradation will increase the longer the storage time is.

3. Laser capture microdissection

  1. Place the microdissection slides with the tissue section in dry ice and go to the laser capture microdissection microscope room.
  2. Air-dry the 1st slide and quickly proceed to stain the sections with hematoxylin using an RNase-free hematoxylin and eosin staining kit immediately prior to performing laser capture microdissection.
  3. Visualize the wounded tissue using a laser capture microdissection microscope at 10x magnification and take a picture of the area of interest that will be laser captured.
  4. Trace around that area (for example, epithelial tongue, granulation tissue, microvessels) and collect into microdissection 0.5 mL diffuser isolation caps using the software instructions for the particular microscope that is being used.
  5. Re-visualize and image the laser captured area of interest using the laser capture microdissection microscope at 10x magnification to demonstrate the location and complete excision of the dissected tissue.
    NOTE: Perform laser capture for each sample (up to 10 sections) for a maximum time of 1 h to minimize RNA degradation.
  6. Add RNA storage buffer to the tube containing the microdissected tissue according to manufacturer's instructions, and store in dry ice until it can be transferred to a -80°C freezer.
    ​NOTE: The protocol can be temporarily paused here.

4. Quantification of differential gene expression

  1. Centrifuge the sample tubes at full speed for 1 min.
  2. Isolate RNA from the microdissected tissue following the manufacturer's instructions.
  3. Elute the RNA in a final volume of 12 µL of RNase free water and amplify the RNA using an RNA amplification kit and thermal cycler, according to manufacturer's instructions. Two rounds of amplification are recommended to ensure sufficient RNA for further analysis. Use the amplification conditions in Table 1.
First amplification round Second amplication round
First strand synthesis First strand synthesis
Step Temperature Time Step Temperature Time
1 65 °C 5 min 1 65 °C 5 min
2 4 °C hold 2 4 °C hold
3 42 °C 45 min 3 25 °C 10 min
4 4 °C hold 4 37 °C 45 min
5 37 °C 20 min 5 4 °C hold
6 95 °C 5 min
7 4 °C hold Second strand synthesis
Step Temperature Time
Second strand synthesis 1 95 °C 2 min
Step Temperature Time 2 4 °C hold
1 95 °C 2 min 3 37 °C 15
2 4 °C hold 4 70 °C 5 min
3 25 °C 5 min 5 4 °C hold
4 37 °C 10 min
5 70 °C 5 min In vitro transcription
6 4 °C hold Step Temperature Time
1 42 °C 6 h
In vitro transcription 2 4 °C hold
Step Temperature Time 3 37 °C 15 min
1 42 °C 3 h 4 4 °C hold
2 4 °C hold
3 37 °C 15 min
4 4 °C hold

Table 1: Amplification conditions.

  1. Quantify the concentration and purity of the amplified RNA. Absorbance ratios of A260/230 (purity) and A260/280 (contaminants) > 1.8 are suitable for further analysis.
    NOTE: Purified amplified RNA can be used for focused gene expression studies (steps 4.5-4.6) or can be sent away for microarray analysis.
  2. Synthesize cDNA using high-capacity cDNA reverse transcription kit according to manufacturer's instructions. Representative conditions are as follows:
    • 25 °C for 10 min
    • 37 °C for 2 h
    • 85 °C for 5 min
    • 4 °C hold
  3. Perform quantitative PCR using 0.5 µL of cDNA and 1 µM primers (of the gene of interest) according to manufacturer's instructions. Representative conditions and primer sequences are as follows.
    1. Use the following conditions for quantitative PCR conditions: 95 °C for 10 minutes; 40 cycles of 95°C for 15 s and 62°C for 1 min; 95 °C for 5 min; and 4°C hold.
    2. Use the following primer sequences:
      GAPDH
      Forward    5'-TATAAATTGAGCCCGCAGCC-3'
      Reverse    5'-CGACCAAATCCGTTGACTCC-3'

      KRT17
      Forward    5'-AGGGAGAGGATGCCCACCTG-3'
      Reverse    5'-GCGGGAGGAGATGACCTTGC-3'

5. Data interpretation

  1. Calculate the rate of wound healing using the images of the ex vivo tissue generated in steps 1.6-1.8 using ImageJ. There are multiple recent publications highlighting different variations on how to automatically analyze wound areas in ImageJ12,13,14.
  2. Quantify gene expression by using the ΔCT method, comparing the threshold cycles for the gene of interest compared to that of the housekeeper (e.g., glyceraldehyde-3-phosphate; GAPDH). To do this, note the CT value for the housekeeper and for the gene of interest.
    1. Calculate the difference between the two CT values to normalize the amount of mRNA present and control for differences in RNA extraction concentrations between different isolations:
      ΔCT = CT (gene of interest) – CT (housekeeper)
    2. Calculate the magnitude of difference between the CT values to give the relative quantification of the gene of interest, expressed as a percentage of the housekeeper:
      ​Relative quantification = (2-ΔCT) x 100
    3. Examine differences between different patient donors/disease states by comparing the relative quantifications of the genes of interest for each sample.
      NOTE: A schematic of the entire technique can be found in Figure 1.

Laser Capture Microdissection on Surgical Tissues to Identify Aberrant Gene Expression in Impaired Wound Healing in Type 2 Diabetes

Learning Objectives

Following the protocol, a 48 h timepoint was chosen to generate representative results. The creation of the initial wound in surplus tissue from elective cosmetic surgery can be seen in Figure 2A where the excised wound is clearly visible. Haematoxylin and eosin staining confirms that this has generated a full thickness wound (Figure 2B). After 48 h, partial closure of the wound is visible under the light microscope (Figure 2C). Histological staining reveals the epithelial tongue that is progressing to heal the wound (Figure 2D), demonstrating that the ex vivo wound healing model is a valid proxy for in vivo wound healing.

After sectioning and staining with haematoxylin and eosin, the healing wound was visualized on the laser capture microdissection system and the wound area selected (Figure 3A). This area was completely excised using this method as can be seen in Figure 3B. RNA quality and purity was reasonable (analyzed by RNA integrity number (RIN); Figure 3C) – poor quality amplified RNA would have many peaks and troughs indicating multiple degradation products. Isolation of small tissue sections may yield RNA that is of a very low concentration that makes valid interpretation of qPCR difficult. Figure 3D demonstrates the variation in RNA concentration to be expected using this technique, with a range of 2.00 to 6.15 ng/mL. Importantly, even dilute samples were able to give robust CT values for both housekeeper (GAPDH) and skin-specific genes of interest (keratin 17; KRT17; Figure 3E), confirming the suitability of the technique for comparative transcriptomic studies.

Figure 1
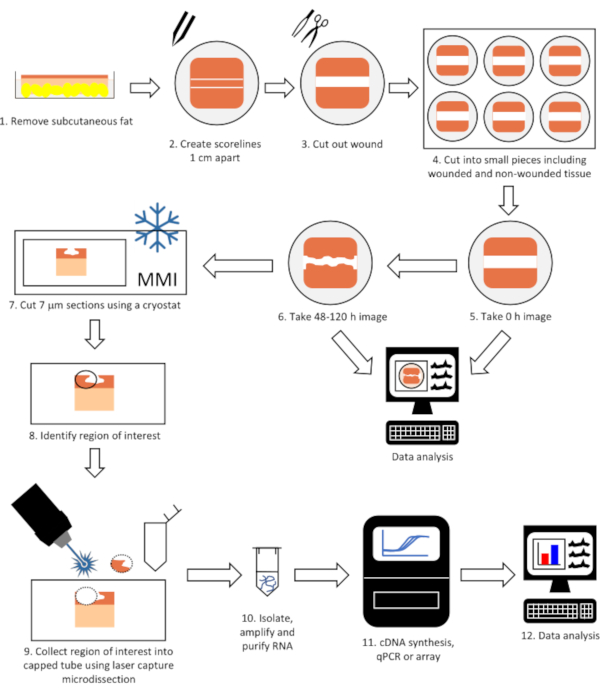
Figure 1: Flow diagram of the complete technique to perform gene expression analysis on laser microdissected tissue from wounded skin. Tissue is wounded, allowed to heal in a tissue incubator and imaged (steps 1-6) before being cut into 7 μm sections using a cryostat (step 7). The region of interest (e.g. epithelial tongue) is identified and collected using laser capture microdissection (steps 8-9) and RNA isolated, purified and gene expression determined (steps 10-12). Please click here to view a larger version of this figure.

Figure 2
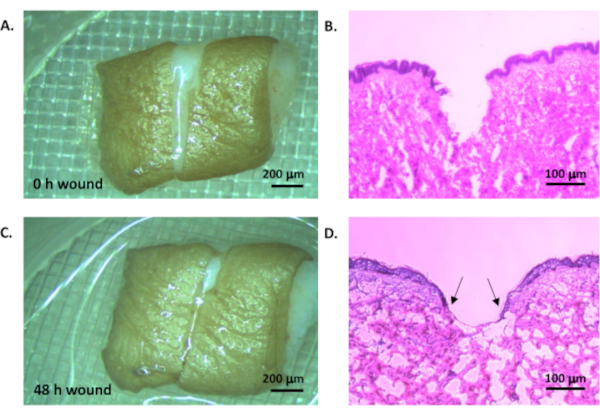
Figure 2: Ex vivo wound model. Human tissue was wounded by creating two parallel cuts and removing the tissue between to leave a uniform wounded area (A, light microscope, scale bar = 200 µm; B, haemoatoxylin and eosin staining, scale bar = 100 µm). The tissue was cultured in a standard tissue culture incubator at 37°C in 5% CO2 in air for 48 h (C, light microscope, scale bar = 200 µm; D, haematoxylin and eosin staining, scale bar = 100 µm). Arrow heads indicate epithelial tongue. Please click here to view a larger version of this figure.

Figure 3
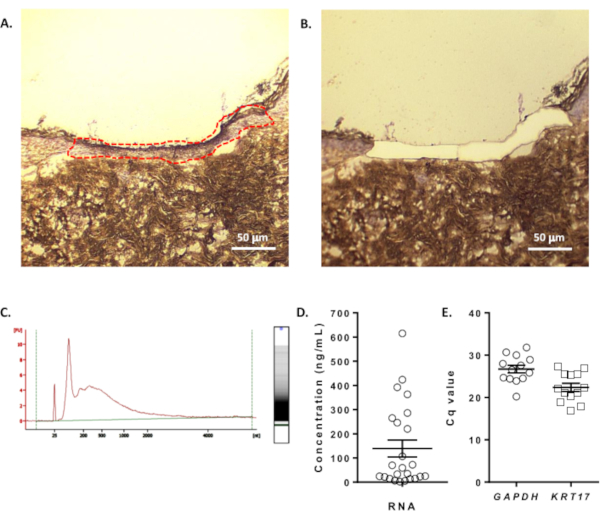
Figure 3: Laser capture microdissection and gene expression. A. The region of interest (in this case, healed tissue) was identified using haematoxylin staining and collected using laser capture microdissection. B. The same region imaged after microdissection. Scale bars = 50 µm. C. Representative electropherogram of RNA that was isolated, amplified and quantified from the laser microdissected tissue. D. RNA concentration from collected tissue (n=24 samples). E. Reproducible detection of GAPDH and KRT17 expression using qPCR (n=13 samples, mean ± SEM). Please click here to view a larger version of this figure.

List of Materials

Arcturus RiboAmp PLUS kit ThermoFisher Scientific KIT0521 RNA amplification kit
Diffuser Caps 0.5mL MMI K10028161 Laser capture microdissection caps; 50 pack
Dulbecco’s Modified Eagle Medium (DMEM) Sigma-Aldrich D6046 With 1000 mg/L glucose, L-glutamine, and sodium bicarbonate, liquid, sterile-filtered, suitable for cell culture
Foetal Bovine Serum Thermo Fisher Scientific 10270106 Cell culture supplement
H&E Staining Kit Plus MMI K10028305 Rnase-free haematoxylin and eosin staining kit
High capacity cDNA reverse transcription kit Applied Biosystems 4368814 Reverse transcription kit
L-glutamine Thermo Fisher Scientific 25030149 Cell culture supplement
MembraneSlides MMI K10028153 Laer capture microdissection slides; 5 per box
Netwell Mesh Insert Corning 3479 Cell culture insert
Penicillin-Streptomycin-Fungizone Thermo Fisher Scientific 15070-063 Cell culture supplement
15290-026
OCT Tissue-Tek Sakura 4583 Cryostat-compatible cutting medium
PBS Thermo Fisher Scientific 10209252 Five tablets per 100ml sterile water and then autoclaved for cell culture use
RNeasy Micro Kit Qiagen 74004 RNA extraction kit
RNase Away Sigma-Aldrich 83931 RNase spray
Sterile blades Scientific Laboratory Supplies INS4974 Tissue dissection implements
Support Slide MMI K10028159 Laser capture microdissection support slide, RNase-free
Surgical scissors Scientific Laboratory Supplies INS4860 Tissue dissection implements
Surgical forceps Scientific Laboratory Supplies INS2026 Tissue dissection implements
SYBR Green Supermix Applied Biosystems 4344463 Quantitative PCR mastermix

Lab Prep

The global prevalence Type 2 diabetes mellitus (T2DM) is escalating at a rapid rate. Patients with T2DM suffer from a multitude of complications and one of these is impaired wound healing. This can lead to the development of non-healing sores or foot ulcers and ultimately to amputation. In healthy individuals, wound healing follows a controlled and overlapping sequence of events encompassing inflammation, proliferation, and remodelling. In T2DM, one or more of these steps becomes dysfunctional. Current models to study impaired wound healing in T2DM include in vitro scratch wound assays, skin equivalents, or animal models to examine molecular mechanisms underpinning wound healing and/or potential therapeutic options. However, these do not fully recapitulate the complex wound healing process in T2DM patients, and ex vivo human skin tests are problematic due to the ethics of taking punch biopsies from patients where it is known they will heal poorly. Here, a technique is described whereby expression profiles of the specific cells involved in the (dys)functional wound healing response in T2DM patients can be examined using surplus tissue discarded following amputation or elective cosmetic surgery. In this protocol samples of donated skin are collected, wounded, cultured ex vivo in the air liquid interface, fixed at different time points and sectioned. Specific cell types involved in wound healing (e.g., epidermal keratinocytes, dermal fibroblasts (papillary and reticular), the vasculature) are isolated using laser capture microdissection and differences in gene expression analyzed by sequencing or microarray, with genes of interest further validated by qPCR. This protocol can be used to identify inherent differences in gene expression between both poorly healing and intact skin, in patients with or without diabetes, using tissue ordinarily discarded following surgery. It will yield greater understanding of the molecular mechanisms contributing to T2DM chronic wounds and lower limb loss.

The global prevalence Type 2 diabetes mellitus (T2DM) is escalating at a rapid rate. Patients with T2DM suffer from a multitude of complications and one of these is impaired wound healing. This can lead to the development of non-healing sores or foot ulcers and ultimately to amputation. In healthy individuals, wound healing follows a controlled and overlapping sequence of events encompassing inflammation, proliferation, and remodelling. In T2DM, one or more of these steps becomes dysfunctional. Current models to study impaired wound healing in T2DM include in vitro scratch wound assays, skin equivalents, or animal models to examine molecular mechanisms underpinning wound healing and/or potential therapeutic options. However, these do not fully recapitulate the complex wound healing process in T2DM patients, and ex vivo human skin tests are problematic due to the ethics of taking punch biopsies from patients where it is known they will heal poorly. Here, a technique is described whereby expression profiles of the specific cells involved in the (dys)functional wound healing response in T2DM patients can be examined using surplus tissue discarded following amputation or elective cosmetic surgery. In this protocol samples of donated skin are collected, wounded, cultured ex vivo in the air liquid interface, fixed at different time points and sectioned. Specific cell types involved in wound healing (e.g., epidermal keratinocytes, dermal fibroblasts (papillary and reticular), the vasculature) are isolated using laser capture microdissection and differences in gene expression analyzed by sequencing or microarray, with genes of interest further validated by qPCR. This protocol can be used to identify inherent differences in gene expression between both poorly healing and intact skin, in patients with or without diabetes, using tissue ordinarily discarded following surgery. It will yield greater understanding of the molecular mechanisms contributing to T2DM chronic wounds and lower limb loss.

Procedure

The global prevalence Type 2 diabetes mellitus (T2DM) is escalating at a rapid rate. Patients with T2DM suffer from a multitude of complications and one of these is impaired wound healing. This can lead to the development of non-healing sores or foot ulcers and ultimately to amputation. In healthy individuals, wound healing follows a controlled and overlapping sequence of events encompassing inflammation, proliferation, and remodelling. In T2DM, one or more of these steps becomes dysfunctional. Current models to study impaired wound healing in T2DM include in vitro scratch wound assays, skin equivalents, or animal models to examine molecular mechanisms underpinning wound healing and/or potential therapeutic options. However, these do not fully recapitulate the complex wound healing process in T2DM patients, and ex vivo human skin tests are problematic due to the ethics of taking punch biopsies from patients where it is known they will heal poorly. Here, a technique is described whereby expression profiles of the specific cells involved in the (dys)functional wound healing response in T2DM patients can be examined using surplus tissue discarded following amputation or elective cosmetic surgery. In this protocol samples of donated skin are collected, wounded, cultured ex vivo in the air liquid interface, fixed at different time points and sectioned. Specific cell types involved in wound healing (e.g., epidermal keratinocytes, dermal fibroblasts (papillary and reticular), the vasculature) are isolated using laser capture microdissection and differences in gene expression analyzed by sequencing or microarray, with genes of interest further validated by qPCR. This protocol can be used to identify inherent differences in gene expression between both poorly healing and intact skin, in patients with or without diabetes, using tissue ordinarily discarded following surgery. It will yield greater understanding of the molecular mechanisms contributing to T2DM chronic wounds and lower limb loss.

Tags