Eighteen patients with hemiplegia after stroke were recruited in this study. The average age of the participants was 51.61 ± 12.97 years; all were males. The proportion of left and right hemiplegia was 10/8; the average Brunnstrom stage was 4.50 ± 0.76. The average of MMSE and MoCA were 26.56 ± 1.67 and 20.06 ± 2.27, respectively. Other demographic characteristics (including stroke type and time of onset) are shown in Table 1. For the original data of gait dual-tasks (Task 1 and Task 2), there was no statistical difference in the spatiotemporal parameters (Table 2). However, in the joint angle parameters, the bilateral trunk rotation (transversal plane) was larger in Task 2 than in Task 1 (left side: Task 1, 18.40 ± 5.76 vs. Task 2, 26.35 ± 14.92, P = 0.004; right side: Task 1, 18.39 ± 7.04 vs. Task 2, 24.08 ± 18.18, P = 0.001). Bilateral pelvic rotation (transversal plane) was larger in Task 2 than in Task 1 (left side: Task 1, 20.71 ± 7.97 vs. Task 2, 21.31 ± 6.96, P = 0.024; right side: Task 1, 27.56 ± 9.71 vs. Task 2, 29.264 ± 11.17, P = 0.006). The differences were statistically significant (Table 3).
For the DTC values of gait dual-tasks (Task 1 and Task 2), the bilateral trunk obliquity (frontal plane) was higher in Task 2 than in Task 1 (left side: Task 1, 2.60 ± 36.38 vs. Task 2, -23.4 ± 40.62, P = 0.006; right side: Task 1, -10.82 ± 47.58 vs. Task 2, -11.42 ± 30.10, P = 0.013). The bilateral pelvic rotation (transversal plane) was higher in Task 2 than in Task 1 (left side: Task 1, -2.75 ± 36.20 vs. Task 2, -23 ± 40.36, P = 0.011; right side: Task 1, 1.66 ± 43.72 vs. Task 2, -31.89 ± 58.50, P = 0.006). All differences were statistically significant (Table 4 and Figure 2). At the same time, the right Cadence was significantly decreased in Task 2 relative to that in Task 1 (right side: Task 1, 18.40 ± 5.76 vs. Task 2, 26.35 ± 14.92, P = 0.044), and the right GPS was significantly decreased in Task 2 relative to that in Task 1 (right side: Task 1, 20.71 ± 4.87 vs. Task 2, 24.24 ± 10.33, P = 0.047) (Table 5 and Figure 3).
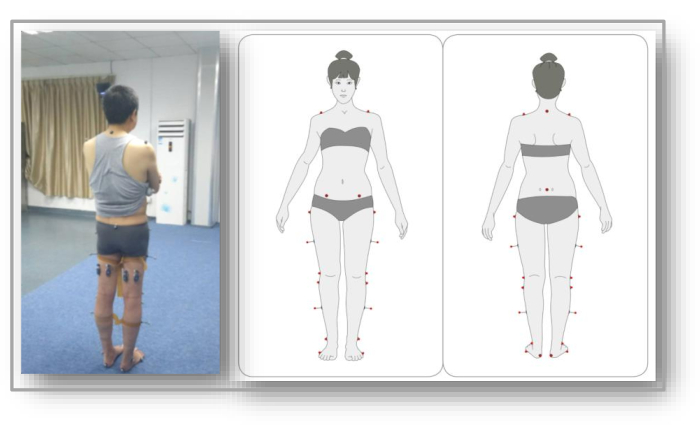
Figure 1: The gait analysis settings are based on the Davis protocol. Please click here to view a larger version of this figure.
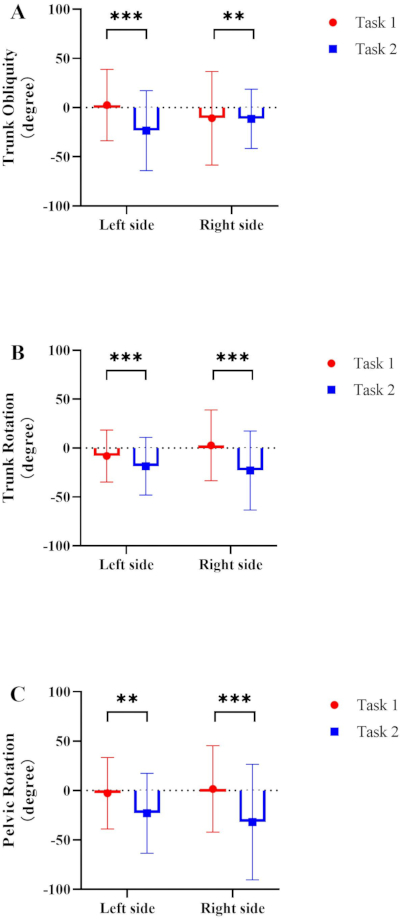
Figure 2: Comparing the DTC values of trunk and joint angle parameters of the simple motor dual-task (Task 1) and complex motor dual-task (Task 2). (A) Trunk obliquity (frontal plane); (B) trunk rotation (transversal plane); (C) pelvic rotation (transversal plane). Abbreviation: DTC = dual-task gait cost. Please click here to view a larger version of this figure.
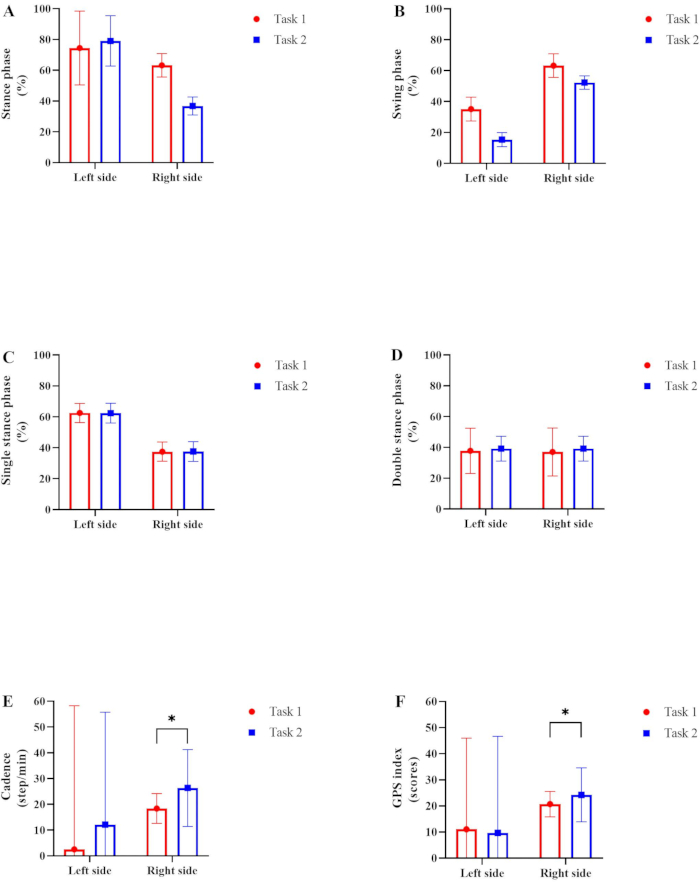
Figure 3: Comparing the DTC values of spatiotemporary parameters of the simple motor dual-task (Task 1) and the complex motor dual-task (Task 2). Percentages of (A) stance phase and (B) swing phase are shown for one gait cycle. Percentages of (C) single stance phase and (D) double stance phase are shown for one gait cycle. (E) The cadence and (F) GPS index are shown. Abbreviations: DTC = dual-task gait cost; GPS = Gait Performance Score. Please click here to view a larger version of this figure.
| Subject | Sex | Age (years) | Hemorrhage/infarct | Hemiplegic side | Stroke onset (months) | Brunnstrom-stage (LE) | MMSE | MoCA | 10MWT (customized speed) | 10MWT (fast speed) | TUGT (s) |
| 001 | male | 30 | Hemorrhage | right | 29 | 5 | 25 | 18 | 0.52 | 0.62 | 26 |
| 002 | male | 59 | Infarct | left | 26 | 6 | 30 | 23 | 0.43 | 0.52 | 36 |
| 003 | male | 27 | Infarct | left | 26 | 5 | 24 | 19 | 0.46 | 0.48 | 48 |
| 004 | male | 54 | Hemorrhage | right | 23 | 5 | 26 | 18 | 0.56 | 0.61 | 58 |
| 005 | male | 63 | Infarct | left | 23 | 4 | 29 | 23 | 0.62 | 0.72 | 28 |
| 006 | male | 45 | Infarct | left | 23 | 5 | 25 | 19 | 0.56 | 0.63 | 33 |
| 007 | male | 67 | Hemorrhage | left | 22 | 4 | 28 | 17 | 0.59 | 0.67 | 45 |
| 008 | male | 42 | Infarct | left | 21 | 3 | 29 | 23 | 0.67 | 0.73 | 27 |
| 009 | male | 38 | Infarct | right | 18 | 4 | 28 | 20 | 0.52 | 0.67 | 26 |
| 010 | male | 70 | Infarct | left | 31 | 4 | 26 | 23 | 0.64 | 0.68 | 30 |
| 011 | male | 49 | Hemorrhage | left | 17 | 4 | 24 | 20 | 0.46 | 0.53 | 45 |
| 012 | male | 42 | Infarct | left | 19 | 3 | 27 | 16 | 0.43 | 0.56 | 49 |
| 013 | male | 45 | Infarct | right | 26 | 5 | 26 | 24 | 0.56 | 0.74 | 29 |
| 014 | male | 45 | Hemorrhage | right | 28 | 4 | 26 | 19 | 0.64 | 0.73 | 27 |
| 015 | male | 54 | Infarct | right | 18 | 5 | 25 | 21 | 0.52 | 0.65 | 33 |
| 016 | male | 68 | Infarct | right | 14 | 5 | 27 | 20 | 0.57 | 0.59 | 42 |
| 017 | male | 69 | Infarct | left | 15 | 5 | 26 | 18 | 0.52 | 0.63 | 38 |
| 018 | male | 62 | Infarct | right | 24 | 5 | 27 | 20 | 0.61 | 0.72 | 31 |
| mean±SD | 51.61±12.97 | NA | NA | 22.39±4.70 | 4.50±0.76 | 26.56±1.67 | 20.06±2.27 | 0.55±0.07 | 0.64±0.08 | 36.17±9.29 |
Table 1: Basic characteristics of study subjects. Values are presented as a number or mean ± standard deviation. Abbreviations: MMSE = Mini-Mental State Examination; MoCA = Montreal Cognitive Assessment; 10MWT = 10-meter walk test; TUGT = timed up and go test; SD = standard deviation; LE = lower extremity; s = second.
| Left side | Right side | |||||||
| Task 1 | Task 2 | Difference | P value | Task 1 | Task 2 | Difference | P value | |
| Stance phase (%) | 20.71±7.97 | 21.31±6.96 | 0.60±10.58 | 0.916 | 18.02±4.86 | 20.66±7.41 | 2.64±8.86 | 0.254 |
| Swing phase (%) | 27.56±9.71 | 29.26±11.17 | 1.70±14.80 | 0.285 | 23.68±6.74 | 29.88±12.19 | 6.20±13.93 | 0.916 |
| Single stance (%) | 26.91±5.41 | 31.09±11.67 | 4.18±12.86 | 0.519 | 31.16±9.27 | 27.80±10.67 | -3.36±14.13 | 0.583 |
| Double stance (%) | 24.72±7.10 | 31.31±5.99 | 6.59±9.29 | 0.291 | 37.55±17.79 | 44.10±12.60 | 6.55±21.80 | 0.369 |
| Cadence (steps/min) | 18.40±5.76 | 26.35±14.92 | 7.95±15.99 | 0.521 | 18.39±7.04 | 24.08±18.18 | 5.79±19.50 | 0.720 |
| GPS (scores) | 17.91±7.24 | 23.09±9.49 | 5.18±11.94 | 0.580 | 20.71±4.87 | 24.24±10.33 | 3.53±11.42 | 0.058 |
Table 2: Differences in spatiotemporary parameters of the simple motor dual-task (Task 1) and complex motor dual-task (Task 2). Values are presented as a number or mean ± standard deviation. Statistical significance was set as P < 0.05 and marked in bold. Abbreviations: GPS = Gait Performance Score; min = minute.
| Left side | Right side | |||||||
| Task 1 | Task 2 | Difference | P value | Task 1 | Task 2 | Difference | P value | |
| Trunk Obliquity (Frontal plane) | 27.86±7.45 | 24.63±4.08 | -3.23±8.49 | 0.263 | 37.91±4.76 | 48.89±7.56 | 10.98±8.93 | 0.114 |
| Trunk Tilt (Sagittal plane) | 31.43±12.69 | 34.25±12.69 | 2.82±17.95 | 0.238 | 24.64±7.53 | 29.85±16.93 | 5.21±18.53 | 0.582 |
| Trunk Rotation (Transversal plane) | 18.40±5.76 | 26.35±14.92 | 7.95±15.99 | 0.004 | 18.39±7.04 | 24.08±18.18 | 5.69±19.50 | 0.001 |
| Plevic Obliquity (Frontal plane) | 16.99±6.07 | 25.05±15.43 | 8.06±16.58 | 0.277 | 20.66±7.41 | 18.02±4.86 | -2.64±8.86 | 0.937 |
| Plevic Tilt (Sagittal plane) | 23.68±6.74 | 29.88±12.19 | 6.20±13.93 | 0.282 | 34.94±18.29 | 39.31±12.86 | 4.37±22.36 | 0.689 |
| Plevic Rotation (Transversal plane) | 20.71±7.97 | 21.31±6.96 | 0.60±10.58 | 0.024 | 27.56±9.71 | 29.26±11.17 | 1.70±14.80 | 0.006 |
| Hip Ab-Adduction | 20.71±4.87 | 24.24±10.33 | 3.53±11.42 | 0.148 | 17.91±7.24 | 23.09±9.49 | 5.18±11.94 | 0.238 |
| Hip Flex-Extension | 37.55±17.79 | 44.10±21.60 | 6.55±27.98 | 0.544 | 13.00±2.59 | 19.87±10.16 | 6.87±10.48 | 0.531 |
| Hip Rotation | 27.69±11.17 | 28.27±13.78 | 0.58±17.74 | 0.323 | 31.16±9.27 | 27.80±10.67 | -3.36±14.13 | 0.006 |
| Knee Flex-Extension | 26.91±5.41 | 31.09±11.67 | 4.18±12.86 | 0.475 | 23.37±7.75 | 29.16±18.66 | 5.79±20.21 | 0.791 |
| Ankle Dors-Plantarflex | 21.75±11.07 | 27.54±13.41 | 5.79±17.39 | 0.213 | 25.87±10.71 | 25.87±11.50 | 0±15.71 | 0.112 |
Table 3: Differences in trunk and joint angle parameters of the simple motor dual-task (Task 1) and complex motor dual-task (Task 2). Values are presented as a number or mean ± standard deviation. Statistical significance was set as P < 0.05 and marked in bold.
| Left side | Right side | |||||||
| Task 1 | Task 2 | Difference | P value | Task 1 | Task 2 | Difference | P value | |
| Trunk Obliquity (Frontal plane) | 2.60±36.38 | -23.4±40.62 | -26.00±54.53 | 0.006 | -10.82±47.58 | -11.42±30.10 | -0.60±56.30 | 0.013 |
| Trunk Tilt (Sagittal plane) | 15.34±7.74 | 13.40±8.22 | -1.94±11.29 | 0.260 | 16.28±5.12 | 36.62±5.20 | 20.34±7.30 | 0.489 |
| Trunk Rotation (Transversal plane) | -8.15±26.55 | -18.56±29.54 | -10.41±39.72 | 0.004 | 2.75±36.20 | -23.00±40.36 | -25.75±54.22 | 0.001 |
| Pelvic Obliquity (Frontal plane) | 15.34±7.74 | 13.40±8.22 | -1.94±11.29 | 0.153 | 62.51±4.53 | 64.40±6.19 | 1.89±7.67 | 0.962 |
| Pelvic Tilt (Sagittal plane) | 37.49±6.36 | 37.60±6.19 | 0.11±8.88 | 0.097 | 12.89±6.36 | 14.32±3.79 | 1.43±7.43 | 0.510 |
| Pelvic Rotation (Transversal plane) | -2.75±36.20 | -23±40.36 | -20.25±54.22 | 0.011 | 1.66±43.72 | -31.89±58.50 | -30.23±73.03 | 0.006 |
| Hip Ab-Adduction | 83.15±7.21 | 78.49±5.91 | -4.66±9.32 | 0.125 | 84.18±8.81 | 92.56±6.51 | 8.38±10.95 | 0.242 |
| Hip Flex-Extension | 37.49±6.36 | 37.60±6.19 | 0.11±8.88 | 0.392 | 12.89±6.36 | 14.32±3.79 | 1.43±7.40 | 0.583 |
| Hip Rotation | 37.64±6.87 | 36.98±6.21 | -0.66±9.26 | 0.549 | 49.6±8.52 | 56.52±4.52 | 6.92±9.65 | 0.004 |
| Knee Flex-Extension | 50.68±4.89 | 67.63±4.87 | 16.95±6.90 | 0.343 | 78.54±7.92 | 57.95±7.16 | -20.59±10.68 | 0.673 |
| Ankle Dors-Plantarflex | 27.86±7.45 | 24.63±4.08 | -3.23±8.50 | 0.263 | 37.91±4.76 | 48.89±7.56 | 10.98±8.93 | 0.114 |
Table 4: Differences in dual-task gait cost values of trunk and joint angle parameters of the simple motor dual-task (Task 1) and complex motor dual-task (Task 2). Values are presented as a number or mean ± standard deviation. Statistical significance was set as P < 0.05 and marked in bold.
| Left side | Right side | |||||||
| Task 1 | Task 2 | Difference | P value | Task 1 | Task 2 | Difference | P value | |
| Stance phase (%) | 74.44±31.37 | 79.08±16.36 | 4.64±35.38 | 0.916 | 63.24±7.60 | 36.76±5.84 | -26.48±9.58 | 0.236 |
| Swing phase (%) | 35.15±7.74 | 15.34±4.53 | -19.81±8.97 | 0.980 | 63.24±7.61 | 52.28±4.36 | -10.96±8.77 | 0.654 |
| Single stance (%) | 62.51±6.19 | 62.40±6.36 | -0.11±8.88 | 0.348 | 37.49±6.19 | 37.60±6.36 | 0.11±8.88 | 0.671 |
| Double stance (%) | 37.78±14.71 | 39.19±8.05 | 1.41±16.77 | 0.164 | 37.03±15.55 | 39.19±8.05 | 2.16±17.51 | 0.406 |
| Cadence (steps/min) | 2.53±55.72 | 12.13±43.62 | 9.60±70.76 | 0.087 | 18.40±5.76 | 26.35±14.92 | 7.95±15.99 | 0.044 |
| GPS (scores) | 11.1±34.86 | 9.65±37.01 | -1.45±50.84 | 0.681 | 20.71±4.87 | 24.24±10.33 | 3.53±11.42 | 0.047 |
Table 5: Differences in dual-task gait cost values of spatiotemporary parameters of the simple motor dual-task (Task 1) and complex motor dual-task (Task 2). Values are presented as a number or mean ± standard deviation. Statistical significance was set as P < 0.05 and marked in bold. Abbreviations: GPS = Gait Performance Score; min = minute.
Supplementary Table 1: Differences in trunk and joint angle parameters of single motor tasks (Task 0), simple motor dual-task (Task 1), and complex motor dual-task (Task 2) (degree). Values are presented as a number or mean ± standard deviation. Statistical significance was set as P < 0.05 and marked in bold. Please click here to download this Table.
Supplementary Table 2: Differences in spatiotemporary parameters of single motor tasks (Task 0), simple motor dual-task (Task 1), and complex motor dual-task (Task 2). Values are presented as a number or mean ± standard deviation. Statistical significance was set as P < 0.05 and marked in bold. Abbreviations: GPS = Gait Performance Score; min = minute. Please click here to download this Table.