Whole blood and bone marrow samples were obtained and processed in accordance with the 1964 Declaration of Helsinki. Whole blood samples were obtained from healthy donors after giving informed consent (ISPA), within a study approved by our institutional medical ethical committee (Hospital Universitario Central de Asturias -HUCA-). Bone marrow samples were obtained from bone marrow aspirate discard material of patients managed at the Dept. of Hematology of the Hospital Clínico San Carlos (HCSC).
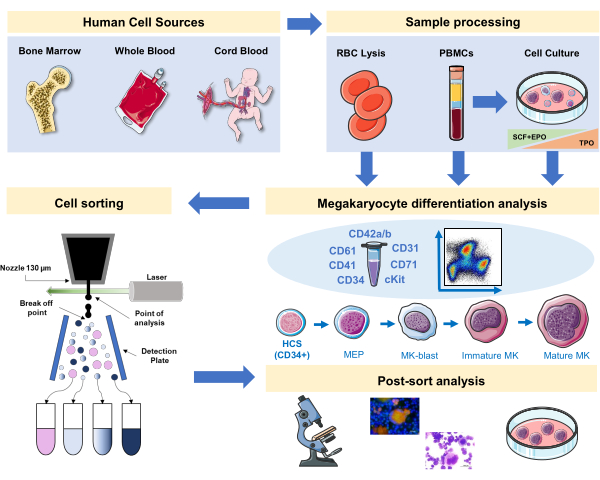
Figure 1: Schematic representation of the protocol documented in this manuscript. The primary human sources or primary cultures where MK differentiation can be staged by using immunophenotyping are indicated. This immunophenotyping strategy can be applied to the study of the process in different lineage-related pathologies or malignancy in primary sources. In addition, it makes possible the cell sorting of MKs and precursors with a fluorescence-activated cell sorter, which allows further analysis of enriched fractions. Images used are part of Servier Medical Art (SMART) by Servier and are licensed under CC BY 3.0. Please click here to view a larger version of this figure.
1. Whole blood and bone marrow processing prior to immunophenotyping
- When using whole blood (WB) from donations as a primary source, optionally isolate the peripheral blood mononuclear cell (PBMC) component. This can be achieved by using standard differential centrifugation combined with density gradient cell separation, as previously described15.
- In brief, centrifuge blood at 193 x g for 15 min (brake 3) at room temperature. Discard the upper plasma fraction and collect the buffy ring. Dilute 1:1 with phosphate buffer saline (PBS)/Trisodium Citrate Dihydrate (38 g/L, pH 7) buffer and pipette carefully a volume of 25 mL on top of 15 mL of a density gradient solution (1.076 g/mL) in 50 mL tubes.
- Centrifuge for 20 min at 1114 x g (accelerator 3, brake 3, room temperature). Discard the plasma fraction and collect the buffy ring containing PBMCs. Wash by adding the same volume of PBS, centrifuge at 435 x g for 5 min, and resuspend in PBS for further use.
- Alternatively, use a WB sample (around 100 μL) for immunophenotyping after lysing the red blood cells (RBCs) and thorough washing.
- In brief, dilute 1:1 in ice cold RBC lysing buffer (4.15 g of NH4Cl, 0.5 g of KHCO3 and 18.5 mg of EDTA (triplex III) to 500 mL of H2O, pH 7.1-7.4). Wait until the cell suspension becomes translucid red (3-5 min).
- Centrifuge at 435 x g for 5 min, at 4 °C, and resuspend the cells in PBS. Repeat the procedure as many times as necessary to obtain a white cell pellet.
- Similarly, directly process the samples obtained from bone marrow (aspiration) with RBC lysing buffer (see point 1.2) and thorough washing, as to begin with a clear single-cell suspension (Figure 1).
- Avoid the use of vortexing to mix samples during processing, as it may damage the fragile MKs. Mix by flicking or inverting the tube.
NOTE: Density gradient to obtain PBMCs may result in a richer and cleaner cell fraction as compared to RBC-lysed WB. However, we should bear in mind that high-density, mature MKs might be lost in the "neutrophil" fraction. This will be discussed in the representative results.
- Avoid the use of vortexing to mix samples during processing, as it may damage the fragile MKs. Mix by flicking or inverting the tube.
2. In vitro MK differentiation from PBMCs
NOTE: MKs can be differentiated in vitro from earlier precursors, such as CD34+ cells, present in different primary sources (i.e., WB/PBMCs, cord blood, bone marrow) and from iPSCs. There are different protocols that have been applied to this end. Here, we use a culture method developed by us that allows MK differentiation from PBMCs, without the need of enriching for CD34+ precursors15,19,20,21,22.
- This protocol consists of three culture phases, where the concentration of thrombopoietin (TPO) gradually increases at the expense of growth factors favoring the proliferation of earlier precursors (i.e., SCF, EPO), which gradually decrease (Figure 2)15.
- For the basis medium, use StemSpan SFEM supplemented with 0.4% of cholesterol rich lipid mix and 1% Penicillin/Streptomycin.
- For the Phase I medium, use the basis medium supplemented with SCF (100 ng/mL), Erythropoietin (EPO, 0.5 U/mL) and Thrombopoietin (TPO, 30 ng/mL). The Phase II medium is the basis medium supplemented with SCF (50 ng/mL), EPO (0.25 U/mL) and TPO (50 ng/mL). For the Phase III medium, use the basis medium supplemented with TPO (100 ng/mL).
- Culture PBMCs in Phase I medium. At day 6-8, place the PBMCs in Phase II medium, and at day 9-12 place the PBMCs in Phase III medium.
- Replace medium by centrifuging cells at 435 x g for 5 min at room temperature from Phase I to Phase II, and at 95 x g for 5 min at room temperature from Phase II to Phase III, and resuspending them in fresh medium.
- Culture cells in an incubator at 37 °C, 5% CO2. In these primary cultures, MK differentiation lasts 10-14 days, and samples can be drawn at different time points throughout the culture period, as to follow MK differentiation.
- For the basis medium, use StemSpan SFEM supplemented with 0.4% of cholesterol rich lipid mix and 1% Penicillin/Streptomycin.
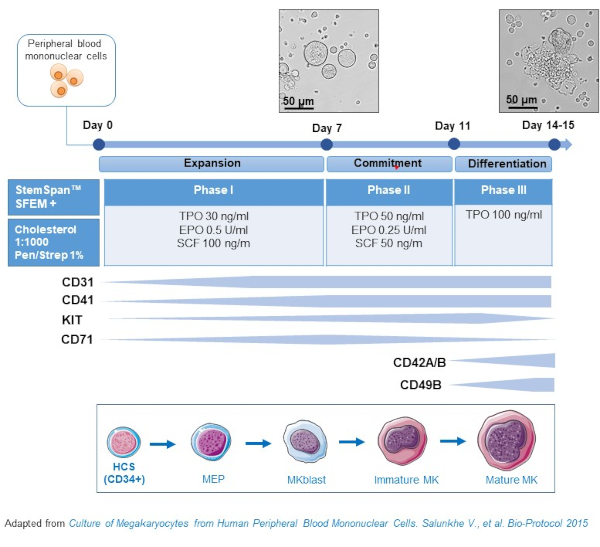
Figure 2: Schematic representation of the PBMC-derived MK culture method. PBMCs from healthy donors were cultured according to the three-phase protocol developed by us to generate MK in vitro (scheme adapted from Salunkhe et al).15 Pictures taken at day 10 and day 13 of culture are shown. Pictures are taken with a 20X objective. Please click here to view a larger version of this figure.
- Sample collection: Wash cells by applying low-speed centrifugation for 5 min (95 x g) and resuspend them in PBS or PBS containing 1% of bovine serum albumin (BSA). For immunophenotyping, the ideal density is 105-106 cells/100 μL (see point 3.1). Depending on the status of the cultures (i.e., presence of dead cells, debris, etc.), 1 or 2 washes may be needed. Collect your cells at the time-points of interest during culture.
3. Immunophenotyping of MK differentiation – incubation with a panel of tagged-antibodies
- Incubate the cell samples with a panel of tagged-antibodies following standard procedures, paying attention to centrifuge at low speed (95 x g) when processing megakaryocytes. We normally incubate the samples with 1% BSA in PBS in volumes of 100 μL at 4 °C, 20 min, with a range of 105-106 cells.
- Scale up when necessary.
- After incubation, add 5 mL of 1% BSA in PBS, centrifuge at low speed (95 x g), aspirate the supernatant and resuspend the sample in 2% BSA in PBS to preserve MK viability (2 mL). Add 1-5 mM EDTA to disrupt cell-cell aggregates (which are naturally seen in MK cultures).
- Transfer samples into a 12 x 75 mm round bottom tube (FACS tube) or plate, keeping them in the dark until flow cytometry analysis or cell sorting.
- Preparation of the single antibodies and antibody panel mixes; setting up the flow cytometer:
- Titrate the antibodies prior to their use to determine the optimal concentration in the antibody panels. The optimal concentration of antibodies is the lowest concentration that separates clearly positive from negative cells (and allows distinction of intermediate levels of expression). As an example, most of the antibodies are used in a 1:200 dilution (stock 100 μg/mL) unless otherwise titrated or indicated by the manufacturer.
- Once the antibody titration is determined, prepare a 10x dilution of each antibody. These dilutions are used for the single-color controls and for preparing the panel mixes. The dilutions and panel mixes are fine for use even a month after preparation (stored at 4 °C, unless manufacturer´s indications preclude these storage conditions). This allows the staining of samples with the same panel through a time period.
- Use 10 μL per 100 μL of the 10x dilution both for the single-color controls and for the panel mix.
- For the single-color controls, use antibody affinity beads, which can be directly measured after adding the antibody. The single-color controls should be measured with every experiment, to allow proper compensation adjustment (and fine-tuning post-measurement with the analysis software).
- Alternatively, perform the single-color controls with cell-samples. However, the beads allow the fast measurement of a given number of events, which, depending on the antibody/surface marker, might not be possible to obtain on complex primary or cultured cell sources. We also advise to run cell samples stained with "Fluorescence Minus One" (FMO) panel mixes to set up the appropriate compensation settings (before running experiments). This is relevant as to carefully identify compensation problems, and especially, in cultured MKs, to identify autofluorescence interference (which will be present if using culture medium containing phenol red).
- Prepare enough volume of the panel mix, depending on the number of samples, containing the antibodies of the designed panel. Most of our panels include six antibodies (6-color panels, see Tables 1-2).
- For these panels, use 488-nm and 633-nm lasers of the flow cytometer, however, panels can be adapted to other technical scenarios. Furthermore, the compensation considerations can be obviated when using mass-spectrometry-based flow cytometry or cytometers with acoustic focusing technology.
- Dyes for measuring viability may give false information regarding MKs, especially when they mature. MKs are very active uptaking cells, and positivity with Hoechst, 7-AAD or PE, might not always reflect actual cell death. An alternative (if cell death measurement is required) might be the use of mitochondria stains (CMX Ros) or amine reactive dyes (Zombie or Ghost dyes).
Table 1: Notes on cell surface markers of the megakaryocytic lineage Please click here to download this Table.
Table 2: Antibody panels Please click here to download this Table.
4. Ploidy analysis combined with 6-color panels
- For ploidy analysis, in combination with a 6-color antibody panel, proceed with fixation and permeabilization of cells after incubation with the antibody panel. This strategy will allow the preservation of the surface marker staining, while allowing the staining of the DNA of cells. We use Hoechst 33342 to stain DNA, as it can be visualized with the available violet 405-nm laser.
- For 105-106 cells, after incubation with the antibody panel, centrifuge cells (95 x g for 5 min), resuspend in 200 μL of fixation buffer and incubate 10 min at room temperature (RT).
- Centrifuge cells as indicated above, resuspended for a second time in 200 μL fixation buffer, and incubate another 10 min at RT.
- Prepare permeabilization buffer, containing 0.1% Triton X-100, 200 mg/mL RNase and 20 mg/mL Hoechst 33342 (permeabilization Hoechst MIX).
- Centrifuge cells as above, resuspend them in 300 μL of the permeabilization Hoechst MIX and incubate 30 min at 37 °C. This step is very important, since, in order to obtain a clean ploidy measurement, RNA has to be degraded.
- After the incubation time, measure samples directly with a flow cytometer. Otherwise, keep the samples at 4 °C, in the dark. Measure them promptly. However, since these samples are fixed, measurement can be delayed even 24-48 hours. Be sure the sample is flicked thoroughly prior to measuring, or passed through a cell strainer, to assure a single cell suspension.
- Morphometric parameters such as Forward and Side Scatter are not maintained after cell fixation. The Forward/Side Scatter plot will show a shrinkage of the cell distribution after fixation. However, the surface marker staining is mostly preserved, and the gating strategy is barely altered, allowing the analysis of the ploidy status at the different stages of differentiation defined by surface marker combinations.
5. MK differentiation analysis
NOTE: We have seen that the combination of CD31/CD71 allows to set a number of gates which correspond to different stages of MK differentiation. Further back-gating with MK-specific markers allows the separation of mature and immature MKs. Furthermore, in fresh samples, back-gating to verify the presence of other markers used, or to place the populations in the Forward/Side Scatter axes, refines the assessment of MK differentiation stages and allows to discard other cell types that could be present on the same populations.
- Use a panel of antibodies that includes early precursor markers (KIT, CD34), common precursor markers (CD31, CD71), and lineage markers, some of them specific (CD42A/CD42B, CD49B, CD41/CD61, CLEC2, GPVI, etc) (see Tables 1-2). The use of Lineage (Lin) cocktail (CD3, CD14, CD16, CD19, CD20, and CD56), also allows to "filter out" mature hematopoietic cells that might add noise to the analysis (when selecting the Lin– population). As an example, we will go through the analysis of MKs in PBMCs, bone marrow and through PBMC-derived cell cultures in the representative results.
6. MK and MK precursor cell sorting
NOTE: The stained cells were analyzed and sorted on a fluorescence-activated cell sorter FACS Aria IIu equipped with 488-nm and 633-nm standard solid-state lasers using FACSDiva software; data were additionally analyzed and presented using FlowJo software and Cytobank (viSNE analysis). Purity of sorted fractions was confirmed by flow cytometry analysis of each of the sorted fractions (purity above 85%).
- Perform cell sorting as soon as possible or within 1 hour after antibody incubation in order to avoid cell deterioration.
- Filter the sample with a 100 µm cell strainer to assure single cell suspension and the integrity of large MK.
- Use a 130-µm ceramic nozzle, a sheath pressure set to 11 pounds per square inch (PSI) and the drop-drive frequency set to 12 kHz to break the stream into drops.
- Prior to sorting, sterilize the nozzle, sheath, and sample lines by performing a 30 min acquisition with Penicillin/Streptomycin diluted 1:5 in sterile water, followed by a 10 min acquisition with sterile water to remove remaining decontaminant.
- Once the stream has stabilized, adjust the drop-delay with recommended beads in order to sort in fine tune mode more than 97.5% of the reflected drops at a flow rate of 400-1200 events per second.
- Prepare collection FACS tubes with 500 µL of 2% BSA in PBS. The percentage of BSA can be increased up to 5-10%.
- Generate the experiment template with the proper compensation matrix parameters.
- Load FACS tube into cytometer.
- Perform a measurement of the sample to set the desired gates and purity of the target cell populations. Maintain the record activated to show up to 200,000 events in the selected population gates during the cell-sorting.
- FACS Aria IIu allows the separation of up to 4 different cell populations at the same time. Create a new sort layout and select the collection device (4 tubes) and appropriate precision mode (intermediate mask of purity and recovery is recommended). Finally, add the population(s) of interest to each sort location field (Figure 3).
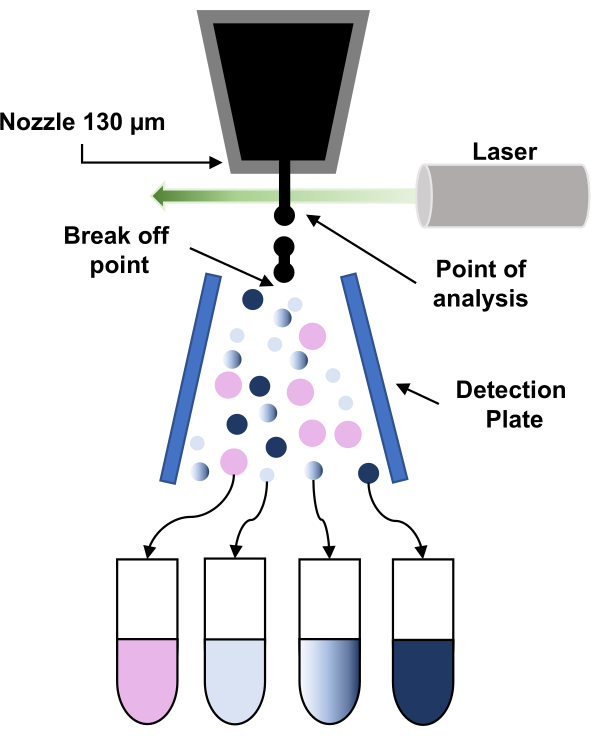
Figure 3: Schematic representation of the principle of fluorescence-activated cell sorting (FACS). The particles go through the 130 µm-nozzle and are forced to break up into a stream of regular droplets due to the application of vibration to the nozzle. Next, the droplets are interrogated by the laser (point of analysis) and the signals are processed to give the ''sort decision" by applying a charge to those droplets. When a charge droplet passes through a high voltage electrostatic field (detection plate), it is deflected and collected into the corresponding collection tube. Please click here to view a larger version of this figure.
- Load the collection tubes and start to sort the target populations.
- Centrifuge the collection tubes for 5 minutes at 95 x g and resuspend the cell pellet in the appropriate volume of 2% BSA in PBS.
- Measure again a fraction of each sorted sample, to calculate the purity.
- Store cells appropriately for further use. Sorted cells can be used for cytological and molecular analyses, or may be re-cultured with the aim of studying the differentiation process of a selected cell population.
7. Post-sort sample preparation
- Preparing cytospins for cytological analysis with a cytocentrifuge
- Bring sorted cells to an easy-to-handle working volume of 100-200 µL. Take into consideration that cell density will depend on the sorted population yield in each case.
- Place a clean slide on the metal holder and place a filter top. Remember to label the slide and the filter to avoid mixing samples.
- Add 100 µL PBS on the filter hole against the slide, so the filter gets humidified on the hole-rim.
- Place the funnel, close the metal holder and place it on its spot in the centrifuge.
- Add the sample (100-200 µL) inside the funnel.
- Centrifuge at 36 x g for 5 minutes. The cytospin slides can be allowed to air dry at RT (properly covered to prevent dust) and can be kept at RT for 1 week prior to the immunostaining or histochemistry.
- For immunostaining
- Fix slides in 2% paraformaldehyde (PFA) diluted in PBS and incubate during 5min.
- A range of 0.5-4% PFA in PBS may be used. In our hands, we use 4% to obtain proper fixation of tissues or some cell types, and 0.5% PFA in PBS is sufficient for platelets. When setting this technique up, the right percentage of PFA requires optimization per cell type/source.
- Incubate 5 min in PBS.
- Incubate 5 min in 50% ethanol (EtOH).
- Incubate 5 min in 70% EtOH.
- Store in 70% EtOH at -20ºC.
- When performing the immunostaining, rehydrate, and follow standard procedures (permeabilization, washing, blocking, primary and secondary antibody incubations, preserving, etc).
- Fix slides in 2% paraformaldehyde (PFA) diluted in PBS and incubate during 5min.
- For cytochemistry:
NOTE: The slides can be stained with May-Grünwald Giemsa staining or the convenient staining for each purpose. - For immediate morphology examination
- Add one drop of mounting medium on the cell-containing spot of the cytospin and place a coverslip.
- Keep slides at 4 °C not longer than a week, unless sealed, which allows long-term storage even at RT. Mounting medium fixation allows long-term storage at RT.
Bone Marrow and Ploidy
In Figure 4, we show a representative immunophenotyping analysis of megakaryopoiesis in BM samples (aspiration) from patients. When plotting the cellular fraction against CD71 and CD31, we have gated six main populations: CD31– CD71– (red), CD31– CD71+ (blue), CD31+ CD71– (orange), CD31+ CD71mid (light green), CD31+ CD71+ (dark green) and CD31++ CD71mid (cream). These populations are not always present in the same positions (considering constant cytometer settings), as it can be seen, and that should be taken into account. This might be inherent to the pathological condition and bone marrow status. Back-gating these six populations overlaid in histograms against a maturation marker contained in the panel (CD42A/CD42B), and to the Forward Scatter, is shown on the right. The figure also shows a plot against CD31/CD71 depicting an overlay of the CD42B+ cells with the total cellular fraction as to visualize the distribution of the more mature MKs. In general terms, the population CD31– CD71– does not contain MKs or lineage precursors, does not present MK maturation markers, and is smaller in size. The CD31– CD71+ population contains mainly cells of the erythroid lineage, although it can also contain common lineage precursors, as we hypothesize from our observations. It remains negative for MK maturation markers, and depending on the proportion of earlier or later erythroid cells, the Forward Scatter might fluctuate as well.
As an example, the myelodysplastic syndrome (MDS) patient has a larger proportion of immature (i.e., larger) erythroid cells, compared to other patients. MK progenitors and mature cells will distribute in the CD31+ cells, with some variation. However, as it can be seen comparing the BM analysis on each pathology, there are some constant features. More mature MKs are present in the CD31++ CD71mid population (cream), and pathologies where this maturation is "blocked" include Immune Thrombocytopenia (ITP) and a reactive BM sample (with underlying inflammation). While in the lymphoma patient there seems to be an equilibrium between early precursors and late MKs (orange and cream gates), this proportion is altered in the MDS patient (with more "blocked" precursors) and in the acute myeloid leukemia (AML) patient (with more mature MKs). Of interest, the "blockade" seems to be different comparing pathologies amongst themselves: in pathologies concurring with underlying inflammation the blockade might be due to a combination of maturation defects, destruction (i.e., autoimmunity) and platelet production by MK rupture.
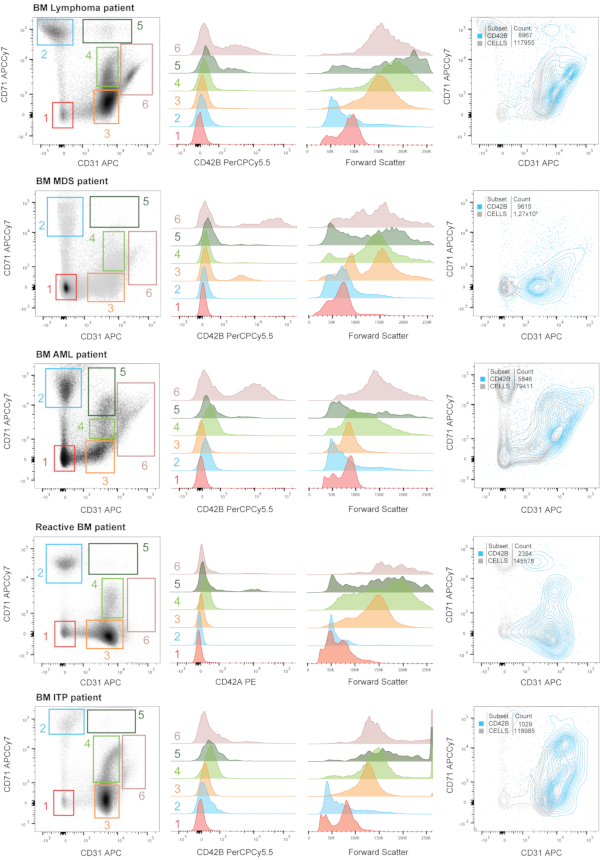
Figure 4: Immunophenotyìng of megakaryopoiesis in human bone marrow samples from patients with different pathologies. Representative bone marrow (BM) samples from patients diagnosed with lymphoma (i.e., normal BM), myelodysplastic syndrome (MDS), acute myeloid leukemia (AML), immune thrombocytopenia (ITP) and a patient with a reactive BM due to an infection were analysed. When plotting the cellular fraction (i.e., nucleated cells) against CD71 and CD31, we have gated six main populations: CD31– CD71– (red), CD31– CD71+ (blue), CD31+ CD71– (orange), CD31+ CD71mid (light green), CD31+ CD71+ (dark green) and CD31++ CD71mid (cream). These populations are not always present in the same positions (considering steady cytometer settings), as it can be seen, and that should be taken into account. Back-gating these six populations overlaid in histograms against a maturation marker contained in the panel (CD42A/CD42B), and to the Forward Scatter, is shown on the right. The figure also shows a plot against CD31/CD71 depicting an overlay of the CD42B+ cells with the total cellular fraction as to visualize the distribution of the more mature MKs. Numbers matching the gates in the dot plot and the histogram overlays are depicted. Please click here to view a larger version of this figure.
We next set out to analyze the ploidy status of the above-mentioned populations on human BM samples. Figure 5 shows an increasing ploidy status within the CD31+ populations, that we foresee will be different and characteristic for each pathological context. Note that due to the cell fixation and permeabilization used in these experiments, the dot plots are not completely comparable to those of unfixed, unpermeabilized samples (Figure 4).
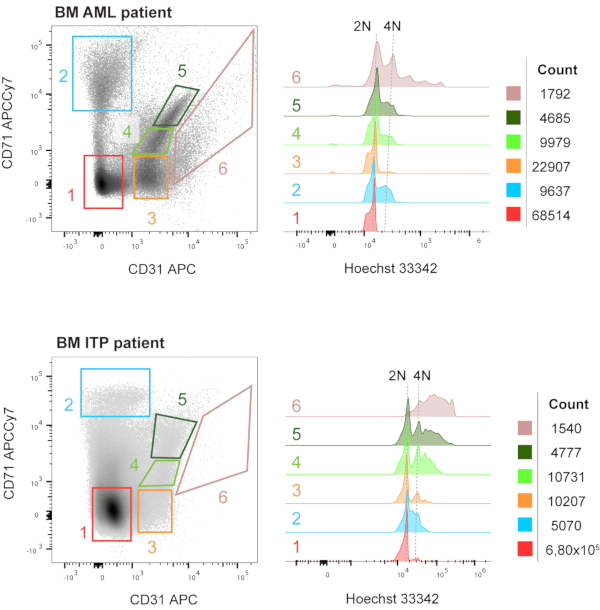
Figure 5: Ploidy analysis of the populations selected based on CD31/CD71 expression, in human BM samples. Representative bone marrow (BM) samples from patients diagnosed with acute myeloid leukemia (AML) and immune thrombocytopenia (ITP). When plotting the cellular fraction (i.e., nucleated cells) against CD71 and CD31, we have gated six main populations: CD31– CD71– (red), CD31– CD71+ (blue), CD31+ CD71– (orange), CD31+ CD71mid (light green), CD31+ CD71+ (dark green) and CD31++ CD71mid (cream). These populations are not always present in the same positions (considering steady cytometer settings), as it can be seen, and that should be taken into account. Back-gating these six populations overlaid in histograms against Hoechst 33342 shows the different ploidy status of the populations, and the general tendency to increase ploidy with maturation (although MKs can reach maturity independently of the polyploidization status). Numbers matching the gates in the dot plot and the histogram overlays are depicted. Please click here to view a larger version of this figure.
PBMCs and Cell Culture
In Figure 6, we show a representative immunophenotyping analysis of PBMCs and the MK culture set with those PBMCs at day 7 and day 11. We use a panel containing the Lin cocktail, and we show the cellular fraction of live cells before and after Lin– selection. This negative selection might result in the loss of some fraction of MKs co-expressing, for example, CD14, but it also allows a more refined analysis. When plotting the Lin– fraction against CD71 and CD31, we gated five main populations: CD31– CD71–, CD31– CD71+, CD31+ CD71–, CD31+ CD71mid and CD31++ CD71mid. These populations are not always present in the same positions (considering constant cytometer settings), as it can be seen, and that should be taken into account. In this case, the differences are not only inherent to the individual health or pathological status, but also to the MK differentiation capacity of the precursors in the PBMC fraction. Back-gating these five populations overlaid in histograms against other markers contained in the panel (KIT and CD42B), and to the Forward Scatter, is shown on the right. MK precursors and MKs at different stages of maturation are within the CD31+ populations.
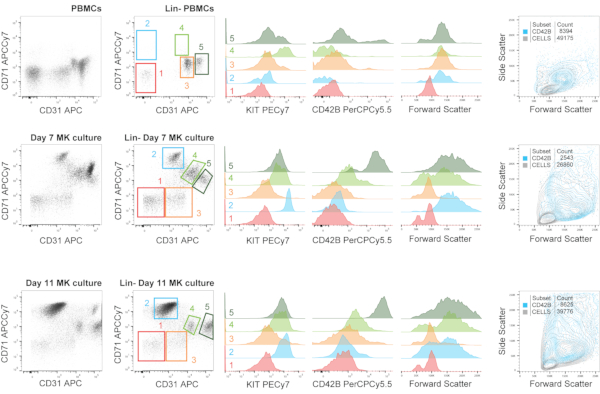
Figure 6: Immunophenotyping of megakaryopoiesis during MK cell culture, including the starting PBMC material. Representative immunophenotyping analysis of PBMCs and the MK culture set with those PBMCs at day 7 and day 11. We use a panel containing the Lin cocktail, and we show the cellular fraction (i.e., nucleated cells) before and after Lin- selection. This negative selection might result in the loss of some fraction of MKs co-expressing, for example, CD14, but it also allows a more refined analysis. When plotting the Lin- fraction against CD71 and CD31, we gated five main populations: CD31– CD71–, CD31– CD71+, CD31+ CD71–, CD31+ CD71mid and CD31++ CD71mid. These populations are not always present in the same positions (considering steady cytometer settings), as it can be seen, and that should be taken into account. Back-gating these five populations overlaid in histograms against other markers contained in the panel (KIT and CD42B), and to the Forward Scatter, is shown on the right. MK precursors and MKs at different stages of maturation are within the CD31+ populations. The figure also shows a plot against CD31/CD71 depicting an overlay of the CD42B+ cells with the total cellular fraction as to visualize the distribution of the more mature MKs. Numbers matching the gates in the dot plot and the histogram overlays are depicted. Please click here to view a larger version of this figure.
Table 3: Population percentages of flow cytometry analyses Please click here to download this Table.
In PBMCs, MKs are within the CD31++ CD71mid gate, although their size is not as large as we have seen with cultured MKs. This might be due to either one of the two following options: MKs in PBMCs represent a fraction of immature MKs that enter the circulation, or a fraction of mature circulating MKs that have lost cytoplasmic complexity. Our sort experiments suggest that the latter might be the reason explaining that size difference. Supporting this notion, the expression of CD42B, is not present in 100% of the cells on those populations (as it can also be seen in BM samples in Figure 4), probably due to the loss of surface markers upon proplatelet formation and/or platelet shedding. However, in cultured samples, the MKs in the "mature" gates, are almost 100% CD42B+, and larger in size. These hypothesized cellular dynamics should be further studied and validated.
Due to the pleiotropic effects of TPO, these cultures are heterogeneous and asynchronous, which per se makes it difficult to further analyze discrete MK differentiation stages.19,20 Following the expansion of earlier progenitors, MKs at different maturation stages will appear in the culture from day 6-10 (or earlier, due to donor variability) and will gradually increase in numbers as the MK lineage-committed cells mature towards MK. Some MKs will undergo terminal differentiation and start forming proplatelets. Towards the end of the culture, there will be a gradual increment of cell loss due to "extenuation/exhaustion" after proplatelet formation and platelet shedding or cell death (Figure 2).
If using TPO analogues instead of recombinant TPO, the concentrations should be tested.
The source of progenitors (adult, cord blood) will condition the cultures, as MKs from sources of different developmental stages have their own characteristics. Furthermore, cultures from enriched CD34+ progenitors, while appearing more homogeneous at the beginning of the culture, will reach a stage of heterogeneity and asynchronicity once MK commitment and differentiation commences19,20.
MK Cell Sorting
In Figure 7, we show a representative gating strategy of a sample of MK in vitro culture at day 10 of differentiation. When plotting the nucleated cell fraction against CD31 and CD71, or the Forward Scatter, we can distinguish two main populations characterized by the presence or absence of CD31.
When plotting the CD31+ fraction against CD41 and CD71, we can gate four main populations: CD41– CD71– (1), CD41low CD71+ (2), CD41low CD71+++ (3) and CD41+++ CD71+ (4), in which other surface markers (KIT and CD49B) were expressed differentially, allowing the identification of the MK compartment as CD41 highly positive cells (Figure 7A). The purity of the sorted fractions is shown, as well as cytological stainings of cytospins of the sorted fractions.
In order to characterize the cell population spectrum in PBMC-MK cultures, viSNE analysis was employed (Figure 7B). The viSNE map separates cells into spatially distinct subsets based on the combination of markers that they express. Each point in the viSNE analysis represents an individual cell colored according to the expression levels of CD31, CD42A, CD71 and KIT.
Double negative cells (CD31– and CD71–) are mainly residual lymphocytes (population 5) that persist throughout the culture in these conditions. This population has been sorted in a second round of cell sorting using the remaining fraction of the sample.
Gates 6 and 7 are CD71mid and high expressing cells, which include erythroid progenitors and, potentially, other precursors.
We must take into account the technical difficulties due to the cell heterogeneous nature of this culture method and the sticky nature of mature MKs that results in the presence of mature MKs in subpopulations where they do not belong (see remarks section).
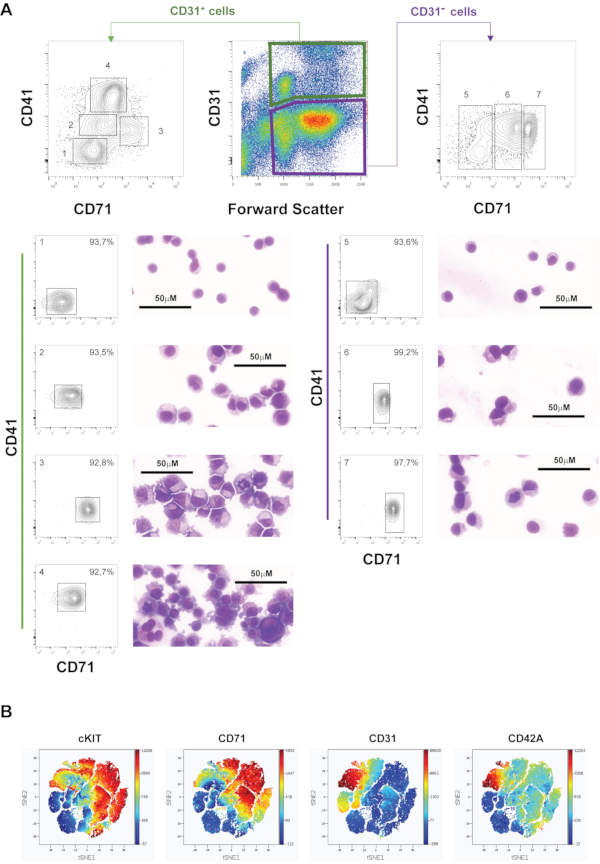
Figure 7: Pre-sort immunophenotypic analysis of 10-day in vitro culture MKs. A) Representative gating strategy using CD31, CD41 and CD71, with two sorting rounds, resulting in CD31+ populations 1-4 and CD31– populations 5-7. The purity of each sorted fraction was analysed after sorting, and is depicted together with a representative microphotograph of stained cytospins from each sorted fraction. B) viSNE map of day 10 PBMC-derived MK culture cells measured by flow cytometry. The map is built using the expression levels of CD31, CD42B, CD71 and KIT, as measured by flow cytometry. Please click here to view a larger version of this figure.
Post-sort processing
The sorted populations can be analyzed by different methods, including cytological and molecular analysis by immunofluorescence (see section 7) in order to evaluate the MK features in a specific physio-pathological context, or to better study the process of megakaryopoiesis. Some examples are presented in Figure 8.
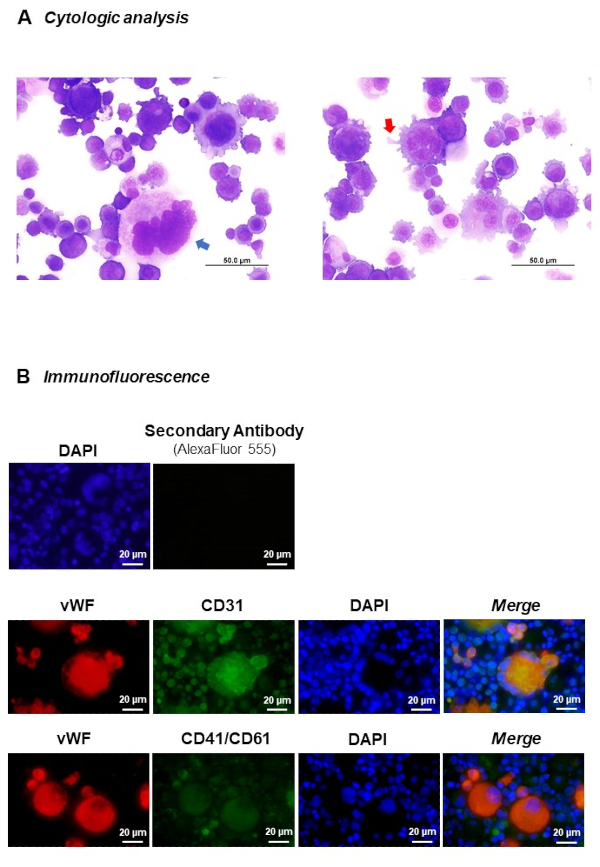
Figure 8. Post-sort MK analysis. A) Cytological analysis of sorted MK compartment from a 10-day in vitro culture. May-Grünwald Giemsa staining allows the observation of key features of mature MKs, i.e., pseudopod formation (red arrow), highly polyploid MK (blue arrow). B) Immunofluorescence analysis. Cells were stained with anti-human von Willebrand factor (shown in red, secondary antibody Alexa Fluor 555 Goat anti-mouse IgG), anti-human CD31 or tandem CD41/CD61, both conjugated with FITC (shown in green) and nuclear DNA was labeled with DAPI (shown in blue). Please click here to view a larger version of this figure.
Remarks:
MKs can be sorted from unexpected regions due to the capacity to attach cells to their membrane (Figure 9). This issue can be a problem to get high purity cell subpopulations. To minimize cell-cell aggregates, 1-5 mM EDTA can be added to the panel mix buffers.
Furthermore, when using WB as starting material, we proposed either obtaining PBMCs or lysing RBCs to use the cellular fraction directly. In Figure 10 we show flow cytometry analysis of the two methodologies. On one hand, when lysing RBCs and analyzing the whole cellular compartment, we still have a large amount of neutrophils. These can be filtered out with a specific marker (or using the Lin cocktail strategy). However, we may lose some MKs due to their promiscuous nature related to surface marker expression. On the other hand, PBMC isolation will allow us to get rid of neutrophils as well as RBCs, although we may lose the MKs with higher density (i.e., the ones with more complex cytoplasmic features or more immature). As shown in Figure 10, MKs from lysed WB show a higher expression of maturation markers, which appears lower when isolating PBMCs. The density gradient might result in the loss of the MKs that still contain a complex cytoplasm, while the ones contained in the PBMC fraction, might be already "exhausted" in the circulation after releasing platelets, and thus maintaining the polyploid nucleus within a less complex cytoplasm. They should not be confused with immature MKs. Each procedure has its advantages and its drawbacks.
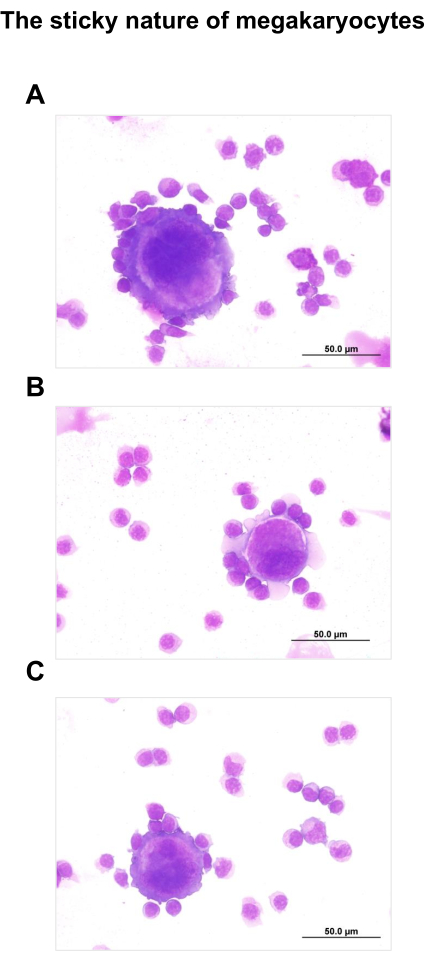
Figure 9. The sticky nature of MKs. MKs can be found in unexpected gates due to their capacity to attach cells to their membrane. A-C) MKs sorted in populations 1 (B) and 5 (A and C), according the gating strategy for MK sorting. This issue can be a problem to get high purity cell subpopulations. Please click here to view a larger version of this figure.
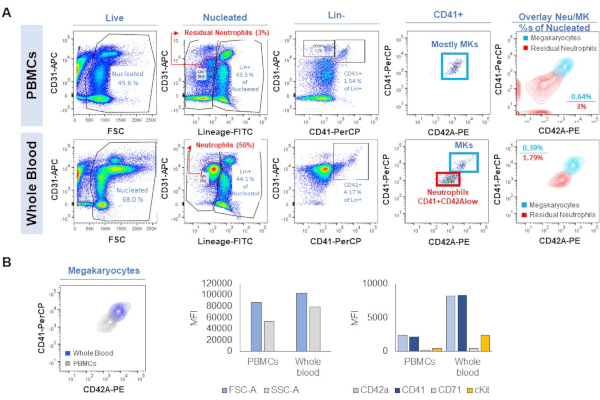
Figure 10. Flow cytometry immunophenotyping of MKs from PBMCs or WB after lysing the RBCs. A) Gating strategy. B) Size (FSC), cellular complexity (SSC) and expression of CD42A, CD41, CD71 and KIT in MKs as identified in PBMCs or WB. Please click here to view a larger version of this figure.