The smFRET had the ribosome labeled at the middle position of tRNA traffic, to distinguish the tRNA translocation from the A- to the P-site (Figure 1)15. The distance from the L27 labeling residue to the A- or P-site tRNA is 52 or 61 Å, respectively, corresponding to FRET efficiency of 0.47 and 0.65. After the image collection, fluorescence intensities from the donor and acceptor channels were retrieved and plotted as time lapses (Figure 1). FRET efficiency was calculated by the formula Iacceptor/(Iacceptor+Idonor). A homemade program detected the single-step bleaching of the donor/acceptor and fitted the data before the bleaching points to avoid calculation of FRET from noises. After donor bleaching, both traces approached the baseline because no excitation can occur directly on the acceptor (Figure 2A). After acceptor bleaching, the donor intensity increased because fewer reaction pathways dissipate the excitation energy (Figures 2B,C).
It was found that the individual ribosomes exhibit different fluctuation, such as in the examples shown in Figure 2. These fluctuations are due to the wobbling motion of the tRNAs, which causes distance fluctuations to the L2717,18. In Figure 2, the dotted lines are the original data, and solid lines are the fitted data from the program. The fitted traces do not change the raw data reading but truncate the time-lapse traces after bleaching. The blue traces are the calculated FRET efficiencies. By tracking the exact same ribosomes after 5 min incubation at RT, it was found that one type of dynamics can switch to another23. Because these signals report on tRNA motions dictated by the surrounding ribosome, similar FRET efficiencies were grouped into various ribosome subpopulations.
Figure 3 shows very diverse subpopulations in the PRE complex. There are approximately 70% (640/951) of fluctuating species and 30% (311/951) of non-fluctuating species. These two categories can be further grouped into finer subpopulations. On the other hand, Figure 4 shows the opposite dynamics distribution. In POST, 65% of subpopulations are non-fluctuating, and the majority of them exhibited high FRET efficiency. These results indicate that the ribosome is more flexible in the PRE state than the POST state, which corroborates a cryo-EM study that concluded that the peptidyl chain at the P-site locks the ribosome dynamics in the POST state. However, in the PRE state, the peptidyl chain is transferred to the A-site, unlocking the ribosome and promoting5. The results supported the structure study conclusion under more physiological conditions. The unlocked state is correlated with the ratcheting motion between the 30S and 50S, and the locked state is correlated with the un-ratcheted conformation.
The subpopulation sorting method reveals the ribosome conformation upon inhibition by the antibiotic viomycin, as shown in Figure 514. The overall FRET efficiency histogram shows a major peak at 0.47, the classic state, without sorting. In this state, the ribosome is locked and un-ratcheted. However, sorting the subpopulations has revealed that 60% of the population is fluctuating as the unlocked PRE complex. Therefore, viomycin has trapped the ribosome at the ratcheted state. The results of this study contradicted an x-ray structure result at the time of publishing (2010) but were supported recently by another structure study (2020).
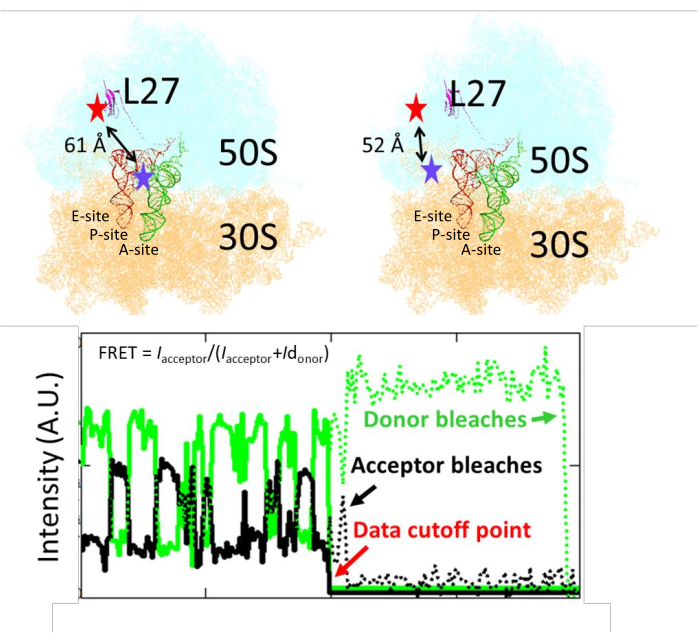
Figure 1: The labeling position of the Cy3/Cy5 on the ribosome and the tRNA. The distances between the labeling residue of L27 to the A- and P-site tRNA are shown (the red and blue stars show the approximate labeling locations of the Cy5 and Cy3, respectively). One representative time-lapse trace of fluorescence intensities from the CY3/Cy5 FRET pair is shown. A program detects bleaching points on donor/acceptor traces and truncates the trace before that point. This figure has been modified from Altuntop, M. E. et al.15. Please click here to view a larger version of this figure.
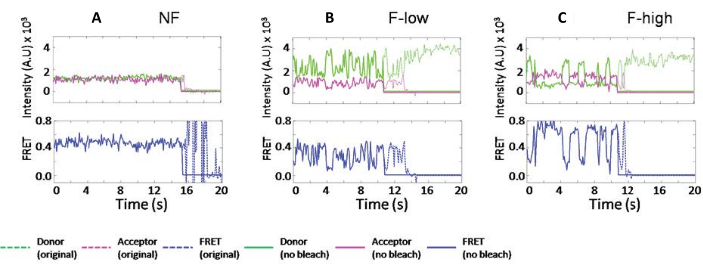
Figure 2: The typical ribosome traces were classified by their different dynamics. (A) A non-fluctuating ribosome trace. (B) A fluctuating ribosome trace that only samples FRET values lower than 0.6. (C) A fluctuating ribosome trace that samples FRET value higher than 0.6. The legends are shown in the plot. The fluorescence intensities of donor and acceptor are green and magenta, respectively. FRET values are calculated as Iacceptor/(Iacceptor+Idonor) and plotted separately in blue. The original data are displayed in dotted lines, and data truncated before the bleaching points are displayed in solid lines. This figure has been modified from Altuntop, M. E. et al.15. Please click here to view a larger version of this figure.
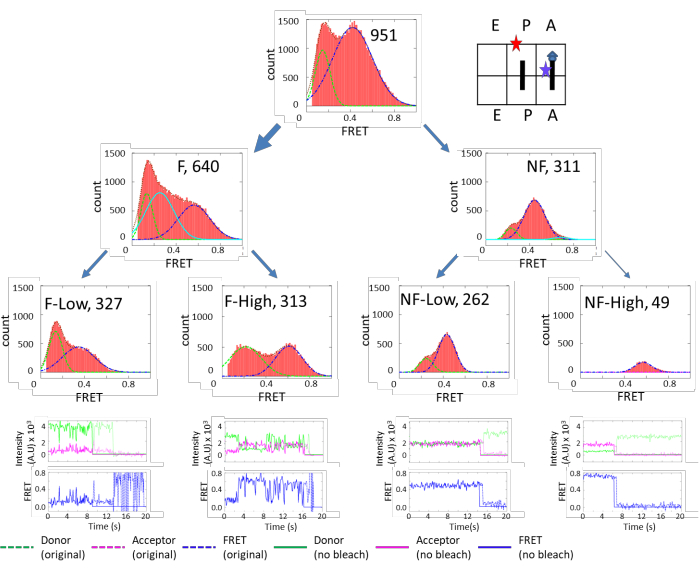
Figure 3: FRET efficiency histograms of the Pre-complex. The top-tier plots show the FRET histogram of the total ribosomes. The second-tier plots show the FRET histograms of the ribosomes separated into fluctuating (F) and non-fluctuating (NF) groups. The third-tier plots show the FRET histograms of the ribosomes further separated into groups of fluctuations that were above or below a FRET value of 0.6. Similar criteria were applied to the NF ribosomes to separate them into stable FRET states below or above 0.6 (NF-low, NF-high). The fourth-tier plots display the representative traces for each subpopulation. This figure has been modified from Altuntop, M. E. et al.15. Please click here to view a larger version of this figure.
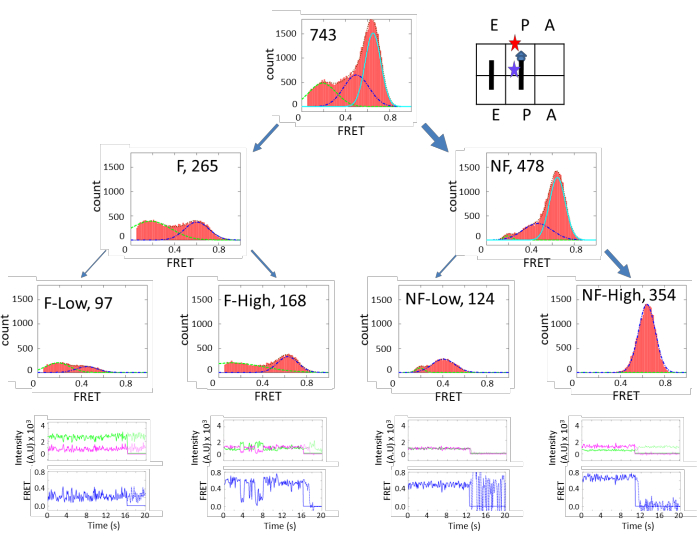
Figure 4: FRET efficiency histograms of POST-Complex. The arrangement and grouping are similar to Figure 3. Contrary to Figure 3, the NF-High population is the majority. This figure has been modified from Altuntop, M. E. et al.15. Please click here to view a larger version of this figure.
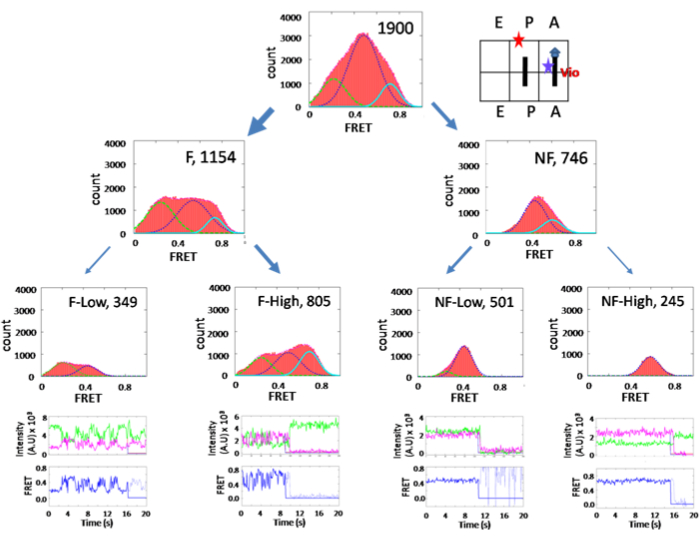
Figure 5: Histograms of the PRE complex in the presence of 100 µM viomycin. The arrangement and grouping are similar to Figure 3. This figure has been modified from Ly, C. T. et al.14. Please click here to view a larger version of this figure.