Science Education
>

An Optimized O9-1/Hydrogel System for Studying Mechanical Signals in Neural Crest Cells

Instructor Prep
concepts
Student Protocol
JoVE Journal
Developmental Biology
A subscription to JoVE is required to view this content.  Sign in or start your free trial.
JoVE Journal Developmental Biology
An Optimized O9-1/Hydrogel System for Studying Mechanical Signals in Neural Crest Cells

1. Hydrogel preparation

NOTE: All steps must be performed in a cell culture hood that has been disinfected with ethanol and ultraviolet (UV)-sterilized before use to maintain sterility. Tools, such as tweezers and pipettes, must be sprayed with ethanol. Buffer solutions must also be sterile-filtered.

  1. Preparation of aminosilane-coated glass coverslips
    1. Place the desired number of glass coverslips onto a piece of laboratory wipe.
      NOTE: Prepare an additional 3-4 coverslips to ensure sufficient backup supplies as they break easily. Different materials of glass coverslips will yield different compatibility of cell seeding and attachment. It is better to determine which type suits the experiment best before starting the experiments (see the Table of Materials).
    2. Use an alcohol burner or Bunsen burner to sterilize each coverslip by passing it back and forth through the flame (30 s for protein assay experiments). Place each glass coverslip on a laboratory wipe to cool down.
    3. Once the glass coverslips are cooled down, transfer them onto a Petri dish lined with parafilm to prevent slippage.
      NOTE: If the coverslips are not cool enough, the residual heat will melt the parafilm onto the slips, rendering them unusable.
    4. Cover the coverslips with approximately 200 μL and 800 μL of 0.1 M NaOH for a 12 mm and a 25 mm coverslip, respectively, and let them sit for 5 min. Then, aspirate the 0.1 M NaOH and allow the coverslips to air-dry for another 5 min to form an even film.
    5. Once the coverslips are dried, pipette approximately 80 μL and 150 μL of 3-aminopropyl triethoxysilane (APTS) for 12 mm and 25 mm coverslips, respectively. Be careful to avoid spilling the solution onto the parafilm. Allow the solution to sit for 5 min.
    6. Aspirate as much excess APTS as possible and allow the residual APTS to dry for 5 min. Rinse the coverslips well by submerging them in sterile, deionized (DI) H2O three times for 5 min each time.
      NOTE: If the glass coverslips are not rinsed well, the residual APTS causes unwanted reactions with glutaraldehyde, causing a white precipitate to form and resulting in unusable coverslips.
    7. Move the coverslips to a new Petri dish with the reactive side facing up. Add enough 0.5% glutaraldehyde to the Petri dish to cover the coverslips entirely and allow the coverslips to sit for 30 min.
    8. Aspirate the 0.5% glutaraldehyde and rinse the coverslips again in DI H2O one time for 3 min. Set the coverslips reactive side up on a laboratory wipe or a clean Petri dish to air-dry completely before using.
      NOTE: The protocol can be paused here; coverslips must be placed in sterile DI H2O until use.
  2. Preparation of siliconized coverslips
    1. Place the same number of coverslips as the aminosilane-coated coverslips (step 1.1.1) in a Petri dish lined with parafilm.
    2. Pipette 40 μL or 150 μL for 12 mm and 25 mm coverslips, respectively, of dichloromethylsilane (DCMS) to one side of the coverslip and allow the solution to sit for 5 min.
    3. Aspirate any remaining solution from the coverslip, wash in sterile DI H2O once for 1 min, and place the reactive coverslips face up on a laboratory wipe to air-dry completely before moving onto the next step.
  3. Preparing hydrogels
    1. Mix acrylamide, bis-acrylamide, and DI H2O in a 1.5 mL centrifuge tube to prepare 500 μL of solutions with varying stiffnesses (see Table 1). Vortex the solution for 30 s to mix it thoroughly.
    2. Working swiftly, add the 10% ammonium persulfate solution (APS) and tetramethylethylenediamine (TEMED) to the tube and vortex the solutions again to mix the solutions.
      NOTE: Prepare fresh 10% APS and leave it on ice or freeze into single-use aliquots due to its sensitive freeze/thaw cycle.
    3. Pipette approximately 33 μL or 100 μL of the solution onto the dried 12 mm or 25 mm aminosilane-coated coverslips (section 1.1), respectively.
    4. Using curved tweezers, immediately place the DCMS-treated coverslip on top of the gel solution with the treated side touching the gel solution, thus sandwiching the gel solution between the DCMS-treated coverslip and aminosilane-coated coverslip.
    5. Allow the gel solution to polymerize for 5-15 min, while actively monitoring for gel polymerization of the leftover solution in the tube.
    6. Once the gel is polymerized, separate the DCMS-treated coverslip with curved tweezers or a razor blade, leaving the gel attached to the original aminosilane-coated coverslip.
    7. Immediately place the coverslip with the attached hydrogel in a predetermined 4-well/24-well and 6-well plate covered with 500 µL and 2 mL of sterile PBS or DI H2O for 12 mm and 25 mm coverslips, respectively, to prevent the gel from drying out.
    8. Repeat steps 1.3.4-1.3.7 for all coverslips.
    9. Submerge the hydrogels in sterile PBS or DI H2O for 30 min to remove excess acrylamide solution. Store the hydrogels in sterile PBS or DI H2O at 4 °C for a procedural stop here.
    10. In a dark room, prepare the sulfosuccinimidyl 6-(4'-azido-2'-nitrophenylamino) hexanoate (sulfo-SANPAH) mixture by mixing 2.5 mL of 50 mM 2-[4-(2-hydroxyethyl) piperazin-1-yl] ethanesulfonic acid(HEPES) (pH=8.5) with 25 μL of the 50 μg/mL sulfo-SANPAH in a conical tube, wrapped in aluminum foil to protect from light. Use a pipette to mix the solution well before using.
      NOTE: A volume of 2.5 mL of sulfo-SANPAH solution is enough for approximately twenty-five 12 mm hydrogels or five 25 mm hydrogels.
    11. Aspirate PBS or DI H2O from the well plate. Add approximately 100 μL or 500 μL for 12 mm and 25 mm coverslips, respectively, of sulfo-SANPAH solution (step 1.3.10) to cover the gel. Ensure the solution covers the gel entirely.
      NOTE: Adjust the vacuum suction strength to prevent the strong force from ripping or disturbing the hydrogels.
    12. Place the gels with the solution under a 15 W, 365 nm UV light for 10 min, uncovered to minimize any interference of the UV light reacting with the sulfo-SANPAH.
    13. Aspirate the excess sulfo-SANPAH by tilting the plate to collect as much of the solution as possible. Wash the gel with 50 mM HEPES two to three times.
    14. Add 500 μL and 2 mL for 12 mm and 25 mm gels, respectively, of 50 mg/mL collagen I diluted in 0.2% acetic acid to each well containing the hydrogel. Allow the gels to incubate overnight in a 37 °C, 5% CO2 incubator.
      NOTE: Dilute collagen I in 0.2% acetic acid instead of 50 mM HEPES to promote homogenous distribution and attachment of collagen I.
    15. Aspirate the collagen I and wash the gels with sterile PBS three times to remove excess collagen I for 5 min each wash. Incubate the hydrogels in PBS with 10% horse serum, 5% FBS for 2 h in the 37 °C, 5% CO2 incubator.
      NOTE: The addition of 10% horse serum promotes higher proliferation compared to only using FBS as done in the previous publication.
    16. Aspirate the medium. Add 500 mL of sterile-filtered Dulbecco's Modified Eagle Medium (DMEM) with 10% FBS and 1% penicillin-streptomycin (P/S) to each well. Store the gels in the 37 °C, 5% CO2 incubator until ready for cell culture.
    17. Once ready, plate approximately 1.5 × 10⁴ O9-1 cells/cm2 in basal medium in the culture dishes. Incubate the cells for 2 days in an incubator at 37 °C, 5% CO2. Check the cells for confluency to ensure that the cells are sufficiently attached to gels, and that the number of cells is enough before collecting for analysis.
      NOTE: See the previously published protocol for the steps of recovery, passage, and collection of O9-1 cells20.
    18. Proceed to sections 2, 3, or 4 for further analysis of the hydrogels.

2. Quantitative analysis of stiffness via AFM

  1. Start the AFM system computer, followed by the AFM controller (see the Table of Materials).
  2. Mount the AFM cantilever on the AFM probe holder. Use a spherical cantilever with a 0.5 μm silica bead mounted at the end of the cantilever (cantilever with spherical bead).
    NOTE: For stiffer hydrogels, such as 10 kPa, 20 kPa, and 40 kPa, a stiffer probe was used with the spring constant of 0.24 N/m. A softer probe was used for softer hydrogels, such as 0.5 kPa and 1 kPa, with a spring constant of 0.059 N/m.
  3. Set the AFM software under contact mode.
  4. Mount the silicon wafer onto the AFM sample stage to collect force curves by clicking on Engage for the cantilever to touch the silicon substrate, thus generating the force curves.
  5. Use the force curves above (2.4) for calibration, click on Calibrate in the controlling software to obtain an average spring constant of the cantilever under thermal tune condition, and save the calibrated values in the controlling software.
  6. Mount the samples by placing the coverslip with the attached hydrogel in a 60 mm Petri dish onto the AFM scanning stage. Add 3 mL of PBS into the dish before conducting measurements to prevent the gel from drying out.
  7. Set the AFM to work in contact mode (fluid) to start measurement. Engage the spherical bead to continuously touch and lift from the gel sample.
  8. Set the cantilever so that its deflection threshold remains at 10 nm. Keep the ramping size of the probe at 10 μm. Then, record the force curves as in step 2.4.
  9. Acquire at least 20 force curves from at least 3 to 10 different spots across the surface of the hydrogel.
  10. Calculate the average Young's modulus of ~20 force curves for each spot with AFM imaging and analysis software. Use extend ramp force curves and a linearized model (spherical). Calculate the average of all spots for each sample to yield the final stiffness.
    NOTE: Young's modulus and related data (i.e., standard deviations) are automatically saved as a spreadsheet.
  11. Repeat steps 2.6-2.10 for all samples.

3. Molecular analysis of stiffness via immunofluorescence staining

  1. Use tweezers to transport the coverslip to a new plate to minimize false signals from cells grown directly onto the plate. Wash the cells with 500 µL of sterile PBS three times to remove dead cells and any remaining culture medium.
  2. Fix the cells using 500 µL of 4% paraformaldehyde (PFA) for 10 min at room temperature, undisturbed. Then, rewash the cells three times using 500 µL of PBS/well for 2 min each.
    NOTE: Store at 4 °C for a procedural stop.
  3. Treat the cells with 500 µL of 0.1% Triton X-100 for 15 min at room temperature. Then, wash the cells three times with 500 µL of PBS/well.
  4. Block the cells with 250 µL of 10% donkey serum (diluted in PBS and 0.1% Tween 20) per well for 30 min at room temperature.
  5. Incubate the cells with 250 µL of primary antibodies for 2 h at room temperature or overnight at 4 °C. Then, wash the cells three times with 500 µL of PBS/well for 5 min each.
    NOTE: Anti-Vinculin (Vcl) (1:250) and anti-AP2 alpha (1:250) were used in this experiment and were diluted in 10% donkey serum.
  6. Incubate the cells with corresponding secondary antibodies and/or phalloidin used for F-actin staining at a dilution of 1:400 in 250 µL of 10% donkey serum for 30 min at room temperature. Then, wash the cells three times with PBS for 5 min each.
    NOTE: 568 nm Phalloidin can be co-incubated with 488 nm or 647 nm secondary antibodies or on its own.
  7. Incubate the cells with 4′,6-diamidino-2-phenylindole (DAPI, 1:1000 dilution) in 250 µL of PBS for 10 min followed by one last wash of PBS for 2 min.
  8. Add 3-4 drops of mounting medium to each well. Store the samples at 4 °C to set for at least 2 h before imaging to ensure the mounting medium has set properly.
  9. Capture images of at least 3 random frames per hydrogel sample with a fluorescence microscope, producing individual and merged channels.

4. Quantitative real-time PCR (RT-qPCR)

  1. Transfer the hydrogels with the adherent cells for RNA collection to a new plate to minimize unwanted RNA from cells attached to the cell plate. Wash the cells with PBS three times to remove dead cells and culture medium.
  2. Extract the total mRNA using an RNA extraction kit. Perform reverse-transcription of RNA to cDNA using a reverse transcription supermix following the manufacturer's instructions.
  3. Perform RT-qPCR with primers for Vcl as the stiffness marker of choice and analyze using the 2-ΔΔCT method.
    NOTE: Primer sequence of Vcl: Forward 5' GCTTCAGTCAGACCCATACTCG 3'; reverse 5' AGGTAAGCAGTAGGTCAGATGT 3'.

An Optimized O9-1/Hydrogel System for Studying Mechanical Signals in Neural Crest Cells

Learning Objectives

Hydrogel preparation and stiffness assessment through AFM and the Hertz model
Here, a detailed protocol is provided to generate polyacrylamide hydrogels of varying stiffness by regulating the ratio of acrylamide and bis-acrylamide. However, the polyacrylamide hydrogels are not ready for the adhesion of cells due to the lack of ECM proteins. Thus, sulfo-SANPAH, acting as a linker, covalently binds to the hydrogels and reacts with the primary amines of ECM proteins to allow the adhesion of ECM proteins to the surfaces of the hydrogels via the N-hydroxysuccinimide ester in sulfo-SANPAH after UV activation. Collagen type I was used as the ECM protein of choice to effectively promote O9-1 cell attachment. To ensure accurate stiffness values of different hydrogels, a stiffness assessment was performed using AFM, a well-known technique to depict the elastic modulus.

Upon successful formation and attachment of the polyacrylamide hydrogel to the glass coverslip, the gel remained adherent to the coverslip with an even surface and minimal tearing. The stiffness was measured by AFM based on the principle of indention technique, wherein a stiff indenter was applied to the sample with the required force to reach an indentation depth26. With this measurement, the Young's elastic modulus was calculated based upon the indentation of depth and force in Hertz's model, an elastic theory26. However, due to the large variation in results by AFM, an additional statistical method was applied to obtain a quantitative result with minimal impact of uneven surfaces and imperfect homogeneity of the gel solutions26. To produce a quantitative measurement using AFM, a compilation of at least 50 force and distance curves from each location on the gel sample was taken for an average sample stiffness. The force applied to the high-stiffness gel was higher than that applied to the softer gel, indicating that a stiffer substrate yielded a steeper slope in the Force vs. Z graph, in which force is measured in nN, and Z indicates the indentation depth between the indenter and sample.

On soft hydrogels, the slope of the generated force curve was gentle as the required force from the AFM probe was less (Figure 1A). However, on stiff hydrogels, such as those with the modulus of 40 kPa, the generated slope was much steeper as the applied force was higher than for softer gels (Figure 1B). As the separation between the probe and the hydrogel sample decreases, the curve increases significantly as the tip of the probe touches the glass coverslip. However, as the separation distance increases, the curve merely approaches 0 as there is no applied force present.

As shown in Figure 1A, the cantilever on the AFM probe approached the gel, indicated by the blue line, and the probe measured the applied force required to penetrate the gel sample and eventually reach the glass coverslip, causing a sudden increase in force. Due to possible procedural and instrumental errors, such as the quality of the required solutions, the true stiffness of hydrogel samples varies largely and far from the desired stiffness. Thus, AFM is a useful tool to validate and confirm the methodology while preventing false data presentation in further experiments.

In this AFM assessment, the five prepared hydrogel samples were measured through the quantitative approach. The protocol focused on hydrogel stiffness levels of 0.5 kPa, 1 kPa, 10 kPa, 20 kPa, and 40 kPa, which mimic the breadth of biological substrate stiffness levels reported for differentiation of various cell types. The force curves obtained from AFM measurements were utilized to generate the Young's elastic modulus in kilopascals using an AFM analysis algorithm software (Figure 2).

Comparison of polyacrylamide hydrogel systems and cell types
This adaptation of the original protocol by Tse and colleagues provides an efficient and effective approach to study the mechanosensitive aspects of NCC using O9-1 cells20. Modifications to the previous protocol include modifying ECM protein incubation: replacing 50 mM HEPES with 0.2% acetic acid and the addition of 10% horse serum and FBS for cell culture (step 1.3.14-1.3.15). These modifications were validated by comparing the growth and maintenance of O9-1 NCCs on this modified gel system with that in the original (control) protocol. Here, we cultured wild-type O9-1 cells on both hydrogel systems with the elastic modulus of 1 kPa and 40 kPa for each system in basal medium. The overall cell growth status and development were visualized using a brightfield light microscope for apoptotic characteristics, stressed morphology, and cell attachment to the hydrogels. O9-1 cells grown on the original gel system resulted in a higher number of dead cells indicated by an excess of round cells (Figure 3E,F) for both 1 kPa and 40 kPa hydrogels.

In contrast, the O9-1 cells grown on the modified gel system exhibited healthy cell growth and sufficient attachment to the hydrogel substrate (Figure 3G,H). In addition, the compatibility of NCCs with the modified hydrogel system was assessed by performing IF staining of the NCC marker, Tcfap2α (AP-2). AP-2 is a transcription factor expressed in the NC lineages to regulate development in mouse embryos, thus making it suitable to assess compatibility27. Although O9-1 cells grown on control and modified hydrogel systems both expressed AP-2, there was a significant increase in AP-2 expression in O9-1 cells plated on the modified hydrogel system, as indicated by the stronger fluorescence signal and the corresponding quantification (Figure 4A,B).

In addition, P19 cells were used to further validate the benefits of the modified hydrogel system for the growth of cells. P19 is an embryonic carcinoma cell line that was derived from embryo-derived teratocarcinoma in mouse28. Using the corresponding culture protocol, P19 cells were grown on both control and modified hydrogel systems to monitor survival and growth characteristics. Brightfield imaging revealed that P19 cells plated on both hydrogel systems displayed an excess of round floating cells and a lack of cell-substrate attachments (Figure 3AD). This observation suggested that the modified protocol was more suitable for O9-1 NCCs to study mechanical signaling in NCCs.

Visualization of high-stress fiber expression on stiff substrates
The modified hydrogel allowed for quantitative and qualitative analysis of the differences in the morphology of cells cultured on gels of different stiffness levels and other effectors. Once the hydrogels were ready for cell seeding, wild-type O9-1 cells were passaged onto hydrogels of different stiffness levels. Cells were monitored for their health and growth by observing their shape, spatial spread, and even attachment on the hydrogel with minimal dead cells. Some studies have shown an increase in stress fibers and cell adhesion for MSCs on high-stiffness substrates, suggesting that NCCs grown on a stiffer substrate would also exhibit similar findings compared to NCCs grown on softer substrates29,30.

F-actin along with myosin II, α-actinin, and other cytoskeletal proteins are known collectively as stress fibers31. Previous studies observed an increase in stress fiber assembly in response to increased mechanical force31. At one or both ends of the stress fibers, attachments to the focal adhesion complex enable cells to migrate and adhere to the ECM31. Phalloidin staining to visualize F-actin expression and organization in the NCCs demonstrated healthy cell growth in response to mechanical signaling (Figure 5). Additionally, the O9-1 cells grown on low- or high-stiffness hydrogels exhibited different morphologies through varying amounts of stress fibers (Figure 5). Similar to observations from reported studies performed using MSCs, it was observed that O9-1 cells grown on a stiffer substrate, 40 kPa, exhibited more stress fibers and were well-spread compared to cells grown on a softer hydrogel, indicated by 1 kPa stiffness29,30.

Assessment of cell adhesions
To further confirm the hypothesis that the change in substrate stiffness impacts NCC adhesion, changes in Vcl expression were quantitatively measured via RT-qPCR in NCCs responding to different hydrogel stiffness levels. Vcl is one of the numerous cytoskeletal proteins present in the focal adhesion complex during the process of the cell establishing contacts with the substrate and sensing the ECM properties32. Focal adhesions are the contact points of the cells to the ECM via integrin receptors, which anchor to the cytoplasmic actin cytoskeleton, F-actin33 The Vcl gene expression level suggests the changes in focal adhesions and cell adhesions of the O9-1 cells in response to the substrate stiffness.

Previous studies showed the effect of Vcl on cell adhesion in embryonic stem and fibroblast cells by differences in its expression. In response to the high expression of Vcl, the number and sizes of focal adhesions also increased but decreased when Vcl was knocked down34. Consistently, Vcl-deficient cells also showed a significant decrease in cell adhesion and spreading35. In addition, Vcl plays a role in regulating cell adhesion by stabilizing focal adhesions36. The size of focal adhesions, maturation level, and compositions vary according to the substrate stiffness, thus allowing signals to be transduced intracellularly and the cells to respond to their environmental cues37. Thus, Vcl is highly recruited to the focal adhesion complexes in cells grown on stiff substrates, as reflected by higher mRNA levels detected by RT-qPCR (Figure 6C).

Cells grown on softer substrates form minimal focal adhesion complexes, as reflected by lower mRNA levels of Vcl in the cells15. In Figure 6C, O9-1 cells exhibited a higher expression of Vcl on the stiff substrate than on the soft substrate. These results suggest a higher level of cell-substrate adhesions of O9-1 cells on stiff substrates than O9-1 cells on softer substrates. In addition, Vcl expression was qualitatively visualized through IF staining with an anti-Vcl antibody to further complement and support the RT-qPCR finding. Consistently, the Vcl expression in O9-1 cells grown on the stiffer substrate was higher than those grown on the softer substrate (Figure 6A,B), which further supported the initial finding of high cell adhesion and spreading on the 40 kPa hydrogel in comparison to the 1 kPa hydrogel observed with F-actin phalloidin staining and Vcl expression levels via RT-qPCR.

Figure 1
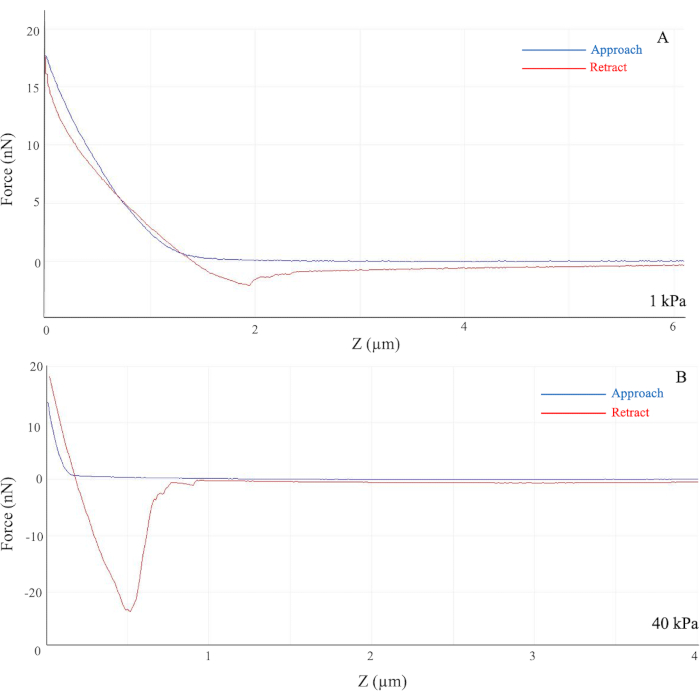
Figure 1: Force curves generated from the indentation of the AFM probe. Force (y-axis) indicates the required force applied in nN, and Z (x-axis) indicates the Bruker AFM probe distance from the sample in µm. For the 1 kPa hydrogel (A), the generated slope is gentle vs. the steeper slope observed for the 40 kPa hydrogel (B). The colored curves represent the movement of the cantilever on the AFM probe as it approaches (blue) and retracts (red) from the hydrogel sample. The highest starting point of the curve indicates the rigid contact of the glass coverslip. (B) The large dip in the retracted curve in the 40 kPa hydrogel indicates adhesion between the bead and the sample. Abbreviation: AFM = atomic force microscopy. Please click here to view a larger version of this figure.

Figure 2
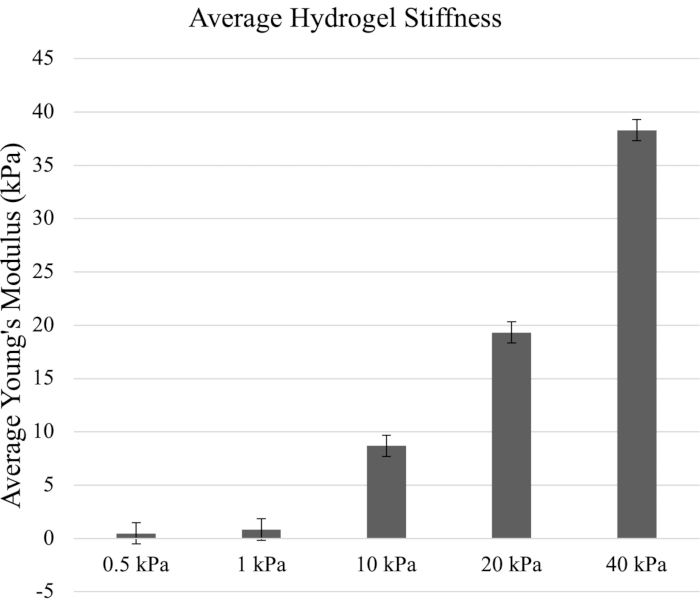
Figure 2: The average stiffness of hydrogels (in kPa) calculated from the Young's elastic modulus. The Young's modulus was generated from the force curves from Figure 1. The referenced elastic moduli of the hydrogels were 0.5 kPa, 1 kPa, 10 kPa, 20 kPa, and 40 kPa. Error bars indicate standard deviation. Please click here to view a larger version of this figure.

Figure 3
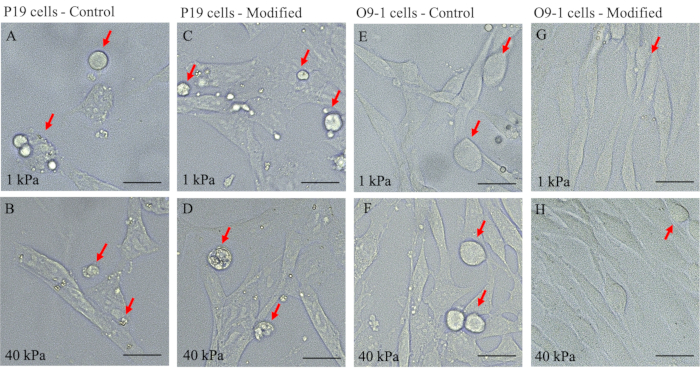
Figure 3: Bright-field images of P19 and O9-1 cells plated on 1 kPa and 40 kPa hydrogels of control and modified gel systems to detect cell growth characteristics. (AD) P19 and (EH) O9-1 cells; dead cells are indicated by red arrows. Scale bars = 25 µm. Please click here to view a larger version of this figure.

Figure 4
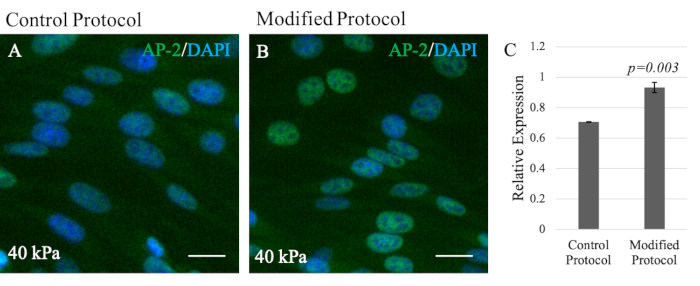
Figure 4: Immunofluorescence staining of NCC marker AP-2 in O9-1 NCCs to visualize NCC compatibility. (A) A 40 kPa modified hydrogel system compared to (B) a 40 kPa control. AP-2 (green); nuclei were stained with DAPI (blue). Scale bars = 25 µm. (C) Bar graph provides quantification of the AP-2 expression level showing significance (p-value = 0.003) (n = 3). Data show the relative expression with provided standard deviation error bars. Abbreviations: NCC = neural crest cell; DAPI = 4′,6-diamidino-2-phenylindole. Please click here to view a larger version of this figure.

Figure 5
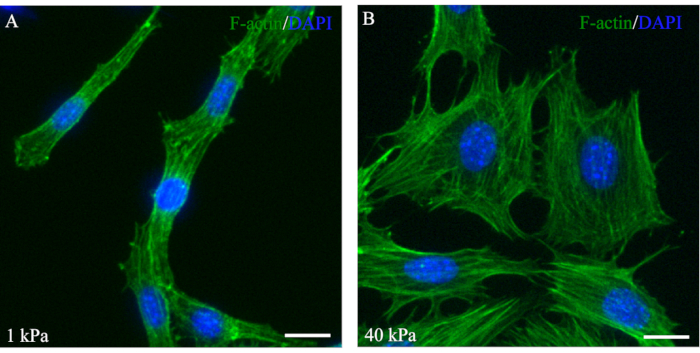
Figure 5: Fluorescent phalloidin staining of F-actin showing stress fibers that are well-spread out in O9-1 cells on the 40 kPa hydrogel. O9-1 cells were cultured on 1 kPa (A) and 40 kPa hydrogels (B). O9-1 cells were stained using Alexa Fluor 488 Phalloidin (green), and the nuclei were stained with DAPI (blue). Scale bars = 25 µm. Abbreviation: DAPI = 4′,6-diamidino-2-phenylindole. Please click here to view a larger version of this figure.

Figure 6
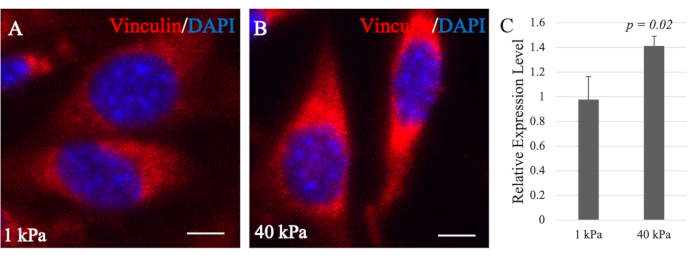
Figure 6: Immunofluorescence images of vinculin in O9-1 cells. O9-1 cells were plated on 1 kPa (A) and 40 kPa (B) hydrogels. Nuclei were stained with DAPI (blue). Scale bars = 25 µm. (C) Real-time quantitative PCR analysis of the total mRNA level of Vcl in O9-1 cells cultured on 1 kPa and 40 kPa hydrogels. Vcl expression level on the 1 kPa hydrogel is significantly lower than that on the 40 kPa hydrogel (p-value = 0.02). Data shows the average with provided standard deviation error bars. Abbreviation: DAPI = 4′,6-diamidino-2-phenylindole. Please click here to view a larger version of this figure.

500 μL total volume 0.5 kPa 1 kPa 10 kPa 20 kPa 40 kPa
40% Acrylamide (μL) 37.5 62.5 125 100 100
20% Bis-acrylamide (μL) 15 7.5 25 66 120
H2O (μL) 447.5 430 350 334 280
10% APS (μL) 5 5 5 5 5
TEMED (μL) 0.5 0.5 0.5 0.5 0.5

Table 1: Corresponding volumes of solutions to obtain the desired stiffness levels.

List of Materials

12 mm #1 Corning 0211 Glass Coverslip Chemglass Life Sciences CLS-1763-012
2% Bis-Acrylamide Sigma Aldrich M1533
24-well plate Greiner Bio-one 662165
25 mm #1 Corning 0211 Glass Coverslip Chemglass Life Sciences CLS-1763-025
3-aminopropyl triethoxysilane (APTS) Sigma Aldrich A3648
4-well cell culture plate Thermo Scientific 179830
4% Paraformaldehyde Sigma Aldrich J61899-AP
40% Acrylamide Sigma Aldrich A4058
50% glutaraldehyde Sigma Aldrich G7651
6-well cell culture plate Greiner Bio-one 657160
AFM cantilever (spherical bead) Novascan
AFM software Catalyst NanoScope Model: 8.15 SR3R1
Alexa Fluor 488 Phalloidin Thermo Fisher A12379
Ammonium Persulfate (APS) Sigma Aldrich 248614 Powder
anti-AP-2α Antibody Santa Cruz sc-12726
anti-Vinculin antibody Abcam ab129002
Atomic Force Microscopy (AFM) Bioscope Catalyst Bruker Corporation
Collagen type I (100mg) Corning 354236
DAPI (4',6-Diamidino-2-Phenylindole, Dihydrochloride) Thermo Fisher D1306
Dichloromethylsilane (DCMS) Sigma Aldrich 440272
Donkey serum Sigma Aldrich D9663
Dulbecco's Modified Eagle Medium (DMEM) Corning 10-017-CV
Fetal bovine serum (FBS) Corning 35-010-CV
Fluorescence microscope Leica Model DMi8
Fluoromount-G mounting medium SouthernBiotech 0100-35
HEPES Sigma Aldrich H3375 Powder
Horse serum Corning 35-030-CI
iScript Reverse Transcription Supermix Bio-Rad 1708841
Penicillin-Streptomycin antibiotic Thermo Fisher 15140148
RNeasy micro kit Qiagen 74004
Sterile 1x PBS Hyclone SH30256.02
Sterile deionized water Hardy Diagnostics U284
sulfo-SANPAH Thermo Fisher 22589
SYBR green Applied Biosystems 4472908
TEMED Sigma Aldrich T9281
Triton X-100 Sigma Aldrich X100
Tween 20 Sigma Aldrich P9416

Lab Prep

Neural crest cells (NCCs) are vertebrate embryonic multipotent cells that can migrate and differentiate into a wide array of cell types that give rise to various organs and tissues. Tissue stiffness produces mechanical force, a physical cue that plays a critical role in NCC differentiation; however, the mechanism remains unclear. The method described here provides detailed information for the optimized generation of polyacrylamide hydrogels of varying stiffness, the accurate measurement of such stiffness, and the evaluation of the impact of mechanical signals in O9-1 cells, a NCC line that mimics in vivo NCCs.

Hydrogel stiffness was measured using atomic force microscopy (AFM) and indicated different stiffness levels accordingly. O9-1 NCCs cultured on hydrogels of varying stiffness showed different cell morphology and gene expression of stress fibers, which indicated varying biological effects caused by mechanical signal changes. Moreover, this established that varying the hydrogel stiffness resulted in an efficient in vitro system to manipulate mechanical signaling by altering gel stiffness and analyzing the molecular and genetic regulation in NCCs. O9-1 NCCs can differentiate into a wide range of cell types under the influence of the corresponding differentiation media, and it is convenient to manipulate chemical signals in vitro. Therefore, this in vitro system is a powerful tool to study the role of mechanical signaling in NCCs and its interaction with chemical signals, which will help researchers better understand the molecular and genetic mechanisms of neural crest development and diseases.

Procedure

Neural crest cells (NCCs) are vertebrate embryonic multipotent cells that can migrate and differentiate into a wide array of cell types that give rise to various organs and tissues. Tissue stiffness produces mechanical force, a physical cue that plays a critical role in NCC differentiation; however, the mechanism remains unclear. The method described here provides detailed information for the optimized generation of polyacrylamide hydrogels of varying stiffness, the accurate measurement of such stiffness, and the evaluation of the impact of mechanical signals in O9-1 cells, a NCC line that mimics in vivo NCCs.

Hydrogel stiffness was measured using atomic force microscopy (AFM) and indicated different stiffness levels accordingly. O9-1 NCCs cultured on hydrogels of varying stiffness showed different cell morphology and gene expression of stress fibers, which indicated varying biological effects caused by mechanical signal changes. Moreover, this established that varying the hydrogel stiffness resulted in an efficient in vitro system to manipulate mechanical signaling by altering gel stiffness and analyzing the molecular and genetic regulation in NCCs. O9-1 NCCs can differentiate into a wide range of cell types under the influence of the corresponding differentiation media, and it is convenient to manipulate chemical signals in vitro. Therefore, this in vitro system is a powerful tool to study the role of mechanical signaling in NCCs and its interaction with chemical signals, which will help researchers better understand the molecular and genetic mechanisms of neural crest development and diseases.

Tags