NOTE: All medium preparation and cell culture techniques are carried out under aseptic conditions using a biosafety cabinet with laminar flow. All culture incubation steps described are carried out using an incubator designed to maintain an atmosphere of 37 °C, 5% CO2, and 95% humidity.
1. Cell culture
2. Seed MSC in experimental dishes, Day 1
NOTE: Prior to seeding the MSC, design the experimental 96-well plate layout for fluorescent spectrophotometry and the chamber slide for dynamic imaging. For the 96-well plate, flank experimental wells with wells containing cells but do not use them in the assay. Mark at least four wells to be used for the reagent blank (RBL). See Table 1 for an example 96-well template and Table 2 for an example of a 4-well chamber slide template. Black or white 96-well plates with clear bottoms are recommended. A 1.5 mm borosilicate glass chamber slide is optimal, but the number of chambers can be adjusted dependent on the study design. A summary flow chart of the methods that follow is included in Figure 2.
3. Activate the MΦ with IFN-γ, Day 1
4. Isolate the MΦ and prepare the co-cultures, Day 2
5. Phagocytosis assay, kinetic fluorescent 96-well plate read, Day 3
6. Phagocytosis assay, dynamic imaging, Day 3
After calculating mean ± SEM for each group at all time points, the data is presented in line graph format with the Y-axis as the Relative Fluorescent Intensity and the X-axis as Time. Supplementary File 1 provides an example of raw data from a kinetic read of the 96-well plate in a spreadsheet format.
In this study, the optimal results presented in Figure 3A, and Table 3 demonstrate that 1) co-culture with MSC enhances the phagocytic activity of the macrophage, 2) IFN-y treatment reduces the activity of the macrophage, and 3) co-culture with MSC partially rescues MΦ phagocytic activity. Optimal cell densities are critical in these studies, and when MΦ are plated at too low of a density, changes in fluorescence intensity cannot be detected (Figure 3B). Figure 3C represents data from a study where the MΦ were plated at too high of a density and fluorescence intensity is elevated rapidly in all groups, and differences cannot be discerned. The dynamic imaging videos confirm that the fluorescent intensity changes result from phagocytosis and not acidification of the medium. They also provide qualitative data and a visual representation of the rate and extent of phagocytic activity (Figure 4).
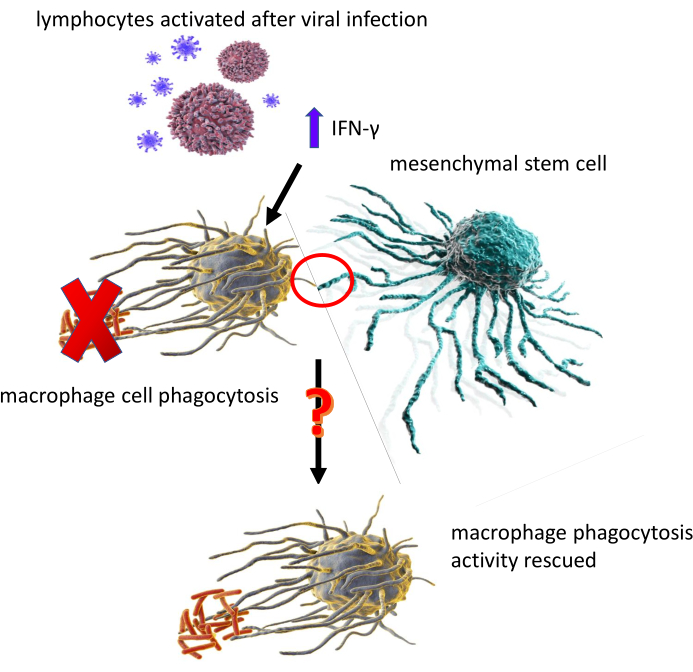
Figure 1: An illustration depicting the central question of the data presented, which is "Can MSC recover the phagocytic activity of IFN-γ treated MΦ?". Please click here to view a larger version of this figure.
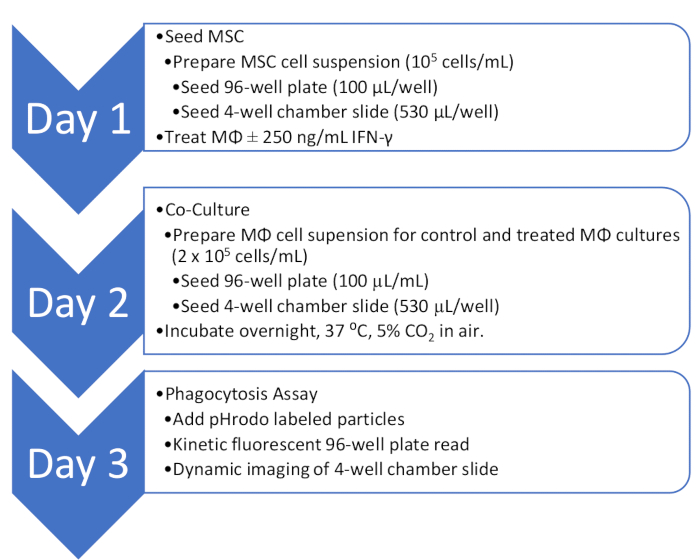
Figure 2: Overview of the co-culture and phagocytosis assay workflow. An outline of the workflow for quantitative and qualitative analysis of MΦ phagocytosis activity in co-culture with MSC. Please click here to view a larger version of this figure.
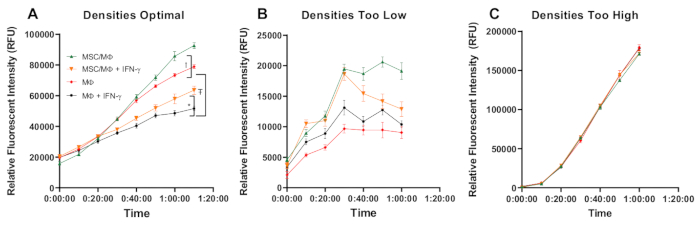
Figure 3: Representative quantitative data from the kinetic readdemonstrating optimal and suboptimal results. In (A), data are representative of an experiment with optimal MΦ cell density, in (B) data are representative of an experiment with suboptimal too low MΦ cell density, and in (C), data are representative of an experiment with suboptimal too high MΦ cell density. The relative fluorescence intensity measured in relative fluorescent units (RFU) is plotted on the Y-axis, while time is plotted on the X-axis. Note the differences in the range of RFU among optimal and sub-optimal experiments. In A, MSC partially rescue MΦ phagocytic activity in the setting of IFN-γ suppression over a 70 min period. The RFU is presented as mean ± the SEM, n = 6. The analysis was performed using Tukey's multiple comparisons test after a significant two-way ANOVA, Interaction effect P = 0.0001, Time effect P = 0.0001, and Treatment/MSC effect P = 0.0001. Symbols denote results of multiple comparison tests. * = significant difference between MSC/MΦ + IFN- γ vs MΦ + IFN-γ, Ŧ = significant difference between MΦ vs MΦ + IFN-γ, and † = significant difference between MSC/MΦ vs MΦ. See Table 3 for detailed results of the multiple comparison tests. Please click here to view a larger version of this figure.
Figure 4: Dynamic imaging videos providing visual confirmation of the cell-specific increase in fluorescence from acidic activation of labeled zymosan particles after incorporation into the MΦ phagolysosome. Time-lapse settings were acquisition every 1 min over a 30 min period using an exposure time of 400 ms and the EGFP filter set. (A) MΦ in monoculture, (B) MΦ in co-culture with MSC, (C) MΦ treated with IFN-γ (250 ng/mL) and (D) MΦ treated with IFN-γ (250 ng/mL) in co-culture with MSC. Please click here to download this File.
1 | 2 | 3 | 4 | 5 | 6 | 7 | 8 | 9 | 10 | 11 | 12 | |
A | CBL | MSC/MΦ | MSC/MΦ+ | MΦ | MΦ+ | CBL | RBL | |||||
B | CBL | MSC/MΦ | MSC/MΦ+ | MΦ | MΦ+ | CBL | RBL | |||||
C | CBL | MSC/MΦ | MSC/MΦ+ | MΦ | MΦ+ | CBL | RBL | |||||
D | CBL | MSC/MΦ | MSC/MΦ+ | MΦ | MΦ+ | CBL | RBL | |||||
E | CBL | MSC/MΦ | MSC/MΦ+ | MΦ | MΦ+ | CBL | RBL | |||||
F | CBL | MSC/MΦ | MSC/MΦ+ | MΦ | MΦ+ | CBL | RBL | |||||
G | CBL | MSC/MΦ | MSC/MΦ+ | MΦ | MΦ+ | CBL | RBL | |||||
H | CBL | MSC/MΦ | MSC/MΦ+ | MΦ | MΦ+ | CBL | RBL |
Table 1: Example of a 96-well plate design. CBL – Cell blank; MSC – seeded day 1; MΦ+ treated and MΦ untreated seeded day 2; RBL reagent blank added on assay day 3.
1 | 2 | 3 | 4 |
MSC/MΦ | MSC/MΦ+ | MΦ | MΦ+ |
Table 2: Example of a 4-well chamber slide design. MSC – plated day 1; MΦ+ treated and MΦ untreated plated day 2.
Tukey's multiple comparisons test | Mean Diff. | 95.00% CI of diff. | Below threshold? | Summary | Adjusted P Value |
0 minutes | |||||
MSC/MΦ vs. MΦ | -3871 | -9495 to 1754 | No | ns | 0.2836 |
MSC/MΦ + IFN-γ vs. MΦ + IFN-γ | 720.3 | -4904 to 6345 | No | ns | 0.9873 |
MΦ vs. MΦ + IFN-γ | -77.17 | -5702 to 5548 | No | ns | >0.9999 |
10 minutes | |||||
MSC/MΦ vs. MΦ | -3466 | -9091 to 2159 | No | ns | 0.3817 |
MSC/MΦ + IFN-γ vs. MΦ + IFN-γ | 2326 | -3299 to 7950 | No | ns | 0.7062 |
MΦ vs. MΦ + IFN-γ | 992 | -4633 to 6617 | No | ns | 0.968 |
20 minutes | |||||
MSC/MΦ vs. MΦ | -1311 | -6936 to 4314 | No | ns | 0.9303 |
MSC/MΦ + IFN-γ vs. MΦ + IFN-γ | 3315 | -2310 to 8940 | No | ns | 0.422 |
MΦ vs. MΦ + IFN-γ | 3146 | -2478 to 8771 | No | ns | 0.4689 |
30 minutes | |||||
MSC/MΦ vs. MΦ | 384.8 | -5240 to 6010 | No | ns | 0.998 |
MSC/MΦ + IFN-γ vs. MΦ + IFN-γ | 2313 | -3312 to 7937 | No | ns | 0.7098 |
MΦ vs. MΦ + IFN-γ | 8726 | 3101 to 14350 | Yes | *** | 0.0005 |
40 minutes | |||||
MSC/MΦ vs. MΦ | 2247 | -3377 to 7872 | No | ns | 0.7278 |
MSC/MΦ + IFN-γ vs. MΦ + IFN-γ | 4913 | -712.2 to 10537 | No | ns | 0.1101 |
MΦ vs. MΦ + IFN-γ | 16521 | 10896 to 22145 | Yes | **** | <0.0001 |
50 minutes | |||||
MSC/MΦ vs. MΦ | 5657 | 32.12 to 11282 | Yes | * | 0.0481 |
MSC/MΦ + IFN-γ vs. MΦ + IFN-γ | 4932 | -692.9 to 10557 | No | ns | 0.1079 |
MΦ vs. MΦ + IFN-γ | 19083 | 13458 to 24708 | Yes | **** | <0.0001 |
60 minutes | |||||
MSC/MΦ vs. MΦ | 12376 | 6752 to 18001 | Yes | **** | <0.0001 |
MSC/MΦ + IFN-γ vs. MΦ + IFN-γ | 9361 | 3736 to 14986 | Yes | *** | 0.0002 |
MΦ vs. MΦ + IFN-γ | 24748 | 19123 to 30373 | Yes | **** | <0.0001 |
70 minutes | |||||
MSC/MΦ vs. MΦ | 13770 | 8145 to 19395 | Yes | **** | <0.0001 |
MSC/MΦ + IFN-γ vs. MΦ + IFN-γ | 11987 | 6362 to 17612 | Yes | **** | <0.0001 |
MΦ vs. MΦ + IFN-γ | 27264 | 21639 to 32888 | Yes | **** | <0.0001 |
Table 3: Detailed statistical analysis of the data presented in Figure 3A. Results of Tukey's multiple comparison tests after a significant two-way ANOVA of data presented in Figure 3A.
Supplementary File 1: A representative spreadsheet file of raw kinetic data from an optimal experiment. Please click here to download this File.
96 Well Black Polystyrene Microplate | MilliporeSigma | CLS3603-48EA | |
0.4% trypan blue solution | MilliporeSigma | T8154-20ML | |
15 mL and 50 mL Conical Sterile Polypropylene Centrifuge Tubes | ThermoFisher | 339653 | |
4-well Chambered Coverglass w/ non-removable wells | ThermoFisher | 155382PK | |
Antibiotic-Antimycotic (100X) Gibco | ThermoFisher | 15240096 | |
Axiobserver 7 Imaging System | Zeiss | ||
Bovine Serum Albumin (BSA) | MilliporeSigma | A8806-1G | |
Cell lifter | MilliporeSigma | CLS3008-100EA | |
Culture flasks, tissue culture treated, surface area 75 cm2, canted neck, with cap, filtered | MilliporeSigma | C7231-120EA | |
D1 ORL UVA [D1] | ATCC | CRL-12424 | Mouse MSC Cell Line |
DMEM, High Glucose | ThermoFisher | 11965092 | |
Fetal Bovine Serum, qualified, heat inactivated | ThermoFisher | 16140071 | |
Hemocytometer | FisherScientific | 02-671-51B | |
I-11.15 | ATCC | CRL-2470 | Mouse MΦ Cell Line |
LADMAC Cell Line | ATCC | CRL-2420 | LADMAC cells secrete the growth factor colony stimulating factor 1 (CSF-1). |
Live-Cell Imaging solution | ThermoFisher | A14291DJ | |
PBS, pH 7.4 | ThermoFisher | 10010031 | |
pHrodo Green Zymosan Bioparticles Conjugate | ThermoFisher | P35365 | |
Recombinant Murine IFN-γ | Preprotech | 315-05 | |
Spectramax i3X | Molecular Devices | ||
Sterile Single Use Vacuum Filter Units, 250 mL, 0.2 µm | ThermoFisher | 568-0020 | |
Sterile syringe filters, 0.2 micrometer | ThermoFisher | 723-2520 | |
Tissue-culture treated culture dishes, 100 mm x 20 mm | MilliporeSigma | CLS430167-100EA | |
Trypsin-EDTA (0.05%), phenol red | ThermoFisher | 25300054 |
Mesenchymal stem cells (MSC) have traditionally been studied for their regenerative properties, but more recently, their immunoregulatory characteristics have been at the forefront. They interact with and regulate immune cell activity. The focus of this study is the MSC regulation of macrophage phagocytic activity. Macrophage (MΦ) phagocytosis is an important part of the innate immune system response to infection, and the mechanisms through which MSC modulate this response are under active investigation. Presented here is a method to study MΦ phagocytosis of non-opsonized zymosan particles conjugated to a pH-sensitive fluorescent molecule while in co-culture with MSC. As phagocytic activity increases and the labeled zymosan particles are enclosed within the acidic environment of the phagolysosome, the fluorescence intensity of the pH-sensitive molecule increases. With the appropriate excitation and emission wavelengths, phagocytic activity is measured using a fluorescent spectrophotometer and kinetic data is presented as changes in relative fluorescent units over a 70 min period. To support this quantitative data, the change in the phagocytic activity is visualized using dynamic imaging. Results using this method demonstrate that when in co-culture, MSC enhance MΦ phagocytosis of non-opsonized zymosan of both naive and IFN-γ treated MΦ. These data add to the current knowledge of MSC regulation of the innate immune system. This method can be applied in future investigations to fully delineate the underlying cellular and molecular mechanisms.