Science Education
>

In Vivo Immunogenicity Screening of Tumor-Derived Extracellular Vesicles by Flow Cytometry of Splenic T Cells

Instructor Prep
concepts
Student Protocol
JoVE Journal
Cancer Research
A subscription to JoVE is required to view this content.  Sign in or start your free trial.
JoVE Journal Cancer Research
In Vivo Immunogenicity Screening of Tumor-Derived Extracellular Vesicles by Flow Cytometry of Splenic T Cells

At the onset of experiments, mice were at least 6 weeks of age and were maintained under specific pathogen-free conditions. The present protocol complies with the Institutional ethical standards and prevailing local regulations. Animal studies were approved by the local regulatory agency (Regierung von Oberbayern, Munich, Germany). Possible sex-related biases were not investigated in these studies.

1. Generation and isolation of EVs derived from tumor cells after chemotherapy exposure

  1. Culture murine B16 melanoma cells expressing ovalbumin (B16-OVA) in DMEM (containing 4 mM L-glutamine and 4.5 g/L D-glucose) supplemented with FCS (10% v/v), penicillin (100 Units/mL), and streptomycin (100 μg/mL) at 37 °C, until cells grow steadily and are approximately 90% confluent.
    NOTE: Perform this section of the protocol entirely under sterile conditions using a cell culture hood. For analysis of other cancer entities, cell lines expressing a potent antigen are preferable to assess antigen-specific T cell responses, as they allow for specific ex vivo antigen restimulation.
  2. To prepare the cell culture media required for EV generation, deplete bovine EVs within FCS by ultracentrifugation at 100,000 x g for 24 h at 4 °C, and then discard the pellet. Alternatively, choose a commercial preparation low in animal EVs beforehand.
  3. Harvest B16-OVA cells and wash them twice in PBS, and then seed at a concentration of 400,000 cells/mL in EV-depleted media.
    NOTE: Adapt the cell concentration to the growth dynamic of the cell line under investigation so that cells do not overgrow.
  4. Treat B16-OVA cells by adding 30 μg of oxaliplatin per mL and incubate for 24 h at 37 °C. Leave control conditions untreated. At the first use of a genotoxic substance, titrate the desired cytotoxic efficacy using cell-viability assays such as trypan blue exclusion18.
    NOTE: This assay may also evaluate EVs generated in cell cultures treated with other immune-modulating substances or ionizing irradiation besides chemotherapeutics.
    CAUTION: Oxaliplatin causes skin and severe eye irritation and may cause an allergic skin reaction and respiratory irritation. Oxaliplatin is suspected of causing cancer. As a precaution, use personal protective equipment, including adequate gloves, goggles, masks, and clothing, cleaned before reuse. Avoid inhalation and wash hands thoroughly after handling. Avoid release into the environment and dispose oxaliplatin according to prevailing regulations. Obtain detailed information from the safety data sheet.
  5. Collect cell culture supernatant. Centrifuge first at 400 x g for 5 min at 4 °C, and then at 2,000 x g for 30 min at 4 °C, each time discarding the pellet. Finally, filter through a 220 nm PVDF membrane. Use a fresh tube for each step to remove any cell debris.
    NOTE: At this stage, the EV-containing supernatant may be stored at 4 °C for a day before resuming the protocol. However, it is strongly recommended to adhere to the described schedule with immediate EV purification.
  6. Mix 1 mL of supernatant with 0.5 mL of a specific commercially available exosome isolation reagent (see Table of Materials) in a V-shaped 1.5 mL tube. Thoroughly pipette up and down or vortex to create a homogenous solution. Incubate overnight at 4 °C.
  7. Centrifuge at 10,000 x g for 60 min at 4 °C. Carefully discard the supernatant. Remove the remaining drops by tapping the 1.5 mL tube upside down on a paper towel and by aspiration through a pipette with a fine tip without touching the EV-pellet at the bottom.
    1. Thoroughly remove all fluids to prevent uncontrolled dilution of the EV-pellet. Also, execute these tasks quickly to prevent the pellet from drying out.
  8. Resuspend the EVs in cold PBS by pipetting up and down without scratching the pellet from the tube's wall with the tip. Now, transfer the suspension step by step from the first to the last tube to pool the EVs.
    NOTE: Use a volume of PBS that equals 5 μL multiplied by the number of tubes. 5 μL of the final suspension contains the isolated EVs released from 400,000 cells under chemotherapy or at a steady state.
  9. Preferably, use EVs directly. If this is not possible, store EV suspensions at -80 °C in siliconized vessels for up to 28 days until application.
    NOTE: The EVs described here and in several other publications do not lose their respective biological function when stored at -80 °C for that time period19.
  10. Quantify and characterize EV isolates according to the MISEV2018 guidelines20.
    NOTE: Possible methods for quantification include nanoparticle tracking analysis (NTA)21 and the detection of EV's membrane-bound proteins22. Possible approaches to further characterize EVs include electron microscopy23 and western blot20.

2. Immunization of mice with EVs

  1. Plan the in vivo experiment with C57BL/6 mice (or other syngeneic mice corresponding to the tumor cell line), including treatment groups receiving EVs derived from treated cells, untreated cells, and PBS (vehicle), respectively.
    NOTE: Preferably, use mice at the age of 6-8 weeks to prevent physiological senescence from diminishing the immune response24.
  2. Mix 5 μL of EV-suspension with 55 μL cold PBS for each mouse within the respective treatment group to immunize it with EVs isolated from 4.0 x 10⁵ B16-OVA cells.
    NOTE: This amount of EVs corresponds to approximately 2 x 10⁹ particles measured by nanoparticle tracking analysis (data not shown). OVA protein mixed with an adjuvant (e.g., LPS) can be applied as a potent vaccine positive control.
    1. Fill syringes (needle size 26-30 G) with 60 μL of the diluted EVs or PBS, respectively and put immediately on ice.
      NOTE: In the protocol, the amount of injected EVs is normalized to the number of EV-releasing tumor cells to experimentally consider both qualitative and quantitative effects of oxaliplatin on tumor cell EV biogenesis. For some readers, normalization to a specific concentration of produced EVs may better fit their experimental setup depending on their scientific question.
  3. Inoculate EVs or PBS subcutaneously into the medial aspect of the mice's thigh and repeat the immunization after 7 days. Fourteen days after the first treatment, sacrifice mice, e.g., by cervical dislocation to analyze the immune response.
    ​NOTE: Alternative subcutaneous injection routes may be used, according to the local standards.

3. Flow cytometry analysis of splenic T cells

  1. Prepare and cool complete RPMI (cRPMI), supplementing RPMI-1640 with FCS (10% v/v), penicillin (100 Units/mL), streptomycin (100 μg/mL), L-glutamine (2 mM), and β-mercaptoethanol (50 μM).
  2. Resect the spleen from the opened abdominal cavity. Mash the spleen with a moistened 100 μm cell strainer and the plastic plunger of a syringe and flush the splenic cells into a 50 mL tube with 5-10 mL of cRPMI. Centrifuge at 400 x g for 5 min at 4 °C and discard the supernatant.
    NOTE: Keep cells on ice whenever possible. To analyze the local rather than the splenic immune response, resect the draining popliteal and inguinal lymph nodes, following the same protocol. In this case, skip the next step for the lysis of erythrocytes.
  3. To remove erythrocytes from the cell suspension, resuspend the pellet with 2 mL of red blood cell lysis buffer (see Table of Materials) and incubate for 5 min at room temperature. Then, stop the reaction by adding cRPMI. Centrifuge at 400 x g for 5 min at 4 °C and discard the supernatant.
  4. For seeding, resuspend the cell pellet in cRPMI and count the cells to place triplicates of 200,000 cells with 200 μL cRPMI into each well, using a 96-well plate with a U-shaped bottom. Incubate for 48 h at 37 °C.
    NOTE: To address the antigen-specificity of activated T cells, add 1 μg/mL soluble ovalbumin (or another tumor antigen corresponding to cell line under investigation) or leave without additional stimulus, respectively. Adding the immune-dominant peptide epitope SIINFEKL, instead of full-length ovalbumin, allows for a shorter incubation period. Besides flow cytometry, the mice's serum and the cell culture supernatant after 48 h of incubation can be analyzed for various cytokines.
  5. After 48 h, to enhance intracellular IFN-γ staining by, inter alia, blocking the Golgi-mediated secretion of proteins, add Brefeldin A (5 ng/mL), PMA (20 ng/mL), and Ionomycin (1 µg/mL) to the cell culture. Incubate for 4 h at 37 °C.
  6. Before staining surface biomarkers, transfer splenocytes to a 96-well plate with a V-shaped bottom and wash twice with PBS. Then, add fluorescent antibodies, compatible with the locally available flow cytometer, directed against surface biomarkers, CD3, CD8, and CD4 (see Table of Materials), diluted 1:400, plus a fixable viability dye, diluted 1:1,000 in PBS. Resuspend pelleted splenocytes in the staining solution and incubate for 30 min at 4 °C, protected from light.
  7. For fixation and permeabilization of splenocytes, wash twice in FACS-buffer (PBS plus 3% v/v FCS), and then resuspend in 100 µL of fixation/permeabilization buffer (see Table of Materials) per well. Incubate for 30 min at 4 °C, protected from light.
  8. For staining of intracellular IFN-γ, wash splenocytes in fixation/permeabilization buffer and resuspend with fluorescent antibodies against IFN-γ, diluted 1:200 in the buffer. Incubate for at least 1 h (up to a maximum of 12 h) at 4 °C, protected from light.
  9. Before measuring the samples by flow cytometry, wash splenocytes twice in fixation/permeabilization buffer and resuspend in FACS-buffer. Analyze the activation of cytotoxic T cells according to the gating strategy displayed in Figure 2.
    1. First, to detect single cells, blot FSC-H against FSC-A. Then, to detect lymphoid cells, blot SSC against FSC-A. Subsequently, select living CD3+, CD4, CD8+ cells and determine their IFN-γ-producing subset to quantify the activation of cytotoxic T cells in the spleen.
      NOTE: Include a Fluorescence-minus-one (FMO) stain with all fluorochromes except the fluorochrome targeted against IFN-γ as negative technical control.

In Vivo Immunogenicity Screening of Tumor-Derived Extracellular Vesicles by Flow Cytometry of Splenic T Cells

Learning Objectives

This protocol is intended to facilitate the straightforward and easily reproducible assessment of the immunogenicity of tumor-derived EVs. Hereby, mice are inoculated with EVs derived from in vitro cultures of tumor cells expressing the model antigen chicken ovalbumin (OVA). The subsequent immune response is analyzed in splenic T cells via flow cytometry.

Figure 1 gives an overview of the practical steps of the entire protocol. Since the work focuses on immunogenic cell death, cross-presentation, and EV-induced anti-tumor immunity, this protocol is restricted to the function of CD8+ cytotoxic T cells. As displayed in Figure 2, cells were gated as single cells, lymphocyte subset (by size and granularity), viable cells (excluding a life/dead marker), and CD3+ CD4 CD8+ cytotoxic T cells. Intracellular accumulation of IFN-γ was assessed as a surrogate marker for activation. Possible additional markers regarding T cell differentiation and exhaustion are discussed below.

Using the method described here, mice were immunized with EVs derived from OVA-expressing tumor cells cultured either under steady-state (untreated) or genotoxic stress conditions (oxaliplatin-treated). Only mice injected with EVs derived from tumor cells under genotoxic stress conditions induced potent activation of splenic cytotoxic T cells in recipient animals (Figure 3A). Injection of EVs derived from tumors under steady-state conditions resulted in some T cell activation, but that was not significantly different from T cell activation in mice injected with the PBS vehicle. These data show that under genotoxic stress, tumor cells can release potently immunogenic EVs. The production of IFN-γ was particularly increased when splenocytes of tumor EV-treated animals were ex vivo restimulated with the model tumor antigen OVA before analysis (Figure 3B). These data suggest that tumor-derived EVs can induce tumor antigen-specific immune responses. Interestingly, IFN-γ-production – even though to a much lesser extent – is also detected in the absence of antigen-specific restimulation. Possibly, other melanoma-associated antigens, such as the differentiation antigen TRP225, may be targeted by some part of the EV-induced T cell response.

Figure 1
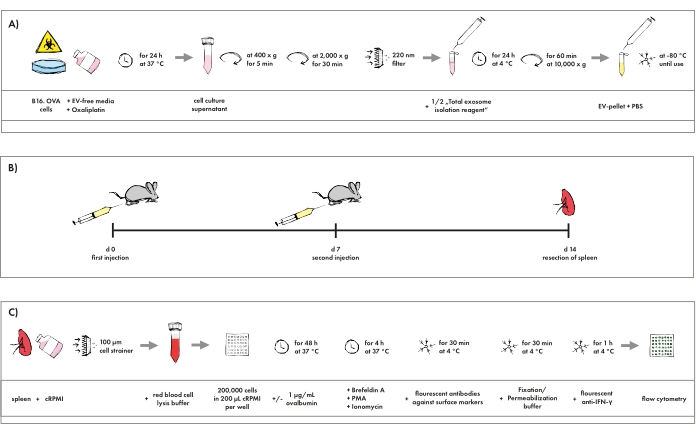
Figure 1: Pictographic overview of the protocol. (A) Isolation procedure of EVs generated in tumor cell cultures resembling chemotherapy. (B) Schedule for the immunization of mice with EVs. (C) Staining protocol for flow cytometry analysis of cytotoxic T cells. Please click here to view a larger version of this figure.

Figure 2
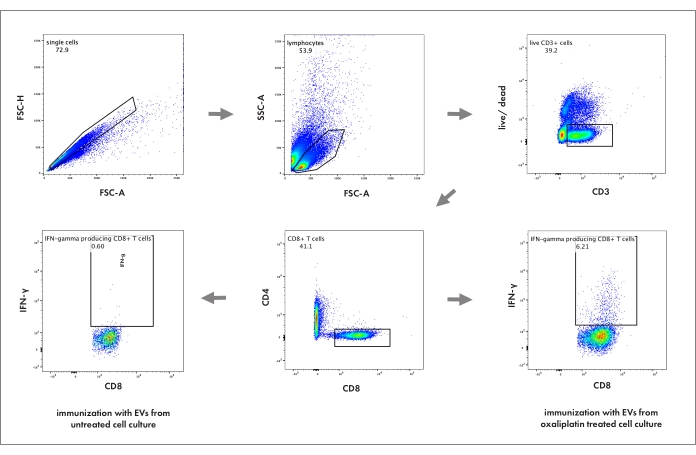
Figure 2: Flow cytometry gating strategy to analyze cytotoxic T cell activation in the spleen. The numbers represent the percentage of its respective parent population. FSC-A: forward scatter area; FSC-H: forward scatter height; SSC: sideward scatter; live/dead: cell death marker. Please click here to view a larger version of this figure.

Figure 3
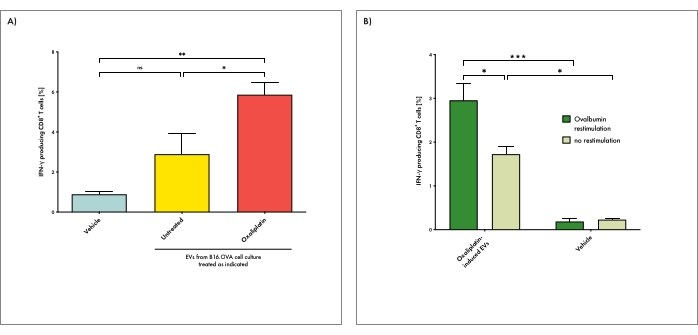
Figure 3: EVs derived from tumor cells under genotoxic stress can induce antigen-specific T cell responses in recipient animals. (A) Mice were immunized with EVs derived from tumor cells cultured either under steady-state (untreated) or genotoxic stress conditions (oxaliplatin-treated). Vehicle (PBS) injections were used as a negative control. IFN-γ production by cytotoxic T cells in the spleen upon EV immunization was determined. With this, splenic cell suspensions were restimulated with ovalbumin ex vivo before analysis. (B) Mice were treated with EVs derived from tumor cells under genotoxic stress conditions as described above. Splenic T cell activation was determined after ex vivo restimulation either in the presence or absence of ovalbumin. Bars depict the mean per group and whiskers its standard error. The one-way analysis of variance (ANOVA) test with Bonferroni posttest was used for multiple statistical comparisons of a dataset. The significance level was set at P < 0.05, P < 0.01, and P < 0.001 and is indicated here with asterisks (*, **, and ***). Please click here to view a larger version of this figure.

List of Materials

Anti-CD3 FITC Biolegend 100204 Clone 17A2
Anti-CD4 PacBlue Biolegend 100428 Clone GK1.5
Anti-CD8 APC Biolegend 100712 Clone 53-6.7
Anti-IFNγ PE eBioscience RM90022 Clone XMG1.2
Brefeldin A Biolegend 420601 Brefeldin A Solution (1,000x)
Cell Strainer, 100 µm Greiner 542000 EASYstrainer 100 µm
DMEM Sigma-Aldrich D6429 Dulbecco's Modified Eagle's Medium with D-glucose (4.5 g/L) and L-glutamine (4 mM)
FBS Good Forte PAN BIOTECH P40-47500 Fetal Calf Serum (FCS)
Fixable Viability Dye eFluor 506 eBioscience, division of Thermo Fischer Scientific 65-0866-14
Fixation/Permeabilization Concentrate eBioscience 00-5123-43 Fixation/Permeabilization Concentrate (10x)
Fixation/Permeabilization Diluent eBioscience 00-5223-56
Ionomycin Sigma-Aldrich 407952 From Streptomyces conglobatus – CAS 56092-82-1, ≥ 97% (HPLC)
L-Glutamine Gibco 25030-032 L-Glutamine (200 mM)
Ovalbumin InvivoGen vac-pova Ovalbumine with < 1 EU/mg endotoxin – CAS 9006-59-1
Oxaliplatin Pharmacy of MRI hospital
PBS Sigma-Aldrich D8537 Phosphate Buffered Saline without calcium chloride and magnesium chloride
Penicillin-Streptomycin Gibco 1514-122 Mixture of penicillin (10,000 U/mL) and streptomycin (10,000 ug/mL)
PMA Sigma-Aldrich P1585 Phorbol 12-myristate 13-acetate, ≥ 99% (HPLC)
PVDF filter, 0,22 µm, for syringes Merck Millipore SLGV033RS Millex-GV Filter Unit 0.22 µm Durapore PVDF Membrane
Red Blood Cell Lysis Buffer Invitrogen 00-4333-57
RPMI 1640 Thermo Fischer Scientific 11875 Roswell Park Memorial Institute 1640 Medium with D-glucose (2.00 g/L) and L-glutamine (300 mg/L), without HEPES
Syringe, 26 G BD Biosciences 305501 1 mL Sub-Q Syringes with needle (0.45 mm x 12.7 mm)
Total Exosome Isolation Reagent Invitrogen 4478359 For isolation from cell culture media
β-Mercaptoethanol Thermo Fischer Scientific 31350 β-Mercaptoethanol (50 mM)

Lab Prep

Immunogenic cell death of tumors, caused by chemotherapy or irradiation, can trigger tumor-specific T cell responses by releasing danger-associated molecular patterns and inducing the production of type I interferon. Immunotherapies, including checkpoint inhibition, primarily rely on preexisting tumor-specific T cells to unfold a therapeutic effect. Thus, synergistic therapeutic approaches that exploit immunogenic cell death as an intrinsic anti-cancer vaccine may improve their responsiveness. However, the spectrum of immunogenic factors released by cells under therapy-induced stress remains incompletely characterized, especially regarding extracellular vesicles (EVs). EVs, nano-scale membranous particles emitted from virtually all cells, are considered to facilitate intercellular communication and, in cancer, have been shown to mediate cross-priming against tumor antigens. To assess the immunogenic effect of EVs derived from tumors under various conditions, adaptable, scalable, and valid methods are sought-for. Therefore, herein a relatively easy and robust approach is presented to assess EVs’ in vivo immunogenicity. The protocol is based on flow cytometry analysis of splenic T cells after in vivo immunization of mice with EVs, isolated by precipitation-based assays from tumor cell cultures under therapy or steady-state conditions. For example, this work shows that oxaliplatin exposure of B16-OVA murine melanoma cells resulted in the release of immunogenic EVs that can mediate the activation of tumor-reactive cytotoxic T cells. Hence, screening of EVs via in vivo immunization and flow cytometry identifies conditions under which immunogenic EVs can emerge. Identifying conditions of immunogenic EV release provides an essential prerequisite to testing EVs’ therapeutic efficacy against cancer and exploring the underlying molecular mechanisms to ultimately unveil new insights into EVs’ role in cancer immunology.

Immunogenic cell death of tumors, caused by chemotherapy or irradiation, can trigger tumor-specific T cell responses by releasing danger-associated molecular patterns and inducing the production of type I interferon. Immunotherapies, including checkpoint inhibition, primarily rely on preexisting tumor-specific T cells to unfold a therapeutic effect. Thus, synergistic therapeutic approaches that exploit immunogenic cell death as an intrinsic anti-cancer vaccine may improve their responsiveness. However, the spectrum of immunogenic factors released by cells under therapy-induced stress remains incompletely characterized, especially regarding extracellular vesicles (EVs). EVs, nano-scale membranous particles emitted from virtually all cells, are considered to facilitate intercellular communication and, in cancer, have been shown to mediate cross-priming against tumor antigens. To assess the immunogenic effect of EVs derived from tumors under various conditions, adaptable, scalable, and valid methods are sought-for. Therefore, herein a relatively easy and robust approach is presented to assess EVs’ in vivo immunogenicity. The protocol is based on flow cytometry analysis of splenic T cells after in vivo immunization of mice with EVs, isolated by precipitation-based assays from tumor cell cultures under therapy or steady-state conditions. For example, this work shows that oxaliplatin exposure of B16-OVA murine melanoma cells resulted in the release of immunogenic EVs that can mediate the activation of tumor-reactive cytotoxic T cells. Hence, screening of EVs via in vivo immunization and flow cytometry identifies conditions under which immunogenic EVs can emerge. Identifying conditions of immunogenic EV release provides an essential prerequisite to testing EVs’ therapeutic efficacy against cancer and exploring the underlying molecular mechanisms to ultimately unveil new insights into EVs’ role in cancer immunology.

Procedure

Immunogenic cell death of tumors, caused by chemotherapy or irradiation, can trigger tumor-specific T cell responses by releasing danger-associated molecular patterns and inducing the production of type I interferon. Immunotherapies, including checkpoint inhibition, primarily rely on preexisting tumor-specific T cells to unfold a therapeutic effect. Thus, synergistic therapeutic approaches that exploit immunogenic cell death as an intrinsic anti-cancer vaccine may improve their responsiveness. However, the spectrum of immunogenic factors released by cells under therapy-induced stress remains incompletely characterized, especially regarding extracellular vesicles (EVs). EVs, nano-scale membranous particles emitted from virtually all cells, are considered to facilitate intercellular communication and, in cancer, have been shown to mediate cross-priming against tumor antigens. To assess the immunogenic effect of EVs derived from tumors under various conditions, adaptable, scalable, and valid methods are sought-for. Therefore, herein a relatively easy and robust approach is presented to assess EVs’ in vivo immunogenicity. The protocol is based on flow cytometry analysis of splenic T cells after in vivo immunization of mice with EVs, isolated by precipitation-based assays from tumor cell cultures under therapy or steady-state conditions. For example, this work shows that oxaliplatin exposure of B16-OVA murine melanoma cells resulted in the release of immunogenic EVs that can mediate the activation of tumor-reactive cytotoxic T cells. Hence, screening of EVs via in vivo immunization and flow cytometry identifies conditions under which immunogenic EVs can emerge. Identifying conditions of immunogenic EV release provides an essential prerequisite to testing EVs’ therapeutic efficacy against cancer and exploring the underlying molecular mechanisms to ultimately unveil new insights into EVs’ role in cancer immunology.

Tags