Preadipocytes are isolated from the stromal vascular fraction of interscapular brown adipose tissue from newborn mice and differentiated into cells that accumulate lipid droplets, express molecular markers, and show the mitochondrial morphology of mature brown adipocytes. These cells are further analyzed by immunofluorescence and transmission electron microscopy.
Brown adipose tissue (BAT) is only present in mammals and has a thermogenic function. Brown adipocytes are characterized by a multilocular cytoplasm with multiple lipid droplets, a central nucleus, a high mitochondrial content, and the expression of uncoupling protein 1 (UCP1). BAT has been proposed as a potential therapeutic target for obesity and its associated metabolic disorders due to its ability to dissipate metabolic energy as heat. To investigate BAT function and regulation, brown adipocyte culturing is indispensable. The present protocol optimizes tissue processing and cell differentiation for culturing brown adipocytes from newborn mice. Additionally, procedures for the imaging of differentiated adipocytes with both confocal immunofluorescence and transmission electron microscopy are shown. In the brown adipocytes differentiated with the techniques described herein, the major defining features of classical BAT are preserved, including high UCP1 levels, increased mitochondrial mass, and very close physical contact between the lipid droplets and mitochondria, making this method a valuable tool for BAT studies.
White and brown adipose tissue differ in their anatomical location, cellular origin, function, morphology, and total mass. White adipose tissue (WAT) is the major physiological energy reservoir of the body and stores large amounts of triacylglycerol (TAG) in highly specialized cells that have a single giant lipid droplet occupying most of their cellular volume1. TAG lipolysis releases free fatty acids, which enter the systemic circulation to meet energy demands during fasting or other states of negative energy balance. Additionally, the WAT secretes protein and lipid products, called adipokines and lipokines, respectively, that have metabolic, immune, and reproductive regulatory functions, thus making the WAT the largest endocrine tissue in the body2.
Brown adipose tissue (BAT) is a much smaller organ whose main physiological function is non-shivering thermogenesis to prevent hypothermia. In mice and newborn humans, BAT is a well-defined organ located in the interscapular space. Adult humans lack interscapular BAT (iBAT); nevertheless, they develop clusters of brown adipocyte-like cells integrated in depots that otherwise mostly comprise WAT. These "brown-in-white" (brite) adipocytes share morphological and molecular features with classical iBAT adipocytes, but they have a different cellular origin3,4.
In contrast to white adipocytes, brown adipocytes have multiple small lipid droplets and abundant mitochondria5. Uncoupling protein 1 (UCP1, also known as thermogenin) is uniquely expressed by brown and brite adipocytes and mediates proton leakage in the inner mitochondrial membrane (IMM), thus uncoupling electron transport from ATP synthesis and generating heat. Non-shivering thermogenesis in BAT is activated by norepinephrine (NE), which is released from the sympathetic terminals in the BAT in response to cold stimulation6. NE binds to beta-adrenoceptors (mostly beta 3) on the surface of brown adipocytes and triggers an intracellular cAMP-mediated signaling cascade. This results in TAG lipolysis, the beta-oxidation of mitochondrial fatty acids, and heat generation upon UCP1 activation3. The close functional relationship between lipid droplets and mitochondria in brown adipocytes has structural parallels, such as the interaction between these organelles in areas that are large and have very tight physical contact7,8.
iBAT has abundant blood vessels and sympathetic terminals9. These structures, along with the preadipocytes, immune cells, fibroblasts, and extracellular matrix molecules, compose the adipose stromal vascular fraction (SVF)10. Many protocols have been reported to generate mature adipocytes from preadipocytes11,12,13,14,15 (Supplementary Table 1); nevertheless, they display extreme variations in tissue processing and the composition of the differentiation culture media. The protocol described herein allows the efficient and reproducible differentiation of brown adipocytes that (1) express the key adipogenic transcription factors peroxisome proliferator-activated receptor gamma (PPARγ) and CCAAT/enhancer-binding protein alpha (C/EBPα), (2) express the mature adipocyte markers perilipin1 (PLIN1), and cluster determinant 36 (CD36), (3) accumulate abundant lipid droplets, (4) have high mitochondrial mass and a high abundance of OXPHOS complexes, (5) have thermogenic potential, as determined by high levels of UCP1, and (6) have mitochondrial morphological changes associated with the phenotype of mature brown adipocytes. This methodology is used for studying the molecular mechanisms underlying generalized lipodystrophy15,16,17.
The animal procedures were approved by the Institutional Animal Care and Use Committee at Pontificia Universidad Católica de Chile. P0.5 newborn mice of both sexes, derived from a mixed background of C57BL/6J and 129J strains, were used for this study.
1. Tissue extraction
2. Tissue digestion
3. Tissue processing
NOTE: After the digestion, perform all the following steps in a class II laminar flow tissue culture hood.
4. Stromal vascular fraction (SVF) culture
5. Adipogenic differentiation
6. Cellular homogenate preparation
7. Western blotting
8. High-resolution imaging
Adipogenesis is regulated by a network of transcription factors that are responsible for both the expression of key proteins that induce brown adipocyte formation and functioning22, including classical adipogenic regulators such as PPARγ and C/EBPα23,24,25, as well as markers of mature adipocytes26,27. Through testing the different concentrations of rosiglitazone that allow the acquisition of the thermogenic brown adipose phenotype, the method described herein allows the differentiation of preadipocytes present in the SVF of iBAT of newborn P0.5 mice to mature brown adipocytes. The addition of 5 µM rosiglitazone in the induction and maintenance medium markedly increased the protein levels of the adipogenic regulators and UCP1 at day 7 of differentiation compared with a lower concentration of this PPARγ agonist (1 nM) (Figure 3). Undifferentiated preadipocytes (day 0) present very low or undetectable levels of PPARγ, C/EBPα, PLIN1, and CD36. In contrast, these markers were significantly higher on day 7 of differentiation (Figure 4A–F). Consistent with the previously published results15, brown preadipocytes accumulated multiple lipid droplets across the differentiation protocol (Figure 5).
The mitochondrial mass increases during brown adipogenesis and is strongly associated with lipid droplet accumulation28. The present protocol markedly increased the mitochondrial mass marker TOM20 (Figure 6) and the OXPHOS complex (Figure 7) protein levels at day 7 of differentiation. UCP1 is highly expressed in mature brown adipocytes and is a bona fide marker of this cell type29. As shown in Figure 6, UCP1 was not detectable in undifferentiated preadipocytes (day 0) but was markedly increased at day 7 of differentiation.
Brown adipogenic differentiation is associated with changes in mitochondrial morphology and their physical association with other organelles15,30. As shown in Figure 8, the mitochondria evolved from an elongated tubular shape at day 0 toward a "rounded" or "bean-like" shape at day 7 (Figure 8A,B). The mitochondrial inner structure was also modified by adipogenesis, resulting in higher density of the parallel-packed cristae. Importantly, the mitochondria were intimately associated with lipid droplets in the differentiated brown adipocytes, so no discernible distance between the outer membrane of the mitochondria and the surfaces of the lipid droplets could be detected, even with high-resolution transmission electron microscopy (Figure 8C,D).
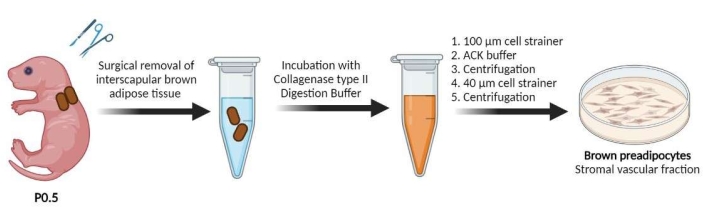
Figure 1: Generation of primary cultured preadipocytes from the SVF of the iBAT. Preadipocyte-containing SVFs were obtained from the interscapular adipose tissue of newborn (P0.5) mice. The interscapular brown adipose tissue was digested with collagenase type II digestion buffer. The blood cells were lysed with ACK buffer. The preadipocytes contained in the SVF were seeded in 24-well plates. Please click here to view a larger version of this figure.
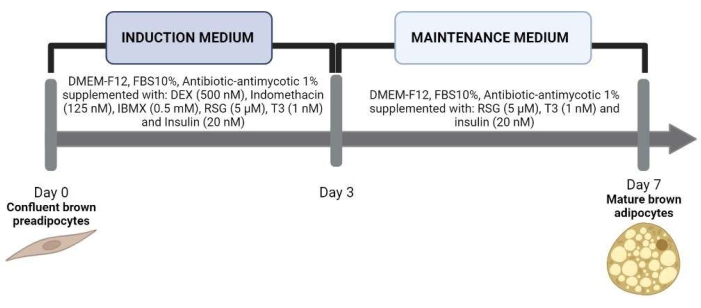
Figure 2: Induction of adipogenesis in primary cultured preadipocytes. Once the SVF cells reached confluency, adipogenesis was induced with the induction medium. On the third day of differentiation, this medium was replaced by a maintenance medium until day 7. Abbreviations: DMEM-F12 = Dulbecco's Modified Eagle Medium/Nutrient Mixture F-12; FBS = fetal bovine serum; DEX = dexamethasone; IBMX = isobutylmethylxanthine; RSG = rosiglitazone; T3 = triiodothyronine. Please click here to view a larger version of this figure.
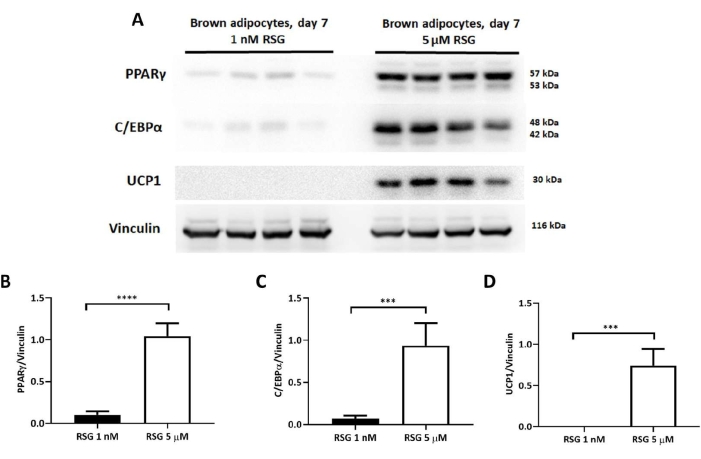
Figure 3: Protein levels of PPARγ, C/EBPα, and UCP1 in differentiated brown adipocytes differentiated with 1 nM or 5 µM rosiglitazone. (A) Representative immunoblot images of adipogenic regulators and UCP1 on day 7 of differentiation. Immunoblot quantification of (B) PPARγ, (C) C/EBPα, and (D) UCP1 protein levels; normalized to vinculin levels (n = 4 per experimental condition). Results expressed as mean ± SD. ***p < 0.001, and ****p < 0.0001 between adipocytes treated with 1 nM versus 5 µM rosiglitazone. The p-values were calculated using a Student's t-test. Please click here to view a larger version of this figure.
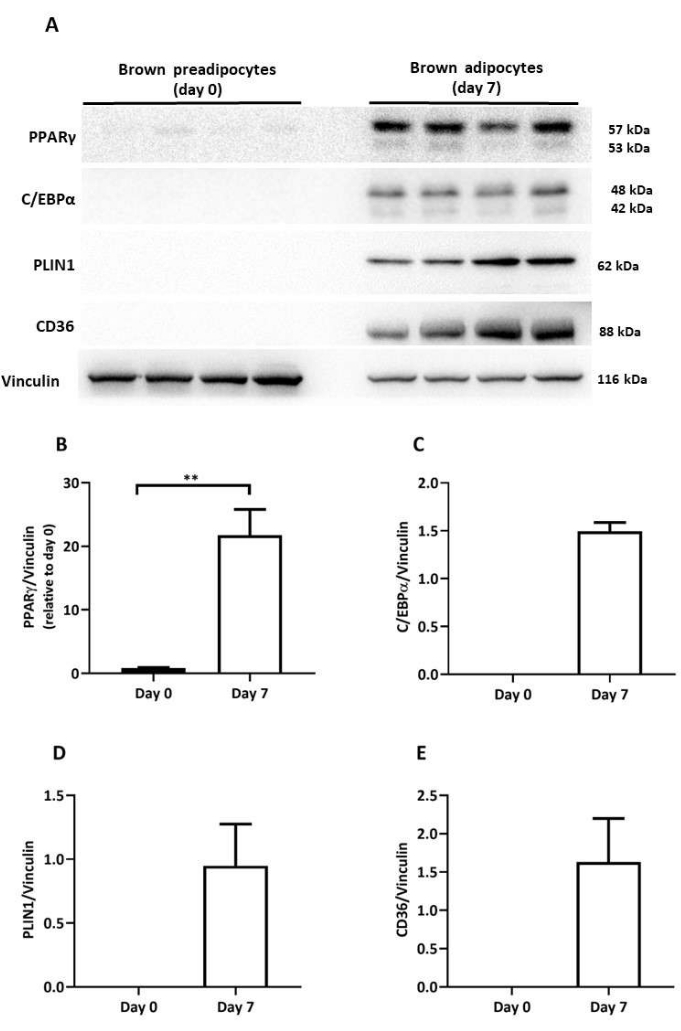
Figure 4: Protein levels of brown adipogenic regulators and mature adipocyte markers in differentiated brown adipocytes. (A) Representative immunoblot images of PPARγ, C/EBPα, PLIN1, and CD36of differentiated brown adipocytes on day 0 and day 7 of differentiation. Immunoblot quantification of (B) PPARγ, (C) C/EBPα, (D) PLIN1, and (E) CD36 protein levels; normalized to vinculin levels (n = 4 per differentiation day). Results expressed as mean ± SD. **p < 0.01 between undifferentiated (day 0) and differentiated brown adipocytes (day 7). The p-values were calculated using a Student's t-test. Please click here to view a larger version of this figure.
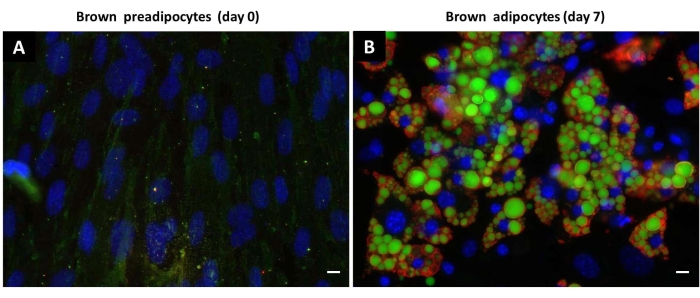
Figure 5: Accumulation of lipid droplets by differentiated brown adipocytes. Representative immunofluorescence images showing the staining of neutral lipids with BODIPY (green) and PLIN1 (red) and the staining of nuclei with Hoechst 33342 (blue) in brown (pre)adipocytes on day 0 and day 7 of differentiation. (A) Brown preadipocytes, day 0 of differentiation. (B) Brown adipocytes, day 7 of differentiation. Scale bar: 20 µm. Please click here to view a larger version of this figure.
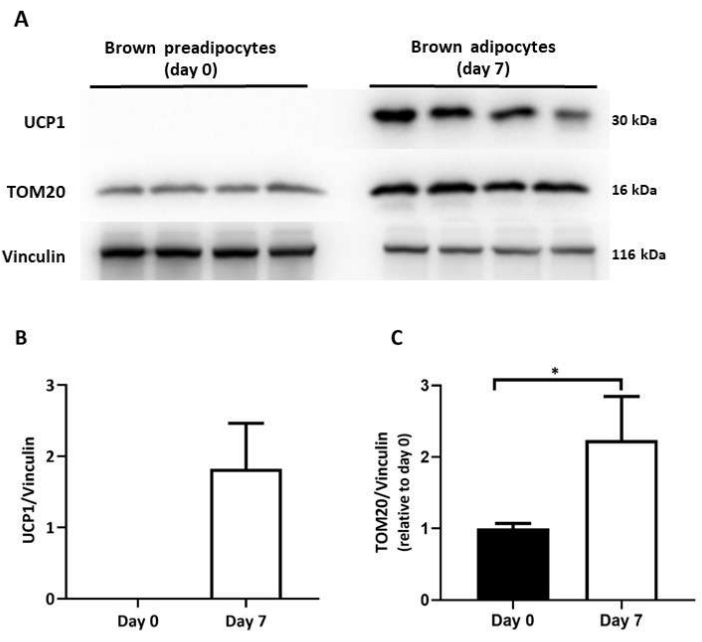
Figure 6: Protein levels of mitochondrial mass and thermogenic markers in differentiated brown adipocytes. (A) Representative immunoblot images of TOM20 and UCP1 on day 0 and day 7 of differentiation. Immunoblot quantification of (B) UCP1 and (C) TOM20 protein levels; normalized to vinculin levels (n = 4 per differentiaion day). Results expressed as mean ± SD. *p < 0.05 between undifferentiated (day 0) and differentiated brown adipocytes (day 7). The p-values were calculated using a Student's t-test. Please click here to view a larger version of this figure.
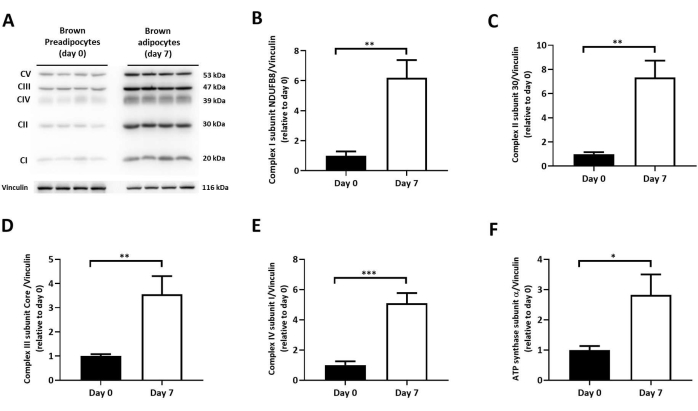
Figure 7: Protein levels of OXPHOS subunits in differentiated brown adipocytes. (A) Representative OXPHOS immunoblotting on day 0 and day 7 of differentiation. Immunoblot quantification of (B) complex I, subunit NDUFB8, (C) complex II, subunit 30, (D) complex III, subunit core, (E) complex IV, subunit I, (F) ATP synthase, subunit α; normalized to vinculin levels (n = 4 per differentiation day). Results expressed as mean ± SD. *p < 0.05, **p < 0.01, and ***p < 0.001 between undifferentiated (day 0) and differentiated brown adipocytes (day 7). The p-values were calculated using a Student's t-test. Please click here to view a larger version of this figure.
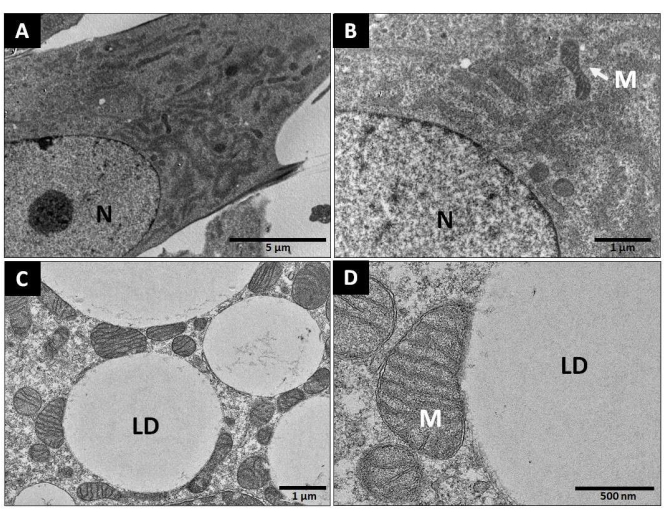
Figure 8: Mitochondrial morphology in differentiated brown adipocytes. Representative images of transmission electron microscopy on day 0 and day 7 of differentiation. (A,B) Brown preadipocytes on day 0 of differentiation; magnification: 4,200x and 16,500x, respectively. (C,D) Brown adipocytes on day 7 of differentiation; magnification: 8,500x and 28,000x, respectively. Abbreviations: LD = lipid droplet; M = mitochondria. Scale bar: (A) = 5 µm; (B,C) = 1 µm; (D) = 500 nm. Please click here to view a larger version of this figure.
Table 1: Buffer and medium preparation. Collagenase type II digestion buffer: Prepared in sterile deionized water, filtered, and aliquoted in a biosafety cabinet. For long-term storage, it is recommended to maintain it at −20 °C and thaw right before use. Culture medium: Adjusted to pH 7.2. For storage, it is recommended to maintain it at 4 °C. Induction and maintenance medium: Prepared in DMEM-F12, 10% FBS, 1% antibiotic-antimycotic, pH 7.2. Both these media must be freshly prepared just before use. Please click here to download this Table.
Supplementary Table 1: Comparison of the differentiation media used in various reported studies. Please click here to download this Table.
The present protocol is a simple and replicable two-phase differentiation procedure (Figure 2) for generating cells with the molecular and morphological characteristics of mature brown adipocytes. The surgical harvesting of the iBAT is the first critical step because tissue tearing severely limits the viability of the starting material. Tissue processing is also key because a homogeneous cell suspension that is free of debris greatly increases the amount of SVF that can be cultured. In the current study, filtration was performed twice using 100 µm and 40 µm cell strainers in contrast to other protocols that only used a 100 µm cell strainer11,12,13,14.
For the stromal vascular fraction culture, two rounds of passages were performed to multiply the number of cells available for the experiments. This standardization allowed for increasing the reproducibility of our SVF differentiations. In contrast, another published protocol12 suggested a variable number of passages in the case of a limited number of newborn mice. This practice is not recommended because the differentiation capacity changes with the number of passages. Additional critical considerations are (1) the preadipocyte culture confluence level, which must be 100% at the time of adipogenic induction, and (2) the chemical stability of each compound in the differentiation cocktail once they have been reconstituted.
The use of P0.5 newborn mice is not strictly essential for obtaining primary cultures of brown preadipocytes. However, compared with recently published protocols that used P2.5 pups13,14 or adult mice12, the surgical removal of iBAT from newborn mice is a quick and easy procedure since newborns mostly lack the layer of subcutaneous white adipose tissue that covers the iBAT in older mice. This is important because the inadequate separation of the two types of adipose tissue may lead to contamination of the iBAT SVF preparation by white adipocyte precursors. Additionally, the use of older animals increases the costs of maintaining bigger animal colonies. Finally, the efficiency of in vitro adipocyte differentiation is higher in newborns compared to adult mice, likely because of a higher abundance of preadipocytes in the SVF at early ages (data not shown).
This protocol has delivered consistent results in our laboratory over several years15. It is important to consider that many published protocols have similar qualitative compositions of the induction and maintenance media but differ greatly in the concentrations of these components and the duration of the differentiation11,12,13,14,15 (Supplementary Table 1). Indomethacin, a non-steroidal anti-inflammatory compound, promotes the differentiation of murine brown adipocytes and the expression of UCP1 and PGC1α in a dose-dependent manner31 by binding and activating PPARγ32. In other protocols, indomethacin is present in a higher concentration11,13 than in the current method, but it has also been reported absent in other differentiation media12,14. The PPARγ agonist rosiglitazone increases the degree of differentiation of adipogenic progenitor cells33. Rosiglitazone was used in both the induction and maintenance media because it results in higher mitochondrial biogenesis34 and UCP1 levels35 and promotes adipocyte browning in vitro and in vivo36,37. The addition of rosiglitazone during the induction and maintenance phase increases the lipid content and PPARγ, C/EBPα, and UCP1 expression compared to the standard adipogenic protocol38. Consistent with this previous report38, at the beginning of this research, a lower concentration of rosiglitazone (1 nM) was tested, and this was included only in the induction medium. This concentration was associated with a lower abundance of PPARγ and C/EBPα and undetectable levels of UCP1 compared with the 5 µM rosiglitazone recommended in this protocol.
Immortalized cell lines derived from human and mouse brown adipocytes have been generated and used to study brown adipocyte differentiation and function39,40,41. These offer advantages compared to work with in vitro differentiated brown adipocytes, including in terms of bioethical and practical considerations. Nonetheless, these cell lines must be strictly validated to ensure they retain the cellular phenotype of mature and functional brown adipocytes. Additionally, the use of an SVF derived from the iBAT of genetically modified mice allows for the direct assessment of the effect of these modifications on brown adipogenesis and comparison with the phenotype in living mice. The main limitations of using the SVF from mice compared with immortalized brown preadipocyte cell lines are the time required for generating the animals for processing and the higher overall costs.
In conclusion, the procedures described herein provide tools for a simple and effective protocol for in vitro brown adipocyte differentiation, which can be easily performed on a regular laboratory setup with reliable and reproducible outcomes.
The authors have nothing to disclose.
Funding was provided by FONDECYT (1181214 and 1221146) and Anillos (ACT210039) to VC and doctoral scholarships ANID 21171743 to AMF and ANID 21150665 to FS. We thank Alejandro Munizaga for help in the processing of the samples and technical advice for the transmission electron microscopy. The illustrations were produced using BioRender.
10x Tris/Glycine Buffer | BioRad | 1610734 | |
16% Paraformaldehyde Aqueous Solution | Electron Microscopy Sciences | 15710 | |
35 mm TC-treated Easy-Grip Style Cell Culture Dish | Falcon | 353001 | |
3-Isobutyl-1-methylxanthine (IBMX) | Calbiochem | 410957 | |
40% Acrylamide/Bis Solution, 37.5:1 | BioRad | 1610148 | |
6-well plate | SPL Life Science | – | |
96 well optical black w/lid cell culture sterile | Thermo Scientific | 165305 | |
AccuRuler RGB Plus Pre-stained Protein Ladder | Maestrogen | 02102-250 | |
ACK lysing buffer | Gibco | A10492-01 | |
Ammonium Persulfate | BioRad | 1610700 | |
Antibiotic-antimycotic | Gibco | 15240062 | |
Anti-mouse IgG, HRP-linked Antibody | Cell Signaling | 7076 | |
Anti-rabbit IgG, HRP-linked Antibody | Cell Signaling | 7074 | |
Blotting-grade blocker | BioRad | 170-6404 | |
BODIPY 493/503 | Invitrogen | D3922 | |
BSA | Sigma | A1470 | |
C/EBPα antibody | Cell Signaling | 2295 | |
CaCl2 | Calbiochem | 208291 | |
CD36 antibody | Invitrogen | PA1-16813 | |
Cell Strainer 100 µm, nylon | Falcon | 352360 | |
Cell Strainer 40 µm, nylon | Falcon | 352340 | |
Collagenase type II | Gibco | 17101-015 | |
Cytation 5 Cell Imaging Multimode Reader | Biotek | ||
Dexamethasone | Sigma | D4902 | |
DMEM/F-12, powder | Gibco | 12500062 | |
EMBed-812 EMBEDDING KIT (Epon) | Electron Microscopy Sciences | 14120 | |
Ethanol absolute | Merck | 100983 | |
Fetal bovine serum | Gibco | 16000-044 | |
Gelatin from cold water fish skin | Sigma | G7041 | |
Glucose | Gibco | 15023-021 | |
Glutaraldehyde 25% Aqueous Solution | Electron Microscopy Sciences | 16210 | |
Goat anti-Rabbit IgG (H+L) Cross-Adsorbed Secondary Antibody, Alexa Fluor 594 | Life Technologies | A11012 | |
Halt Phosphatase Inhibitor Cocktail 100X | Thermo Scientific | 78427 | |
Halt Protease Inhibitor Cocktail 100X | Thermo Scientific | 78429 | |
Hoechst 33258 | Invitrogen | H1398 | |
Immun-Blot PVDF Membrane | BioRad | 1620177 | |
Indomethacin | Sigma | I7378 | |
Insulin | Sigma | I3536 | |
KCl | Calbiochem | 529552 | |
KH2PO4 | Calbiochem | 529568 | |
KHCO3 | Sigma | 60339 | |
Lane Marker Reducing Sample Buffer | Thermo Scientific | 39000 | |
MgSO4 | Sigma | M2643 | |
MilliQ water sterile | – | – | |
Mitoprofile Total OXPHOS Rodent WB antibody Cocktail | Abcam | MS604 | |
NaCl | Merck | 1064041000 | |
OmniPur 10x PBS Liquid Concentrate | Calbiochem | 6505-OP | |
Osmium Tetroxide | Electron Microscopy Sciences | 19100 | |
Perilipin 1 antibody | Cell Signaling | 9349 | |
PPARγ (81B8) antibody | Cell Signaling | 2443 | |
RIPA buffer lysis | Thermo Scientific | 89901 | |
Rosiglitazone | Merck | 557366 | |
Sodium bicarbonate | Sigma | S5761 | |
Sodium Cacpdylate | Electron Microscopy Sciences | 12300 | |
Sodium Dodecyl Sulfate | BioRad | 1610301 | |
T3 | Sigma | T6397 | |
Talos F200C G2 | Thermo Scientific | ||
TEMED | BioRad | 1610800 | |
TOM20 antibody | Cell Signaling | 42406 | |
Tris Buffered Saline (TBS-10X) | Cell Signaling | 12498 | |
Triton X-100 | Sigma | 93443 | |
Trypsin-EDTA (0,25%) | Gibco | 25200056 | |
Tween 20, Molecular Biology Grade | Promega | H5152 | |
UCP1 antibody | Cell Signaling | 14670 | |
Ultracut R | Leica | ||
Uranyl Acetate | Electron Microscopy Sciences | 22400 | |
Westar Sun | Cyanagen | XLS063 | |
Westar Supernova | Cyanagen | XLS3 |
.