The use of all animals was approved by the Institutional Animal Care and Use Committee (IACUC) at Weill Cornell Medical College of Cornell University.
1. Preparation of buffers and collection plates
- Make 5% bovine serum albumin (BSA) by dissolving 5 g of BSA in 100 mL of Dulbecco's modified Eagle's medium (DMEM) without phenol red. Gently stir the BSA to dissolve (shaking is counterproductive). Once the BSA is fully dissolved, filter-sterilize the media with a 0.2 µm filter. Store the BSA media at 4 °C for up to 1 month.
- Make working concentrations of control and stimulation media. Control media: 5% BSA media with vehicle control. Stimulation media: 5% BSA media with 0.5 µM CL-316,243. Make fresh stimulation media for each experiment.
- Warm the media to be used to 37 °C. Label a 96-well plate for media collection.
2. Sample preparation
- Perform cell culture as described below. Undertake all cell work in a sterile fume hood to minimize outside contamination.
- Isolate and differentiate primary preadipocytes, as in73,74.
- Plate primary preadipocytes at a high density, such as 1 x 10⁵ cells/well in a 24-well plate in 1 mL/well culture media (15% fetal bovine serum (FBS) and 1x penicillin-streptomycin-glutamine in DMEM/F12).
- After the cells reach 100% confluency, differentiate with 5 µM dexamethasone, 0.5 mM 3-isobutyl-1-methylxanthine, 1 µg/mL insulin, and 1 µM thiazolidinedione (TZD) in culture media for 3 days. Then, change to culture media with 1 µg/mL insulin for at least 3 days to grow lipid droplets. Use 1 mL/well of media in the 24-well plate.
- Change the culture media (1 ml/well) with insulin every 2 or 3 days. The cells can be maintained in media with insulin for up to 2 weeks. Use only cultures in which differentiation rates are over 90% and are similar across groups for this assay, as reduced differentiation could be misinterpreted as a reduction in lipolytic rate.
- Culture the cells in insulin free media for 24 h prior to measuring lipolysis.
NOTE: Insulin in the media maintains lipid droplets, but also inhibits lipolysis. Incubation without insulin for 24 h allows for full lipolytic activation without a loss of lipid droplet volume. In some systems, the culture time without insulin may need to be shortened or extended.
- Wash the cells with DPBS once to remove residual serum from the culture media.
NOTE: This protocol does not include serum starvation, which can activate lipolysis. Serum starvation may be employed at the researcher's discretion.
- Isolate and differentiate primary preadipocytes, as in73,74.
- Perform ex vivo culture as described below.
- Prepare a 6-well plate, with one well for each tissue to be collected from each mouse. Place 4 mL of room temperature DMEM in each well to be used.
NOTE: BSA in the collection media is not necessary. - Prepare a 48-well plate for the lipolysis assay, with one well for each replicate. Place 400 µL of room temperature DMEM in each well to be used. Use two to four control and two to four stimulated wells per tissue per mouse.
- Euthanize the mouse by cervical dislocation under anesthesia, with a secondary method such as bilateral pneumothorax. Here, we used a 32 g, 7-month-old female C57BL/6J mouse, fed with a 45% high fat diet for 4 months.
NOTE: This protocol can also be used for males, as well as other strains, diets, and ages. - Spray with 70% ethanol and use scissors to make a small (~ 1 cm) lateral incision at the center of the abdominal skin, pull the skin apart by pinching either side with thumb and forefinger and fold the lower abdominal skin over to reveal the posterior subcutaneous depots. Locate and remove the inguinal lymph node and blunt dissect the inguinal adipose tissue immediately posterior to the inguinal lymph node using forceps.
- To collect the gonadal adipose tissue, make a lateral and a vertical incision in the peritoneum to access the peritoneal cavity. Hold the gonadal fat pad with tweezers and cut along the uterus (or epididymis for males) to remove the gonadal adipose tissue. Place the collected depots into a 6-well plate.
- Remove the tissue from well, place on a silicone mat, and cut into 5 to 7 mg chunks with scissors.
- Weigh out 25 to 30 mg (five or six chunks) for each assay well and place into a 48-well assay plate. Blot the tissue on a clean towel before weighing to remove any media. Weigh the weight boat after removal of the tissue and record the weight of any residue left behind. Wipe the weight boat clean between samples and re-tare if necessary. Use a new weight boat for each tissue.
- Once all the tissue samples have been weighed, place the 48-well assay plate in a 37 °C, 10% CO2 incubator for 15 min.
- Prepare a 6-well plate, with one well for each tissue to be collected from each mouse. Place 4 mL of room temperature DMEM in each well to be used.
3. Lipolysis assay
- Perform media collection. Undertake transfer of the media and subsequent sample collection in a sterile fume hood to minimize potential contamination from outside sources.
- At t = 0, remove the media and add 400 µL per well of control or stimulation media, and place assay the plate into a 37 °C, 10% CO2 incubator. For ex vivo tissue culture, carefully remove media using a pipette; suction should never be used.
NOTE: Alternatively, prepare a second plate with control and stimulation media, and transfer the tissues. - At t = 1, 2, 3 and 4 h, collect 200 µL of media, replace with 200 µL of the appropriate control or stimulation media, and return the assay plate to the incubator. Store the collection plate at 4 °C. To determine the FFA buffering capacity of the BSA media, use an additional collection at 24 h.
NOTE: The experiments can be stopped here, and the collected media can be stored at -20 °C.
- At t = 0, remove the media and add 400 µL per well of control or stimulation media, and place assay the plate into a 37 °C, 10% CO2 incubator. For ex vivo tissue culture, carefully remove media using a pipette; suction should never be used.
4. FFA colorimetric assay
- Warm the reagents to room temperature and dissolve one bottle of color reagent A with one bottle of solvent A, and one bottle of color reagent B with one bottle of solvent B. From the date of reconstitution, these reagents are best used within 1 week. Discard 1 month after reconstitution.
- Thaw and mix the samples.
- Create an FFA standard curve. The standard solution is 1 mM. Use the following volume with the reagents for the standard curve: 25 µL, 20 µL, 15 µL, 10 µL, 10 µL (1:2 dilution), 10 µL (1:4 dilution), 10 µL (1:8 dilution), and 10 µL water for maximal range. For low FFA levels, 10 µL of 1 mM, 0.8 mM, 0.6 mM, 0.4 mM, 0.2 mM, 0.1 mM, and 0.05 mM standard may be more applicable.
- Pipette standards and samples into a 96-well assay plate. The recommended sample volume is 10 µL. Include three wells with the same volume of BSA media as the samples for background correction.
NOTE: If sample concentrations fall outside the range of the standard curve, repeat the assay, adjusting the sample volume to 2-25 µL. - Add 150 µL of reagent A to each well and mix. Avoid generating bubbles. Pop any bubbles with a fine gauge needle. Incubate the assay plate at 37 °C for 5 min.
- Read the absorbance of the plate at 550 nm and 660 nm reference (Reading A).
- Add 75 µL of reagent B to each well and mix. Avoid generating bubbles. Pop any bubbles with a fine gauge needle. Incubate the assay plate at 37 °C for 5 min.
- Read the absorbance of the plate again at 550 nm and 660 nm reference (Reading B).
5. Glycerol colorimetric assay
- Reconstitute the free glycerol reagent with 36 mL of ultrapure water and acclimatize to room temperature. These reagents are best used within a few weeks. Discard 2 months after reconstitution.
- Thaw and mix the samples.
- Create a glycerol standard curve by making a seven point, 2-fold serial dilution of the glycerol standard solution and a water blank.
NOTE: The standard curve is relatively linear up to 25 µL of 2.8 mM glycerol, but not linear at higher concentrations. - Pipette 25 µL each of standard and samples into the 96-well assay plate. Include three wells with the BSA media for background correction.
- Add 175 µL of free glycerol reagent to each well and mix. Avoid generating bubbles. Pop any bubbles with a fine gauge needle. Incubate the assay plate at 37 °C for 5 min.
- Read the absorbance of the plate at 540 nm.
6. Calculation of lipolytic rate
- Start with optical density (OD) values. For glycerol, use A540 OD values directly. Calculate the OD of the FFA assay according to the following formula:
OD = (Reading B: A550 – A660) – (Reading A: A550 – A660) - Use the standard curve to calculate the FFA and glycerol levels in the collected samples. Plot the standard OD values on the y-axis, and on the x-axis, use standard concentrations relative to the sample volume (i.e., the concentration of the wells with 20 µL of 1 mM FFA standard on a plate with 10 µL samples is equal to 2 mM). Fit a linear trendline:
y = mx + b - Visually inspect the standard curve and remove any points outside the linear range of the assay. Calculate sample concentrations using the equation:
Sample concentration: x = (OD – b) ÷ m - Adjust and re-assay samples falling outside the linear assay range. To get the final sample concentration, subtract the concentration of the background wells containing only BSA media from the concentration of the samples.
- Calculate the moles of FFA and glycerol produced by each sample at each time point, according to the formula:
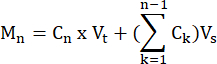
where Cn = concentration at time t = n; Vt = total volume in the well; Vs = sample collection volume; and Mn = moles produced at time t = n (when concentrations are in mM and volumes are in mL the output is µMol).
For examples, at various time points:
M1 = C1 × Vt
M4 = C4 × Vt + (C1 + C2+ C3)Vs
or
M4 = C4 × Vt + C3 × Vs + C2 × Vs + C1 ×Vs - Normalize to tissue weight by dividing by the tissue weight for each sample in grams to obtain units of µmol/g. For cultured cells, values are presented as µmol/well. Ensure that the cell number and differentiation efficiency are comparable from well to well.
NOTE: Differences in proliferation or differentiation efficiency will complicate the interpretation of results and require another method of normalization (e.g., normalization to protein; see discussion). - Calculate the slope of the µmol/g produced (y-axis) versus time (x-axis) for each sample individually.
- In a spreadsheet, this can be done using the =SLOPE(known_ys,known_xs) function. In a new cell, type "=SLOPE" (then use the cursor to highlight the sample glycerol or FFA values in µmol/g, then to highlight the corresponding time values).
- Verify the linearity of the data. R2 values are a quick way to determine linearity of the samples. In a spreadsheet, this can be done using the =RSQ(known_ys,known_xs) function, in the same manner as described in step 6.7.1, but the initial input is =RSQ. Ensure that the R2 values are > 0.98; lower values indicate deviation from linearity. This can result from a measurement/sampling error or loss of linearity.
- Another way to test linearity is to perform a linear regression for each sample and plot the residuals. In a statistical analysis software, generate an XY table with a single Y value for each time point. Select Analyze > Simple linear regression and select the box for Residual Plot before hitting OK. The residual plot will appear as a new graph.
- Use the FFA and glycerol production rate (i.e., slope [(µmol/g/h]) for each sample as an individual data point to perform statistical analysis, and plot values if different lipolytic conditions are being compared. If lipolytic rates are being compared across genotypes, use two or three samples per animal as technical replicates, and use the average for one data point per animal, so that the sample size is equal to the number of animals.
We measured the basal and stimulated lipolytic rate of in vitro differentiated adipocytes. Primary preadipocytes from inguinal white adipose tissue were differentiated into adipocytes by the treatment of confluent cells with 5 µM dexamethasone, 0.5 mM IBMX, 1 µg/mL insulin, and 1 µM troglitazone for 4 days, followed by an additional 3 day treatment with 1 µg/mL insulin. Cells were incubated in media without insulin for 24 h prior to the lipolysis assay. At time = 0h, the cells were washed once with PBS, then phenol red-free DMEM with 2% BSA, containing either 10 µM CL-316,243 or vehicle control, was added to each well of the 12-well plate. At time = 1 h, 2 h, 3 h, and 4 h, 50% of the media was collected and replaced with 2% BSA in phenol red-free DMEM. FFA and glycerol levels were measured in the collected media and the moles of FFA, and glycerol secreted into media was calculated at each time point (Figure 2A,B). FFA and glycerol production were linear for the 4 h assay, with R2 values of 0.98 and above. The 4 h FFA levels were slightly low, indicating that lipolytic rates may have been slowing; however, analysis with and without the 4 h time point did not have a significant impact on the calculated lipolytic rate. Stimulated lipolytic rates were significantly higher than basal rates (Figure 2C). Lipolytic stimulation resulted in the production of FFA and glycerol at a near 3:1 molar ratio in all collected samples, as would be expected from complete triglyceride lipolysis without significant reuptake or retention (Figure 2D). However, in the unstimulated cells, the ratio was closer to 1, suggesting a non-lipolytic source of glycerol48,49,50.
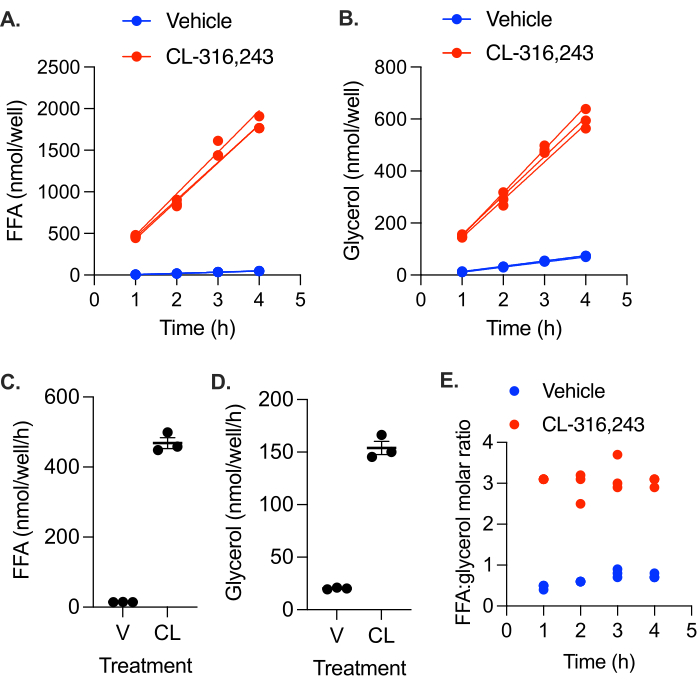
Figure 2: Lipolytic rate in in vitro differentiated primary adipocytes. Preadipocytes were differentiated in a 12-well plate. Insulin was removed from the media 24 h prior to the lipolytic assay. At time = 0 h, the cells were stimulated with 10 µM CL-316,243 (CL) or treated with vehicle (V) control media. The nmol of (A) FFA and (B) glycerol produced in each well by each time point were plotted over time, and a linear regression line was fitted for each individual well. (C) Rate of FFA production. (D) Rate of glycerol production. Data are represented as mean ± SEM. (E) Molar ratio of FFA:glycerol in the collected media at each time point. Statistical analysis in (C) and (D) was performed using a student's t-test; the effect of CL was significant at α = 0.05. Please click here to view a larger version of this figure.
In cell culture, the monolayer of cells is in direct contact with the media, while in tissues cultured ex vivo, cells in the center are not in contact with the media. Thus, in ex vivo cultures, FFAs are more likely to be retained within the tissue. Larger chunks of tissue, which have a lower surface area to volume ratio, exhibit higher rates of FFA retention, resulting in lower FFA:glycerol molar ratios (Figure 3A). With decreasing tissue chunk size, the molar ratio of FFA:glycerol released approaches 3:1 (Figure 3A). However, tissue chunks can also be too small. In addition to the challenge of working with tiny pieces of adipose tissue, 1-2 mg chunks of adipose tissue exhibit reduced lipolytic rates, suggesting a reduced viability and functionality of the tissue (Figure 3B,C). While it is tedious and time consuming to cut adipose tissue into chunks of consistent size and shape, it is required to obtain comparable and reliable results. We recommend 5 to 10 mg chunks of adipose tissue, but consistency is most important. Lipolytic rates can still be reproducibly measured in larger tissue chunks, however, it is important to consider the feedback inhibition of lipolysis by FFAs63,64,65,66,67.
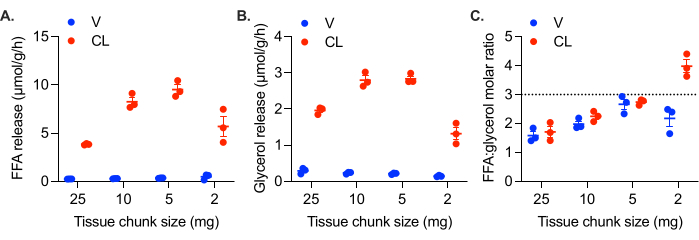
Figure 3: Effect of tissue chunk size on FFA release and lipolytic rate. Gonadal white adipose tissue from a high fat diet fed female C57Bl/6J mouse was collected and cut into chunks of varying size. All wells contained 25-30 mg of adipose tissue in total; for the 25 mg wells, this was one chunk of tissue; 10 mg wells had three chunks of tissue each of ~ 10 mg, the 5 mg wells contained five or six chunks of tissue, and the 2 mg wells contained 13-16 chunks. At time = 0 h, lipolysis was stimulated with 0.5 µM CL-316,243 (CL), or the control wells were treated with vehicle (V). The calculated lipolytic rate from samples collected after 1 h, 2 h, and 3 h is plotted for (A) FFAs and (B) glycerol. (C) Molar ratio of FFA:glycerol production in each well. Data are represented as mean ± SEM. Statistical analysis in (A) and (B) was performed using a two-way ANOVA with a Holm-Sidak post-hoc analysis, α = 0.05. The effect of CL was significant in all samples. Within the CL treated samples, the rates of FFA and glycerol production were significantly different in all pair-wise comparisons, except the 10 mg versus 5 mg samples. Please click here to view a larger version of this figure.
The negative impact of FFA retention can be observed in the 25 mg tissue chunks, which exhibit lower rates of both FFA and glycerol production upon stimulation (Figure 3B,C). This feedback inhibition is also apparent when the FFA binding capacity of the media is too low (i.e., there is not enough BSA in the media). When the BSA in the media was reduced to 0.5%, FFA release was reduced more than fourfold, and glycerol release reduced nearly twofold (Figure 4A,B). As an easy rule of thumb, micromolar levels of FFA in the media should not approach the percentage of BSA in the media (i.e., FFA levels should remain below 5 mM FFA in 5% BSA media and 0.5 mM in 0.5% BSA media [at this level there is 20:3 molar ratio of FFA:BSA]). To test the maximal BSA buffering capacity of the preparation of BSA media, collect media from a 24 h stimulated sample, and measure the concentration of FFA (the concentration will be high, so a lower sample volume or sample dilution is recommended). The FFA accumulation in the 5% BSA media after 24 h stimulation was about 5 mM, while the FFA content of the 0.5% BSA media was only 0.6 mM (Figure 4C). Looking at the FFA concentration in the collected media, it can be seen that the 0.5% BSA media FFA binding capacity is overburdened (Figure 4D). While FFA levels in the 5% BSA media are much higher, they do not exceed the buffering capacity of the media (Figure 4D). Ideally, the FFA concentration in the media should remain below a 3:1 FFA:BSA molar ratio (i.e., 2.3 mM FFA in 5% [0.75 mM] BSA).
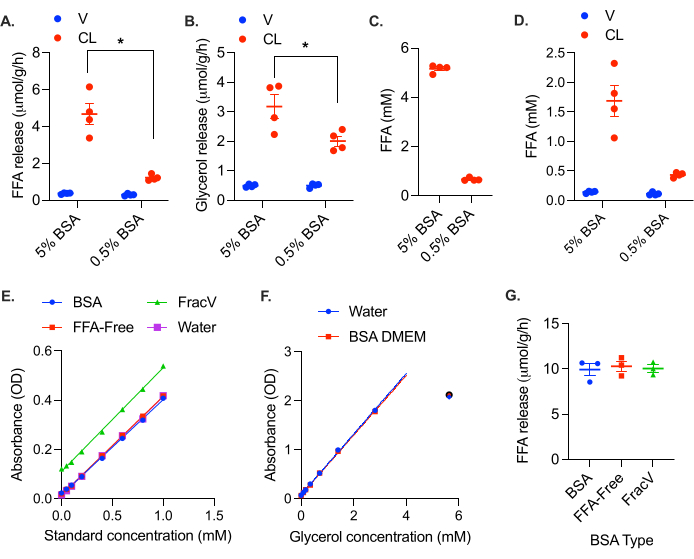
Figure 4: Insufficient BSA levels result in reduced apparent lipolytic rates. Gonadal white adipose tissue from a high fat diet fed female C57Bl/6J mouse was collected and cut into ~5 mg chunks. A total of 20-30 mg of adipose tissue was placed in each well. At time = 0 h, the lipolysis was stimulated with 0.5 µM CL-316,243 (CL), or the control wells were treated with vehicle (V) in either 5% BSA media or media containing only 0.5% BSA. The calculated lipolytic rate from the samples collected after 4 h is plotted for (A) FFAs and (B) glycerol. The effect of CL was significant in all samples. Within the CL-treated samples, the rates of both FFA and glycerol production were significantly different between the 5% and 0.5% BSA media conditions. (C) FFA levels in the media from the stimulated wells after 24 h. (D) FFA levels in the samples collected at 4 h. (E) FFA standard curves with and without various preparations of 5% BSA in DMEM. Optical density calculated as (Reading B: A550 – A660) – (Reading A: A550 – A660). (F) Glycerol standard curve with and without BSA. Optical density is absorbant at 540 nm (A540). OD values at 5.6 mM were not linear and thus not included in the standard curve. (G) Rate of FFA release from female gonadal adipose tissue using different types of BSA in the assay media. Data are represented as mean ± SEM. Statistical analysis in (A) and (B) was performed using a two-way ANOVA with a Holm-Sidak post hoc analysis, * p value < 0.05. Please click here to view a larger version of this figure.
It is important to point out that some preparations of BSA contain FFAs. Each lot of BSA should be tested to ensure that the FFA content is negligible (note that some BSA preparations are marketed as FFA free). While not specifically marketed as FFA-free, the BSA used here does not contain detectable FFAs. We tested the assay media containing FFA-free BSA (Equitech Bio Inc, BAH66), the BSA used in experiments here (Sigma, A9418), and a cruder (less expensive) fraction V BSA (Sigma, 810531). The FFA-free BSA and A9418 BSA both did not produce any background signal or change the standard curve slope or intercept; the standard curves were superimposable (Figure 4E). No impact of the BSA DMEM was observed on the glycerol standard curve either (Figure 4F). The fraction V BSA, on the other hand, did produce a background signal in the FFA assay, which equated to an FFA concentration of 0.3 mM (Figure 4E). This background shifted the standard curve up, but did not significantly impact the slope, indicating that background subtraction is sufficient. We also performed a stimulated lipolysis experiment using these three different types of BSA, and found that after background subtraction, the calculated rate of lipolysis did not differ between BSA formulations (Figure 4F). However, this is often not the case, especially with less pure BSA preparations which can easily contain insulin or other components that impact the rate of lipolysis. Each lot of BSA should be tested and validated, and used consistently (i.e., samples assayed with different lots of BSA are not comparable). A full standard curve with the addition of BSA and DMEM should be performed when validating each lot of BSA to ensure that it does not contain anything that interferes with the enzymes in the colorimetric assays.
Taking serial samples and replacing the volume with fresh media helps to lower the FFA load in the media throughout the experiment. We measured lipolytic rates in the gonadal adipose tissue from a female mouse fed a high fat diet for 4 months. In this experiment, 5-8 mg tissue chunks (total weight of 25-30 mg) were incubated in 200 µL of 5% BSA media, and 100 µL was collected and replaced at 1 h, 2 h, 3 h, and 4 h. FFA and glycerol levels in the collected media were measured. At 3 h, the FFA levels in the media had reached the danger zone of 2.3 mM (Figure 5A). Feedback inhibition of lipolysis was suggested by the lack of increase in media FFA and glycerol levels at 4 h (Figure 5A,B). After calculating the µmol of FFA and glycerol released at each time point and fitting a linear curve, it is apparent that the lipolytic rate starts to decline at 4 h in the stimulated samples, with R2 values as low as 0.976 for FFA and 0.983 for glycerol (Figure 5C,D). Looking at the residual plot, it is clear that the 4 h values are below the linear trend (i.e., the residuals are negative) (Figure 5E,F). Exclusion of the 4 h time point increased the R2 values to 0.997 and 0.998 and above for FFA and glycerol, respectively. Inclusion of the 4 h time point causes a small but significant decrease in the calculated FFA and glycerol release rates (Figure 5G,H).
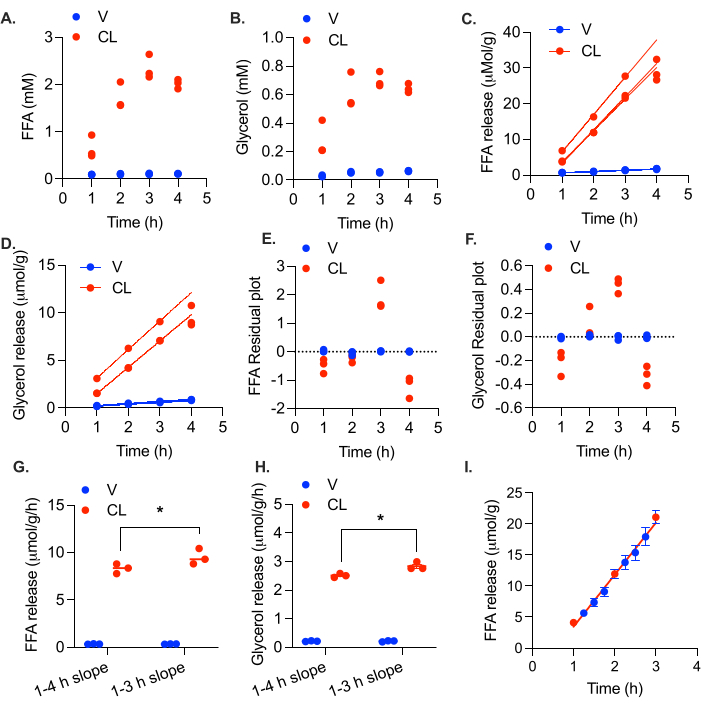
Figure 5: Calculation of linear lipolytic rate in ex vivo adipose tissue. Gonadal white adipose tissue from a high fat diet fed female C57Bl/6J mouse was collected and cut into ~5 mg chunks. A total of 20-30 mg of adipose tissue was placed in each well. At time = 0 h, the lipolysis was stimulated with 0.5 µM CL-316,243 (CL), or the control wells were treated with vehicle (V). Media collections were performed at 1 h, 2 h, 3 h, and 4 h. (A) FFA and (B) glycerol levels in the media. (C) FFA and (D) glycerol production plotted over time. Residual plates for (E) FFA and (F) glycerol production over time. Rate of release of (G) FFA and (H) glycerol, calculated with and without the 4 h time point. (I) FFA release in female gonadal adipose tissue. Nearly 50% of media changed at 1 h, 2 h, and 3 h. Between hours, the 15 min time points collected 2.75% of the media without replacement. Data are represented as mean ± SEM. Statistical analysis in (G) and (H) was performed using a two-way ANOVA with a Holm-Sidak post-hoc analysis, * p value < 0.05. The effect of CL was significant in all samples (p value < 0.05). Within the CL treated samples, the rates of both FFA and glycerol production were significantly different between calculations with and without the 4 h time point. Please click here to view a larger version of this figure.
Unlike previous protocols, this protocol utilizes multiple time points to determine the lipolytic rate, thereby reducing measurement error and providing internal validation that the linear rate of lipolysis is being measured. To maintain lipolysis in the linear phase at each collection point, 50% of the media is collected and replaced. Since linearity is critical, we wanted to ensure that the addition of fresh media was not causing a burst of lipolysis at each addition. To validate the linearity between time points, we took a very small sample (2.75%) every 15 min between the hourly time points from 1 h to 3 h, without replacement. At 1 h, 2 h, and 3 h, the normal 50% sample collection was made and replaced. The rate of FFA release was linear between the usual time points, indicating that there was not a burst of lipolysis with each addition of fresh media (Figure 5I).