Science Education
>

Quantification, Viability Assessment, and Visualization Strategies for Acinetobacter Biofilms

Instructor Prep
concepts
Student Protocol
JoVE Journal
Biology
A subscription to JoVE is required to view this content.  Sign in or start your free trial.
JoVE Journal Biology
Quantification, Viability Assessment, and Visualization Strategies for Acinetobacter Biofilms

1. Preparation of bacterial inoculum

  1. Remove the glycerol stock vial stored at -80 °C.
  2. Remove the bacterial strain (2-10 µL) from the vial using a sterile pipette tip.
    NOTE: Acinetobacter strains, A. bouvetii (13-1-1), A. junii (13-1-2), A. pittii (13-2-5), A. baumannii (13-2-9), A. radioresistens (20-1), and A. ursingii (24-1) are used in this protocol.
  3. Inoculate a commercially available blood agar plate (tryptic soy agar supplemented with 5% sheep blood, see Table of Materials) with the bacteria.
    NOTE: Other media, such as nutrient agar or MacConkey agar, can also be used.
  4. Streak the agar surface using a sterile loop with intermittent flaming to thin it out.
  5. Place the agar plate upside down in an incubator and incubate at 30 °C overnight for 20-24 h.
  6. Pick a single colony of the bacterial culture with a sterile needle and inoculate 5 mL sterile brain heart infusion broth (BHI, see Table of Materials) with the culture.
  7. Incubate the inoculated broth in a shaking incubator at 30 °C overnight for 20-24 h at around 150 rpm.
  8. Transfer 1 mL of the overnight culture to a sterile microcentrifuge tube and centrifuge the overnight culture at 6,000 × g for 10 min at room temperature (RT).
  9. Remove the supernatant with a pipette.
  10. Using a vortex, resuspend the pellet in 1 mL sterile phosphate-buffered saline (PBS).
  11. Centrifuge at 6,000 × g for 10 min at RT and remove the supernatant.
  12. Resuspend the pellet in sterile ten-fold diluted BHI using vortex to an optical density of around 0.1 at 600 nm.
    NOTE: The optical density of around 0.1 is equivalent to approximately 107 CFU/mL.

2. Biofilm quantification using crystal violet

  1. Add 200 µL inoculum to each well of a sterile polystyrene 96-well plate (see Table of Materials) and add 200 µL deionized water to each of the outermost wells to prevent the inner wells from drying out15.
  2. Add 200 µL ten-fold diluted BHI to each well of the same plate as a negative control.
  3. Incubate the plate at 25 °C for 24 h.
  4. Remove the supernatant with a pipette.
    NOTE: Multichannel pipette is often more convenient for multiple samples.
  5. Carefully add 300 µL PBS to each well and remove the supernatant with a pipette.
    ​NOTE: Multichannel pipette is often more convenient for multiple samples.
  6. Repeat step 2.5 two more times.
  7. Add 200 µL crystal violet solution (1%) (see Table of Materials) to each well and incubate at RT for 30 min.
  8. Repeat steps 2.4-2.6.
  9. Add 200 µL of absolute ethanol to each well and incubate for 15 min at RT. Mix thoroughly by pipetting up and down several times.
  10. Transfer 100 µL elution from each well to a new 96-well plate.
  11. Measure the absorbance at 595 nm using a microplate reader (see Table of Materials).
  12. When the absorbance exceeds 2.0, make a proper dilution of the sample to the absorbance below 2.0 in absolute ethanol and measure it as in step 2.11. Then, calculate the absorbance of the sample (final value) by multiplying the observed value by the dilution factor.
  13. Calculate the true absorbance of the samples by subtracting the average value of the negative control from the value of each well of the test samples on the same well plate.

3. Biofilm viability count

  1. Add 1 mL inoculum (step 1) to each well of a sterile polystyrene 12-well plate15. Incubate the plate at 25 °C for 24 h. Remove the supernatant with a pipette.
  2. Carefully add 1.5 mL sterile PBS to each well and remove the supernatant with a pipette. Add 1 mL sterile PBS to each well.
  3. Scrape off the bottom and wall surfaces of the well using fitted cell scrapers.
  4. Transfer the harvested cell suspension to a sterile plastic tube (10-1) containing 9 mL saline (0.85% NaCl) and 10-20 glass beads (see Table of Materials).
    NOTE: To collect any residual biofilm debris left on the bottom surface of the well, it can be resuspended and transferred by pipette using saline from the 10-1 tube.
  5. Vortex the 10-1 tube for 60 s at a maximum speed.
  6. Make a 10-fold serial dilution by transferring 1 mL to the next sterile tube (10-2) containing 9 mL saline (0.85 % NaCl) up to 10-7.
  7. Spread 100 µL from each dilution on Acinetobacter agar (see Table of Materials) and incubate the agar plates at 30 °C for 24-42 h.
  8. Count the number of the typical red colonies on each plate manually in the range between 10 and 250.
  9. Calculate the number of viable cells in the biofilm of each well by using the equation below:
    Viable cells = Number of colonies × Dilution factors × 10

4. Biofilm visualization using confocal laser scanning microscopy (CLSM)

  1. Add 200 µL inoculum to each well of a sterile 96-well plate intended for microscopic analysis.
  2. Incubate the plate at 25 °C for 24 h.
  3. Remove the supernatant with a pipette.
  4. Carefully add 300 µL filter-sterilized deionized water to each well and remove the supernatant with a pipette.
  5. Repeat step 4.4.
  6. Prepare the mixture of SYTO 9 and propidium iodide (see Table of Materials) diluted in filter-sterilized deionized water to a final concentration of 10 µM and 60 µM, respectively.
  7. Add the mixture to each well at 200 µL and incubate the plate for 20-30 min at RT in the dark.
  8. Repeat steps 4.3-4.4
  9. Visualize the bottom-surface attached biofilms using CLSM with the excitation wavelength of 488 nm and 561 nm and the emission wavelength range of 499-535 nm and 568-712 nm, respectively.

Quantification, Viability Assessment, and Visualization Strategies for Acinetobacter Biofilms

Learning Objectives

Following the protocol, the biofilms of Acinetobacter isolates, originally isolated from kitchen surfaces, were formed on a polystyrene 96-well plate, stained with crystal violet, and the dyes were solubilized in ethanol and measured for biofilm mass (Figure 1). The number of biofilms greatly varied depending on the strains ranging from OD 0.04 to 1.69 (Figure 1). Based on the criteria established by Stepanović et al.16, all of the isolates except for A. bouvetii formed biofilms. A. radioresistens formed a weak biofilm. A. junii and A. baumannii formed moderate biofilms, while A. pittii and A. ursingii formed strong biofilms.

To count viable cells in biofilms, the biofilms were scraped off using cell scrapers, vortexed at high speed, diluted, and spread on the Acinetobacter selective plates. After incubation, the number of colonies was counted to estimate the number of biofilm cells (Figure 2). All the isolates except for A. bouvetii had cells equivalent to 7-8 Log CFU in their biofilms. Consistent with the biofilm non-forming property shown by crystal violet assay, A. bouvetii had a much lower level of cell number at 4.4 Log CFU.

The bottom-surface attached biofilms were visualized using CLSM (Figure 3). A substantial amount of biofilm was found in A. junii, A. baumannii, and A. ursingii with distinct biofilm morphologies. While A. pittii was a strong biofilm former in crystal violet assay, it did not form much biofilm on the bottom surface.

Figure 1
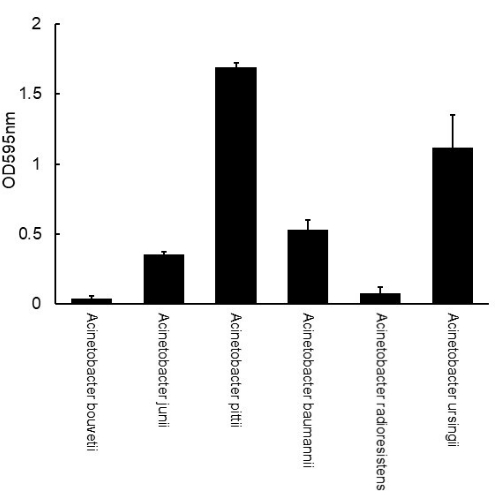
Figure 1: Measurement of biofilm mass of Acinetobacter formed on a polystyrene 96-well plate using crystal violet assay. The error bars represent the standard deviation from triplicate. Please click here to view a larger version of this figure.

Figure 2
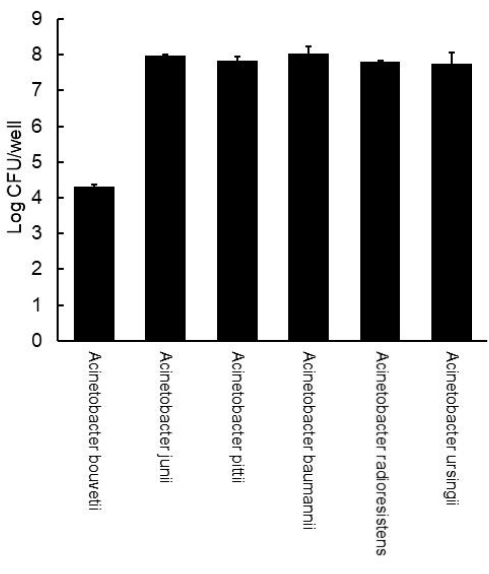
Figure 2: Viable counts of Acinetobacter biofilms formed on a polystyrene 12-well plate. The error bars represent the standard deviation from the duplicate. Please click here to view a larger version of this figure.

Figure 3
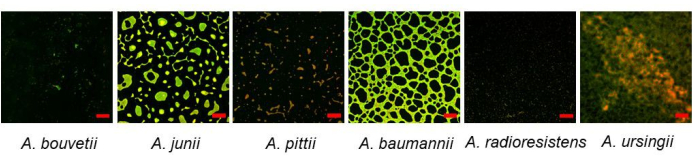
Figure 3: Bottom-surface attached Acinetobacter biofilms formed on a 96-well plate visualized by CLSM using SYTO 9 and propidium iodide dyes. Scale bars: 50 µm. Please click here to view a larger version of this figure.

List of Materials

96-well cell culture plate SPL 30096 Polystyrene 96-well plate
BHI (Brain Heart Infusion) broth Merck KGaA 1.10493.0500
Blood Agar Base Plate KisanBio MB-B1005-P50 Growth media for Acinetobacter
CHROMagar Acinetobacter CHROMagar AC092 Selective plate for Acinetobacter
Crystal violet solution Sigma-Aldrich V5265
Filmtracer LIVE/DEAD biofilm viability kit Invitrogen L10316 SYTO9 and propidium iodide
Microplate reader Tecan Infinite M200 PRO NanoQuant Biofilm measurement
RBC Glass Plating Beads RBC RG001 Glass beads
μ-Plate 96 Well Black ibidi 89621 Microplate intended for CLSM

Lab Prep

Acinetobacter causes nosocomial infections and its biofilm formation can contribute to the survival on dry surfaces such as hospital environments. Thus, biofilm quantification and visualization are important methods to assess the potential of Acinetobacter strains to cause nosocomial infections. The biofilms forming on the surface of the microplate can be quantified in terms of volume and cell numbers. Biofilm volumes can be quantified by staining using crystal violet, washing, destaining using ethanol, then measuring the solubilized dye using a microplate reader. To quantify the number of cells embedded in the biofilms, the biofilms are scrapped off using cell scrapers, harvested in the saline, vigorously agitated in the presence of glass beads, and spread on Acinetobacter agar. Then, the plates are incubated at 30 °C for 24-42 h. After incubation, the red colonies are enumerated to estimate the number of cells in biofilms. This viable count method can also be useful for counting Acinetobacter cells in mixed-species biofilms. Acinetobacter biofilms can be visualized using fluorescent dyes. A commercially available microplate designed for microscopic analysis is employed to form biofilms. Then, the bottom-surface attached biofilms are stained with SYTO9 and propidium iodide dyes, washed, then visualized with confocal laser scanning microscopy.

Acinetobacter causes nosocomial infections and its biofilm formation can contribute to the survival on dry surfaces such as hospital environments. Thus, biofilm quantification and visualization are important methods to assess the potential of Acinetobacter strains to cause nosocomial infections. The biofilms forming on the surface of the microplate can be quantified in terms of volume and cell numbers. Biofilm volumes can be quantified by staining using crystal violet, washing, destaining using ethanol, then measuring the solubilized dye using a microplate reader. To quantify the number of cells embedded in the biofilms, the biofilms are scrapped off using cell scrapers, harvested in the saline, vigorously agitated in the presence of glass beads, and spread on Acinetobacter agar. Then, the plates are incubated at 30 °C for 24-42 h. After incubation, the red colonies are enumerated to estimate the number of cells in biofilms. This viable count method can also be useful for counting Acinetobacter cells in mixed-species biofilms. Acinetobacter biofilms can be visualized using fluorescent dyes. A commercially available microplate designed for microscopic analysis is employed to form biofilms. Then, the bottom-surface attached biofilms are stained with SYTO9 and propidium iodide dyes, washed, then visualized with confocal laser scanning microscopy.

Procedure

Acinetobacter causes nosocomial infections and its biofilm formation can contribute to the survival on dry surfaces such as hospital environments. Thus, biofilm quantification and visualization are important methods to assess the potential of Acinetobacter strains to cause nosocomial infections. The biofilms forming on the surface of the microplate can be quantified in terms of volume and cell numbers. Biofilm volumes can be quantified by staining using crystal violet, washing, destaining using ethanol, then measuring the solubilized dye using a microplate reader. To quantify the number of cells embedded in the biofilms, the biofilms are scrapped off using cell scrapers, harvested in the saline, vigorously agitated in the presence of glass beads, and spread on Acinetobacter agar. Then, the plates are incubated at 30 °C for 24-42 h. After incubation, the red colonies are enumerated to estimate the number of cells in biofilms. This viable count method can also be useful for counting Acinetobacter cells in mixed-species biofilms. Acinetobacter biofilms can be visualized using fluorescent dyes. A commercially available microplate designed for microscopic analysis is employed to form biofilms. Then, the bottom-surface attached biofilms are stained with SYTO9 and propidium iodide dyes, washed, then visualized with confocal laser scanning microscopy.

Tags