Assessing mitophagy via the dye-based MtPhagy approach
This dye-based approach was optimized to analyze mitophagy flux within primary mouse β-cells without the need for a genetic reporter, using Fluozin-3-AM, TMRE, and MtPhagy as well as DAPI to exclude dead cells. By pairing these dyes with valinomycin to induce mitophagy, this protocol outlines a dye-based method to selectively measure mitophagy flux in primary mouse β-cells18. For the data shown using this MtPhagy method, both basal and valinomycin-induced mitophagy were analyzed in islets isolated from either regular fat diet (RFD) or high fat diet (HFD, 60 kcal% Fat) fed mice to assess the effect of metabolic stress on mitophagy flux. To identify the population of interest, cells were gated using untreated RFD islets. FSC and SSC voltages were first adjusted to attain an even distribution of cells on a SSC-A vs. FSC-A plot (Figure 1A). To select for single cells, both FSC-H vs. FSC-W and SSC-H vs. SSC-W plots were used, where multiplets were excluded due to their higher width signal values compared to single cells (Figure 1B,C). Next, DAPI-negative cells were selected to exclude dead cells20 (Figure 1D). After establishing primary gates, single stained controls were utilized to establish fluorescence gates for Fluozin-3-AM, MtPhagy, and TMRE (Figure 1E–G) as well as compensation controls for multi-color fluorescence flow cytometry.
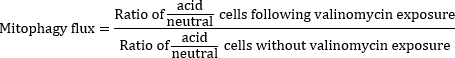
Once these primary and fluorescence gates were established, β-cells with high utilization of mitophagy were defined as the FluozinhighMtPhagyhighTMRElow population in quadrant 3 (Q3) using RFD without valinomycin exposure (Figure 1H). Using this gating strategy, basal and valinomycin-induced mitophagy levels were characterized in both RFD and HFD islets (Figure 2). To quantify mitophagy flux, basal vs. valinomycin-induced mitophagy levels were compared using the following ratio:

Using this ratio, mitophagy flux was quantified and compared in RFD vs. HFD β-cells to assess differences in mitophagy following the induction of obesity and peripheral insulin resistance. Quantification of mitophagy flux in RFD vs. HFD samples is shown in Figure 2E. This result highlights the feasibility of this assay to quantify mitophagy in β-cells using a straightforward dye-based approach. This method can also be employed in human islets, difficult-to-transfect cells, and islets isolated from complex genetic models where intercrossing to the mt-Keima transgenic model would be cumbersome.
Assessing mitophagy using the genetically encoded mt-Keima reporter
Mt-Keima is a dual excitation fluorescent protein fused with a Cox8-localization sequence that enables its targeting to the inner mitochondrial membrane. The bimodal fluorescent property of mt-Keima allows it to switch its excitation spectra from the neutral (405 nm) to acidic (561 nm) wavelength, depending on the pH of the intracellular compartment6. This enables a robust ratiometric fluorescence analysis of mitophagy, where an increase in acidic-to-neutral ratio indicates mitophagy induction. In this protocol, Fluozin-3-AM was also used to select for β-cells via flow cytometry. In these representative studies, mitophagy flux was assessed using islets isolated from mice fed a RFD diet10,11. FSC and SSC voltages were first adjusted to attain an even distribution of cells on a SSC-A vs. FSC-A plot (Figure 3A). To select for single cells, both FSC-H vs. FSC-W and SSC-H vs. SSC-W plots were used, where multiplets were excluded due to their higher width signal values compared to single cells (Figure 3B,C). The voltage and gating strategy for DAPI and Fluozin-3-AM were determined using single-stained islets (Figure 3D,E). Triangle gates for the acidic and neutral populations were then identified using the mt-Keima positive sample without valinomycin exposure (Figure 3F).
Once these primary and fluorescence gates were established, mitophagy flux was assessed using basal and valinomycin-induced changes in mt-Keima fluorescence (Figure 3F,G). To quantify mitophagy flux, basal mitophagy vs. valinomycin-induced levels were compared using the following ratio:
Using this ratio, mitophagy flux was quantified in RFD cells. Quantitation of this result is shown in Figure 3H. Importantly, these results are comparable to the results in RFD islets generated using the MtPhagy approach (Figure 3H).
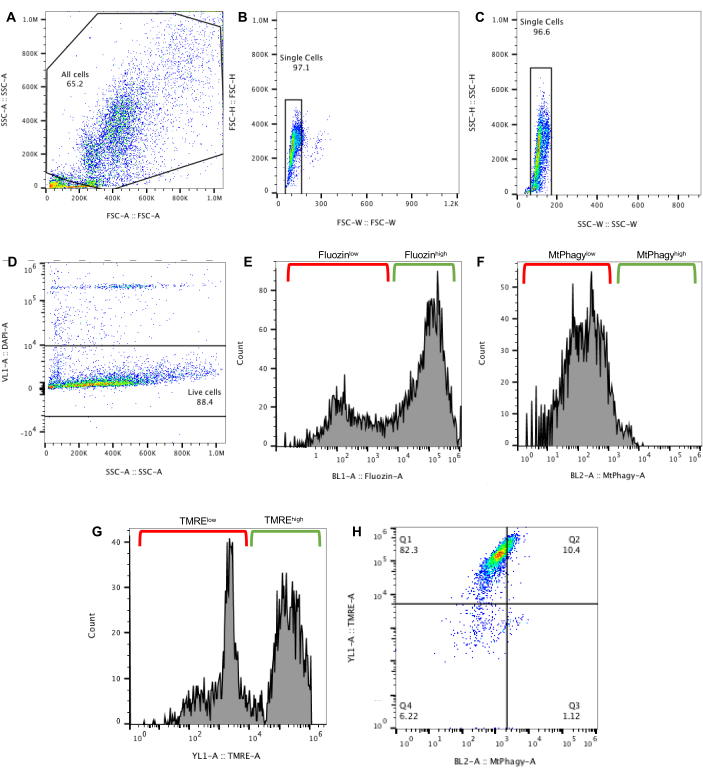
Figure 1: Gating scheme for the MtPhagy method. (A) Flow plot displaying gating scheme to select for all cells. (B) Gating to select for singlets based on FSC-H vs. FSC-W and (C) SSC-H vs. SSC-W. (D) Gating for DAPI–negative cells to exclude dead cells. (E) Gating for Fluozin-3-AMhigh cells to select for β-cells. (F) Gating scheme for MtPhagy dye to identify MtPhagyhigh and MtPhagylow cell populations. (G) Gating scheme for TMRE to identify TMREhigh and TMRElow cell populations. (H) Quadrant gating scheme established with untreated RFD islets to identify FluozinhighMtPhagyhighTMRElow cells in quadrant 3 (Q3) as β-cells undergoing mitophagy. Please click here to view a larger version of this figure.
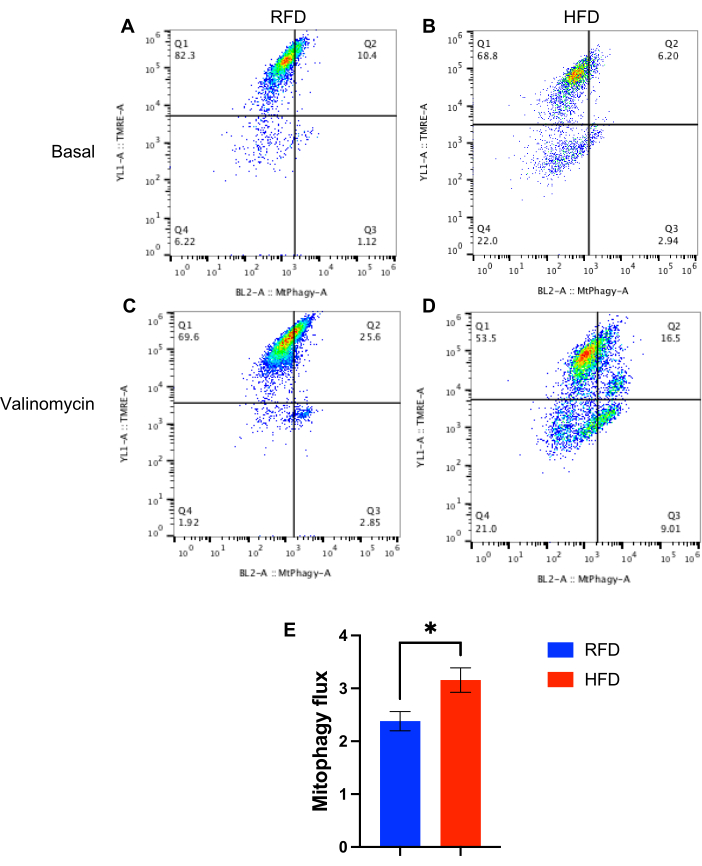
Figure 2: Assessing mitophagy flux differences in mouse β-cells following metabolic stress using the MtPhagy gating scheme. Representative flow cytometry plots of (A) untreated RFD β-cells, (B) untreated HFD β-cells, (C) valinomycin-exposed RFD β-cells, and (D) valinomycin-exposed HFD β-cells. (E) Quantification of mitophagy flux in β-cells, calculated using a ratio of the MtPhagyhighTMRElow cells exposed to valinomycin to the MtPhagyhighTMRElow cells not exposed to valinomycin, for both RFD and HFD samples. *p < 0.05 by Student's unpaired t-test. n = 3/group. Please click here to view a larger version of this figure.
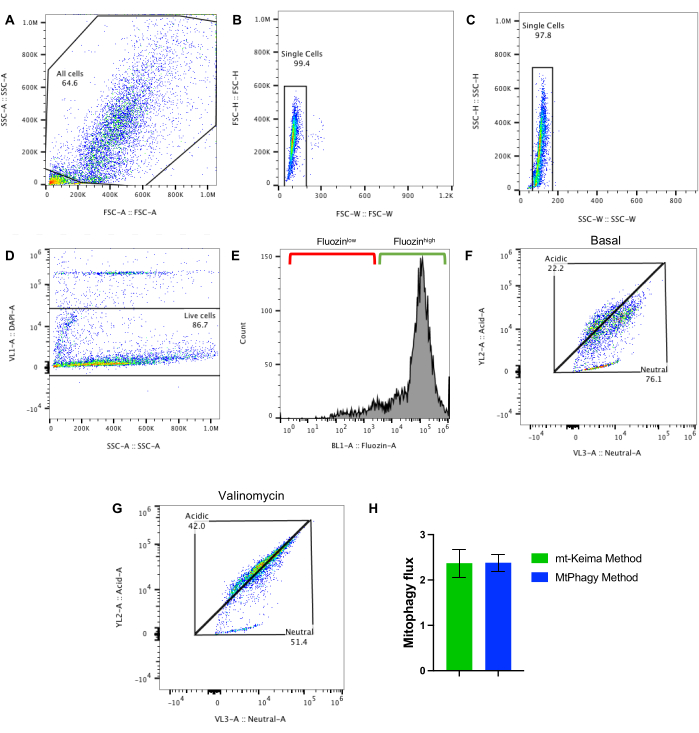
Figure 3: Gating scheme for the mt-Keima method and comparison between both methods. (A) Flow plot displaying gating scheme to select for all cells. (B) Gating to select for singlets based on FSC-H vs. FSC-W and (C) SSC-H vs. SSC-W. (D) Gating for DAPI–negative cells to exclude dead cells. (E) Gating for Fluozin-3-AMhigh cells to select for β-cells. (F) Representative flow cytometry plots of mt-Keima/+ untreated cells and (G) mt-Keima/+ valinomycin-exposed cells. (H) Quantification of mitophagy flux in β-cells from RFD-fed mice, calculated using a ratio of the acidic/neutral cells exposed to valinomycin to ratio of the acidic/neutral cells not exposed to valinomycin using the mt-Keima method and compared to the MtPhagy method (data for MtPhagy protocol originally shown in Figure 2E). n = 3/group. Please click here to view a larger version of this figure.