Science Education
>

Understanding the Effects of Non-Invasive Transauricular Vagus Nerve Stimulation on EEG and HRV

Instructor Prep
concepts
Student Protocol
JoVE Journal
Neuroscience
A subscription to JoVE is required to view this content.  Sign in or start your free trial.
JoVE Journal Neuroscience
Understanding the Effects of Non-Invasive Transauricular Vagus Nerve Stimulation on EEG and HRV

All study procedures were performed at the Spaulding Neuromodulation Center/Spaulding Cambridge Hospital. Ethical approval for this protocol was obtained from Mass General Brigham IRB (Number Protocol #:2022P003200). Informed consent was obtained from all subjects using the encrypted Research Electronic Data Capture (REDCap) platform (see Table of Materials). Trial registration number: NCT05801809.

1. Subject selection and screening

  1. Identify potential subjects by several sources.
    NOTE: For the present study, the human subjects were identified from (1) flyers in public areas across the Boston-land region, (2) internet and newspaper advertisements, (3) advertisements posted on public transportation (The T), (4) Via the Rally platform by Mass General Brigham Research (see Table of Materials). Forty-four healthy subjects were selected for the present study.
  2. Contact eligible subjects or ask permission electronically to contact them to provide more information about the study.
  3. At the first point of contact (usually a phone call or Zoom Enterprise call), a study co-investigator administers an online pr-screening questionnaire. Once the online pre-screening process is completed, take the information gathered by the co-investigator to the PI of the study for further review to confirm eligibility. Then, store the data obtained from the pre-screening in an encrypted web-based platform (REDCap, see Table of Materials).
    1. Include subjects older than 18 years and naive to the stimulation (taVNS).
    2. Exclude pregnant women, the presence of medical conditions, and presence of any contraindication to transauricular vagus nerve stimulation.

2. Equipment details

  1. Use a Transcutaneous Auricular Vagus Nerve Stimulation (taVNS) device (Figure 1), which consists of an earset (Figure 2) with conductive ear tips placed on the auricular concha of the ears (Figure 3).
  2. Connect the electrodes to a stimulator, and during active stimulation, stimulate both the cymbal conchae of the auricular at 30 Hz, 200-250 µs, for 60 min.
    NOTE: For the commercial details of the device and the related accessories, please see Table of Materials.

3. taVNS procedure

NOTE: The protocol consists of two visits: Visit 1 (consent, screening, and collection of demographics information), and Visit 2 (assessments and intervention). The flow of the study can be found in Figure 4.

  1. On Visit 2, randomize the subjects to receive the intervention.
    NOTE: The active group receives active taVNS, and the sham group receives sham taVNS.
  2. Blind the subjects, intervention team (co-investigators/ CO-Is who performed the taVNS intervention), and outcome assessors (CO-Is who performed the assessments or analyzed the data) during the trial. Ensure that one non-involved staff member will generate the allocation sequence, seal the envelopes, and randomly assign individuals to interventions using external and visual display identical devices that differ on whether they are active (active current) or not (sham) by another staff member who is not involved in data collection or analysis.
  3. Collect the data for this study from subjects using an electronic format capture system (REDCap). The following assessments performed are displayed in Table 1.
  4. When the subject arrives, provide information regarding the procedure. First, assess the pain levels and pain modulation, using heat stimuli on the right forearm for the pain threshold, and cold water for the Conditioned Pain Modulation (CPM), following the adapted protocol suggested by Granot17 and Nirl18.
    1. First, determine the pain-60 test temperature (temperature that instigates pain experience at a magnitude of 60 on a 60-100 NPS) by applying a Peltier thermode (see Table of Materials) on the right forearm of subjects and deliver short heat stimuli (41-48 °C), each temperature lasting for 7 s starting from the time the stimulus intensity reaches the destination temperature.
    2. Ask the subjects to rate the level of pain intensity using a numerical pain scale (NPS) ranging from 0 = ''no pain'' to 100 = ''the worst pain imaginable''.
    3. Once the pain-60 temperature is determined, administer the test stimulus by applying the same for 30 s at that temperature, and ask the subjects to rate their levels of pain intensity 3 times: at 10 s, 20 s, and 30 s after the thermode reaches the pain-60 temperature (mean scores of the three pain rating will be calculated).
    4. 5 min after delivering the test stimulus, immerse the left hand of the subject in a bath of water set at 10 °C to 12 °C for 30 s for the conditioned stimulus. Then, apply the same pain-60 temperature on the right forearm of the subject (left hand will still be immersed) for 30 s and again ask the subject to rate their levels of pain intensity 3 times after the thermode reaches the pain-60 temperature: at 10 s, 20 s and 30 s.
      NOTE: CPM (Conditioned Pain Modulation) response will be calculated as the difference between the average of pain ratings from the test stimulus minus the average of pain ratings during the conditioned stimulus.
  5. Ask subjects to place an HRV monitor (displayed in Figure 5 and Figure 6).
  6. Next, assess baseline HRV for 5 min (to analyze frequency HF, LF, LF/HF, and time domains metrics) recording with the monitor connected by Bluetooth to a tablet.
  7. Set up the EEG connected to a computer system, and start the assessments (resting and task-related), which lasts about 30 min.
  8. Next, set up the taVNS device.
    1. Examine, clean with a 70% alcohol pad, and prepare the ear skin of the subject to place the electrodes.
    2. Next, apply the saline solution to the eatips, place the electrodes on the ear, and start the stimulation, which lasts 60 min.
  9. When the taVNS reaches 30 min, record HRV and EEG again for 5 min only.
  10. After 60 min of stimulation, assess the subject for EEG, HRV, and pain, and repeat the pretrial procedures (as mentioned below):
    1. Perform EEG and HRV assessment, which lasts about 30 min.
    2. Perform CPM assessment following step 3.4.
  11. Perform assessments regarding side effects, fatigue and mood.
  12. Complete the session.

4. Follow up procedures

  1. After randomizing the subjects and completing the data collection, perform data analysis3.

Understanding the Effects of Non-Invasive Transauricular Vagus Nerve Stimulation on EEG and HRV

Learning Objectives

We performed a preliminary descriptive analysis of the first randomized subject without unblinding the study. For this reason, which arms this subject was allocated to is unknown. The first subject is a 69-year-old woman, non-Hispanic, Caucasian, with a college degree, who did not report any adverse event during or after the stimulation session. The clinical data are displayed in Table 2.

Besides, a topographic distribution of scalp plots was created in resting-state EEG for theta, alpha, and beta bands in three time periods: baseline, during, and post-procedure (Figure 7). An asymmetric alpha pattern was noticed in the frontal region.

Figure 1
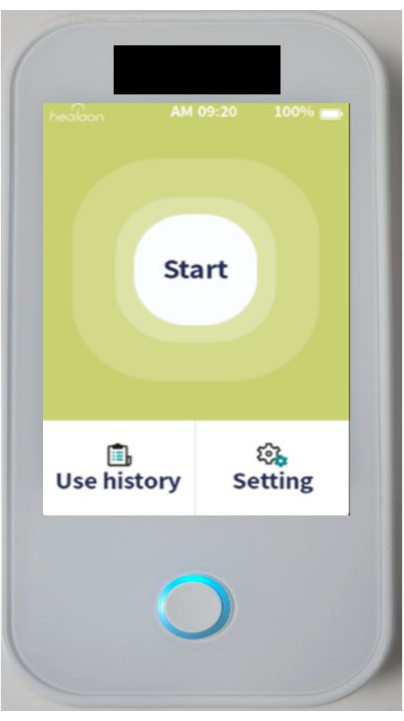
Figure 1: Main taVNS Device, with bilateral electrodes. Please click here to view a larger version of this figure.

Figure 2
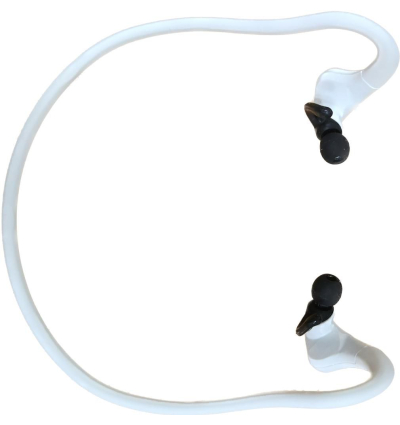
Figure 2: Earset of the taVNS device. Please click here to view a larger version of this figure.

Figure 3
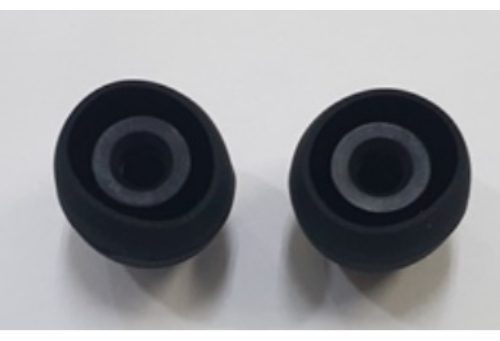
Figure 3: Conductive Ear tip of the electrodes of the taVNS device. Please click here to view a larger version of this figure.

Figure 4
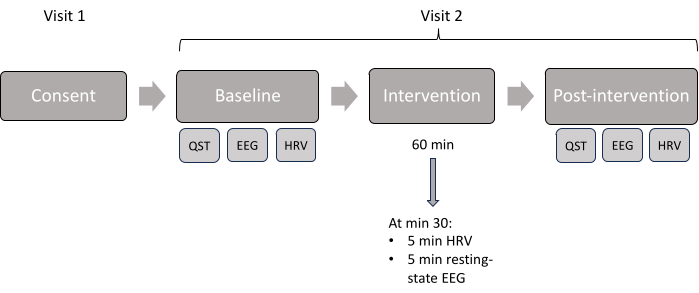
Figure 4: Study visit scheme. Displayed chronologic order of the assessments done in each visit. Please click here to view a larger version of this figure.

Figure 5
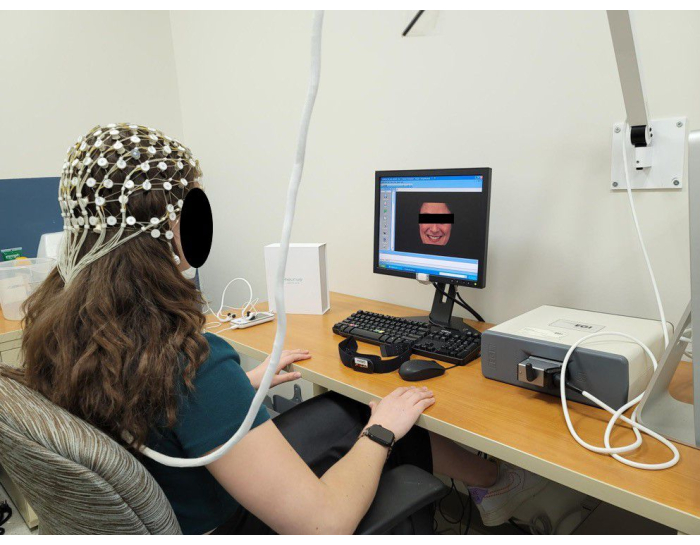
Figure 5: Representation of a subject during an EEG session using a 64-channel EGI system. Please click here to view a larger version of this figure.

Figure 6
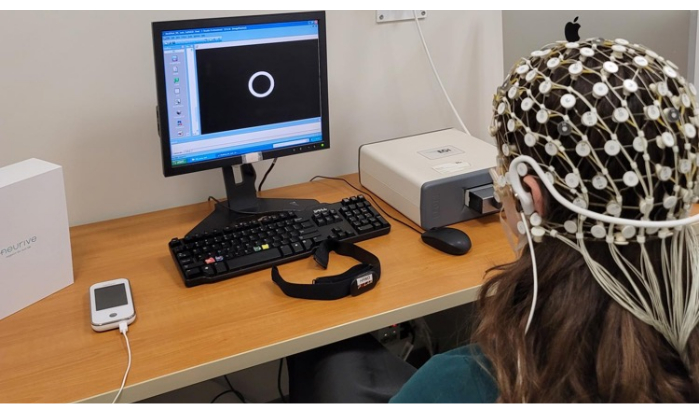
Figure 6: Representation of a subject during the EEG session plus taVNS stimulation. Please click here to view a larger version of this figure.

Figure 7
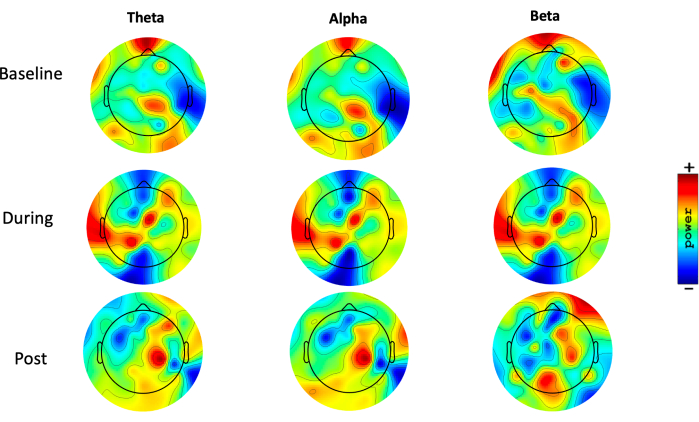
Figure 7: Topographic distribution. Topoplots, showing the topographic distribution of the theta (1-3.9 Hz), alpha (8-12.9 Hz), and beta (13-29.9 Hz) power (range 35 to 44 dB) (10 x log10 P), during resting-state EEG, in three different moments: pre-intervention (baseline), during intervention, and after intervention (post). Blue areas represent low activity, and red areas represent high activity. Please click here to view a larger version of this figure.

Consent and screening Baseline Intervention Post intervention
Visit 1 (online) Visit 2  Visit 2  Visit 2 
Demographics X
Medical History X
Consent form X
Beck depression inventory X
EHI/SF X
Pregnancy test X
BMIS X X
VAS-F X X X
EEG X X X
HRV X X X
QST X X
Success of blinding questionnaire X
Approximate visit time 60 min 60 min 60 min 30 min

Table 1: Assessments scheme. "X" indicates that the procedures were done in each of the visits.

Variable  Demographic data Baseline During intervention After intervention
Age (years) 69
Gender Female
Ethnicity Non-Hispanic
Race Caucasian
Education level College degree
Pain 60 47 . 44
TS 3 . 1
CPM 4 . 5
Mood -6 . 9
Fatigue  5.7 6.6 6.76
HRV – HF 0.046 0.066 0.584
HRV – LF 0.073 0.043 0.037

Table 2: The clinical data representative of one subject. 

List of Materials

Articulated arm Electrical Geodesics, Inc. 20090645
Baby shampoo Dynarex 1396
Charge Cable NEURIVE Co. HV12303003
Computer Apple YM92704U4PC
Condutive eartip NEURIVE Co. HV12303003
Earset NEURIVE Co. HV12303003
EEG 64-channel cap  Electrical Geodesics, Inc. H11333
Heart rate sensor Polar M311370175396
Monitor Dell REVA01
Net Amps 300 Electrical Geodesics, Inc. A09370244
Peltier thermode Advanced Medical Systems, Ramat Yishai, Isreal
Potassium Chloride (dry) Electrical Geodesics, Inc. 820127755
Rally Mass General Brigham Research online platform
Research Electronic Data Capture (REDCap) Vanderbilt web-based software platform
Thermosensory Stimulator Medoc Ltd 1241
Transauricular vagus nerve stimulator NEURIVE Co. HV12303003

Lab Prep

Several studies have demonstrated promising results of transcutaneous auricular vagus nerve stimulation (taVNS) in treating various disorders; however, no mechanistic studies have investigated this technique’s neural network and autonomic nervous system effects. This study aims to describe how taVNS can affect EEG metrics, HRV, and pain levels. Healthy subjects were randomly allocated into two groups: the active taVNS group and the sham taVNS group. Electroencephalography (EEG) and Heart Rate Variability (HRV) were recorded at baseline, 30 min, and after 60 min of 30 Hz, 200-250 µs taVNS, or sham stimulation, and the differences between the metrics were calculated. Regarding vagal projections, some studies have demonstrated the role of the vagus nerve in modulating brain activity, the autonomic system, and pain pathways. However, more data is still needed to understand the mechanisms of taVNS on these systems. In this context, this study presents methods to provide data for a deeper discussion about the physiological impacts of this technique, which can help future therapeutic investigations in various conditions.

Several studies have demonstrated promising results of transcutaneous auricular vagus nerve stimulation (taVNS) in treating various disorders; however, no mechanistic studies have investigated this technique’s neural network and autonomic nervous system effects. This study aims to describe how taVNS can affect EEG metrics, HRV, and pain levels. Healthy subjects were randomly allocated into two groups: the active taVNS group and the sham taVNS group. Electroencephalography (EEG) and Heart Rate Variability (HRV) were recorded at baseline, 30 min, and after 60 min of 30 Hz, 200-250 µs taVNS, or sham stimulation, and the differences between the metrics were calculated. Regarding vagal projections, some studies have demonstrated the role of the vagus nerve in modulating brain activity, the autonomic system, and pain pathways. However, more data is still needed to understand the mechanisms of taVNS on these systems. In this context, this study presents methods to provide data for a deeper discussion about the physiological impacts of this technique, which can help future therapeutic investigations in various conditions.

Procedure

Several studies have demonstrated promising results of transcutaneous auricular vagus nerve stimulation (taVNS) in treating various disorders; however, no mechanistic studies have investigated this technique’s neural network and autonomic nervous system effects. This study aims to describe how taVNS can affect EEG metrics, HRV, and pain levels. Healthy subjects were randomly allocated into two groups: the active taVNS group and the sham taVNS group. Electroencephalography (EEG) and Heart Rate Variability (HRV) were recorded at baseline, 30 min, and after 60 min of 30 Hz, 200-250 µs taVNS, or sham stimulation, and the differences between the metrics were calculated. Regarding vagal projections, some studies have demonstrated the role of the vagus nerve in modulating brain activity, the autonomic system, and pain pathways. However, more data is still needed to understand the mechanisms of taVNS on these systems. In this context, this study presents methods to provide data for a deeper discussion about the physiological impacts of this technique, which can help future therapeutic investigations in various conditions.

Tags