In Vitro Modeling of Fat Deposition in Metabolic Dysfunction-associated Steatotic Liver Disease
Summary
This article describes the use of oleic acid-induced HepG2 cells as a model for metabolic dysfunction-associated steatotic liver disease.
Abstract
The prevalence of metabolic dysfunction-associated steatotic liver disease (MASLD) has surged due to changes in economic and lifestyle patterns, leading to significant health challenges. Previous reports have studied the establishment of animal and cellular models for MASLD, highlighting differences between them. In this study, a cellular model was created by inducing fat accumulation in MASLD. HepG2 cells were stimulated with the unsaturated fatty acid oleic acid at various concentrations (0.125 mM, 0.25 mM, 0.5 mM, 1 mM) to emulate MASLD. The model's efficacy was assessed using cell counting kit-8 assays, Oil Red O staining, and lipid content analysis. This study aimed to create a simple-to-operate cellular model for MASLD cells. Results from the cell counting kit-8 assays showed that the survival of HepG2 cells was dependent on the concentration of oleic acid, with a GI50 of 1.875 mM. Cell viability in the 0.5 mM and 1 mM groups were significantly lower than those in the control group (P < 0.05). Furthermore, Oil Red O staining and lipid content analysis examined fat deposition at varying oleic acid concentrations (0.125 mM, 0.25 mM, 0.5 mM, 1 mM) on HepG2 cells. The lipid content of the 0.25 mM, 0.5 mM, and 1 mM groups was significantly higher than that of the control group (P < 0.05). Additionally, triglyceride levels in the OA groups were significantly higher than those in the control group (P < 0.05).
Introduction
Metabolic dysfunction-associated steatotic liver disease (MASLD) encompasses a range of conditions, including simple steatosis, nonalcoholic steatohepatitis (NASH), cirrhosis, and hepatocellular carcinoma1,2,3,4,5,6, all attributed to factors other than alcohol consuption7. MASLD is the most prevalent liver disease caused by metabolic liver injury, affecting nearly one-quarter of the global population8,9,10,11,12. While the precise pathogenesis of MASLD has not yet been elucidated, various theories attempt to explain its development. One prevailing notion suggests a departure from the classic "two-hit" theory towards a "multiple-hit" model1. Central to these hypotheses is the role of insulin resistance, which is believed to be pivotal in MASLD pathogenesis13. Research indicates that insulin resistance in hepatocytes leads to increased levels of free fatty acids, subsequently forming triglycerides stored within the liver14,15.
Researchers have used both in vivo and in vitro models to simulate fat deposition in MASLD; yet fully replicating its pathomechanism remains challenging. Despite this limitation, these models have been instrumental in studying potential therapeutic targets for MASLD. However, the development of a stable model of MASLD is crucial. While animal models are effective, they are time-consuming and expensive, thus highlighting the growing interest in in vitro cellular models. These models often use single or multiple free fatty acids such as oleic acid (OA) and palmitic acid to recreate diet-induced MASLD. Among these, the human hepatoblastoma cell line HepG2 is often used to establish in vitro cellular models of MASLD.
OA induction stimulates HepG2 cells to replicate fatty deposition akin to MASLD, a method with a well-established history. The aim of this study was to demonstrate the viability, Oil Red O (ORO) staining, lipid content, and triglyceride (TG) level of HepG2 cells treated with 0.25 mM OA. The objective of this experiment was to provide further evidence for the development of MAFLD modeling studies.
Protocol
NOTE: See the Table of Materials for details related to all materials, instruments, and reagents used in this protocol.
1. Cell culture
- Culture HepG2 cells in culture flasks containing Dulbecco's Modified Eagle Medium (DMEM) (containing 10% fetal bovine serum [FBS], 100 units/mL penicillin, and 100 µg/mL streptomycin). Maintain the culture flasks at 37 °C in a 5% CO2 incubator.
2. Effect of oleic acid on cell viability as measured by cell counting kit-8
- Dissolve a specific volume of OA in dimethyl sulfoxide (DMSO) to achieve a concentration of 200 mM. Store the solution at -20 °C for future use.
- Seed HepG2 cells in a 96-well plate at a cell density of 6 × 10³ cells per well. Add 100 µL of DMEM to each well. Incubate and culture the cells at 37 °C in a 5% CO2 incubator for 24 h. Divide the HepG2 cells into two groups:
- Control group: add cell culture medium.
- OA group: add OA to the cell culture medium to achieve final concentrations of 0.125 mM, 0.25 mM, 0.5 mM, and 1 mM.
- After 24 h of initial incubation, discard the supernatant from each well and add OA according to the specified grouping, adding 100 µL per well. For the control group, add 100 µL of cell culture medium to each well. Continue to incubate the cells for another 24 h.
NOTE: Ensure each group has six replicate wells. To prevent evaporation, add 100 µL of phosphate-buffered saline (PBS) to the outer ring of wells in the 96-well plate. - After 24 h of incubation, add 10 µL of cell counting kit-8 (CCK-8) to each well, mix gently, and incubate for 2 h in the dark. Remove the 96-well plate from the incubator, place it in the microplate reader, and measure the absorbance value at 450 nm (A450). The GI50 values were counted according to the OD.
3. Oil Red O staining to observe intracellular lipid droplet formation
- Seed HepG2 cells in 6-well cell culture plates at a density of 5 × 10⁵ cells per well and culture the plates in a constant-temperature incubator for 24 h. Refer to Figure 1 for a visual representation of the described steps.
- After 24 h of cell culture, add 2 mL of cell culture medium containing OA to each well, achieving final concentrations of 0.125 mM, 0.25 mM, 0.5 mM, and 1 mM. After an additional 24 h, remove the cell culture medium from each well and wash twice with PBS. Add 1 mL of ORO fixative to each well and incubate for 30 min.
- Prepare the ORO staining solution by mixing staining solution A with staining solution B at a ratio of 3:2. Allow the mixture to stand at room temperature for 10 min, then filter it once through a 0.45 µm filter. Store the filtered solution in a centrifuge tube protected from light until use.
- Discard the fixative and wash twice with distilled water. Add 1 mL of 60% isopropanol to each well and incubate for 30 s. Discard 60% of the isopropanol solution and add 1 mL of freshly prepared ORO stain solution to each well before incubating for 20 min. Discard the ORO staining solution, add 1 mL of 60% isopropanol to each well, and incubate for 30 s. Wash 5x with water to remove excess dye.
- Cover the cells with distilled water and observe under a microscope. Once the images are collected, discard the liquid in the plate and allow it to dry. Then, add 2 mL of isopropanol to each well and shake the plate on an orbital shaker for 10 min. Transfer the liquid to a new 96-well plate, with 16 wells in each group, adding 100 µL per well. Calculate the lipid content by measuring the optical density (OD) of each well using a microplate reader at 510 nm (A510).
4. Effects of different concentrations of oleic acid on total triglyceride in HepG2 cell supernatant
- Equilibrate the kit at room temperature for 20 min and prepare the required plates for the experiment.
- Collect the cell supernatant and centrifuge at 1,570 × g for 10 min. Set standard wells and testing sample wells. Add 50 µL of standard ([S0 → S5] concentration followed by: 0, 0.5, 1, 2, 4, 8 mmol/L) to standard wells. In addition to the blank and standard wells, add 10 µL of different samples to the sample wells, followed by adding 40 µL of sample diluent to each well. Add 100 µL of detection antibody-horseradish peroxidase to each well, seal with a plate membrane, and incubate at 37 °C for 1 h in a constant temperature oven.
- Discard the supernatant, blot dry on dust-free paper, and wash each well with 1x washing solution. Leave to stand at room temperature for 1 min. Repeat the washing process 5x.
- Add 50 µL of substrate A and 50 µL of substrate B to each well. Mix gently and incubate for 15 min at 37 °C. Add 50 µL of termination solution to each well and measure the OD value of each well at 450 nm (A450) within 15 min.
- Plot the concentration of the standard along the x-axis and the corresponding absorbance (OD) value along the y-axis to perform linear regression and derive the curve equation to calculate the concentration value of each sample.
5. Statistical analysis
- Determine significant differences in quantitative data.
- Calculate the mean ± standard deviation (SD) and graphically represent the data. Consider P < 0.05 to be statistically significant.
Representative Results
Effect of oleic acid on cell viability
HepG2 cells were exposed to varying concentrations of OA (0 mM, 0.125 mM, 0.25 mM, 0.5 mM, 1 mM), resulting in a decrease in cell survival rates at 0.125 mM, 0.25 mM, 0.5 mM, and 1 mM compared to 0 mM. Statistical significance was observed at 0.5 mM (P < 0.05) and 1 mM (P < 0.05) when compared to 0 mM. The results of OA's impact on cell viability, as assessed by the CCK-8 kit, are shown in Figure 2. The GI50 value for OA-treated HepG2 cells was calculated as 1.875 mM.
Oil Red O staining to observe intracellular lipid droplet formation
ORO staining is a commonly used method for lipid visualization16,17. Consequently, the lipid droplet formation in HepG2 cells incubated with OA for 24 h was observed under a microscope following ORO staining. As shown in Figure 3 and Figure 4, the intensity of red staining in the OA-treated cells was higher than in the untreated cells. Red lipid droplets were present in the plasma of HepG2 cells after OA treatment, with the quantities of lipid droplets and lipids increasing with rising OA concentrations (Figure 5).
Effects of different concentrations of oleic acid on total triglyceride in HepG2 cell supernatant
The experimental findings, as illustrated in Figure 6, revealed that compared to the control group, treatment of HepG2 cells with varying concentrations of OA (0.125 mM, 0.25 mM, 0.5 mM, 1 mM) resulted in a significant increase in the TG content of the cell supernatant at OA group (P < 0.05).
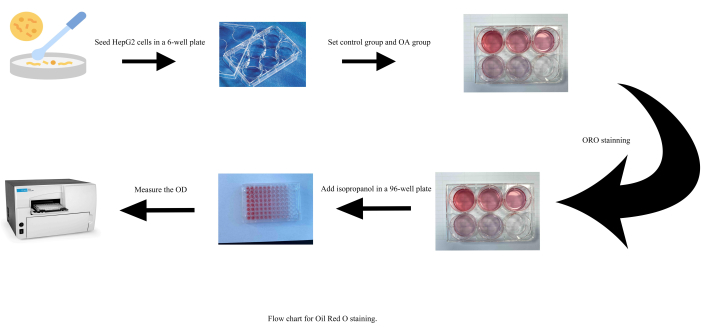
Figure 1: Flow chart for Oil Red O staining. Abbreviations: OA = oleic acid; OD = optical density. Please click here to view a larger version of this figure.
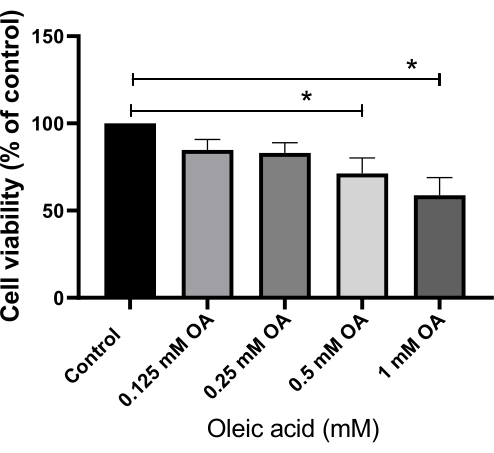
Figure 2: Effect of oleic acid on cell viability, assessed using a cell counting kit-8 assay. Each bar represents the mean ± SD (n = 6). *P < 0.05. Abbreviation: OA = oleic acid. Please click here to view a larger version of this figure.
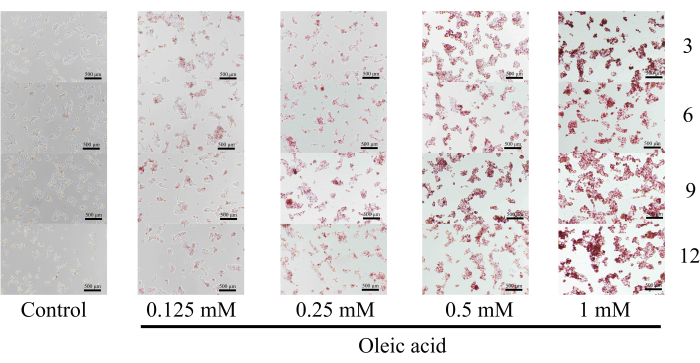
Figure 3: Oil Red O staining images of multiple time points (3, 6, 9, and 12 o'clock directions). Lipid droplet formation was detected using an inverted microscope for cell culture at 40x magnification. Scale bar = 500 µm. Please click here to view a larger version of this figure.
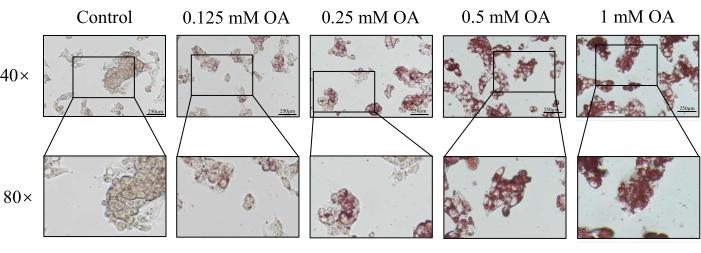
Figure 4: Effect of oleic acid on lipid droplets in the cells, assessed through Oil Red O staining. Lipid droplet formation was detected using an inverted microscope for cell culture at 40x magnification. Scale bar = 250 µm. Please click here to view a larger version of this figure.
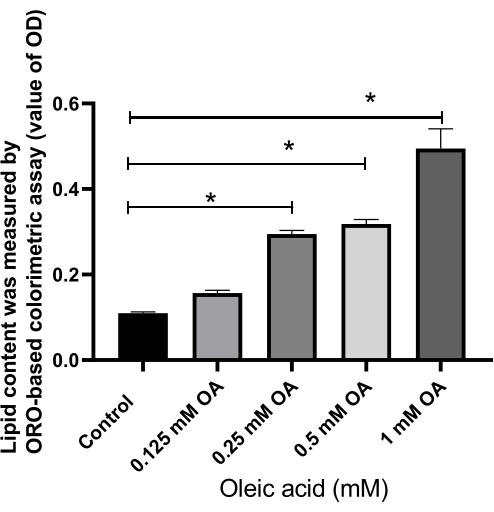
Figure 5: Effect of oleic acid on lipid content in the cells, assessed by the value of optical density. Relative fold changes are presented in the values of optical density in different groups. Each column represents the mean ± SD (n = 16). *P < 0.05. Please click here to view a larger version of this figure.
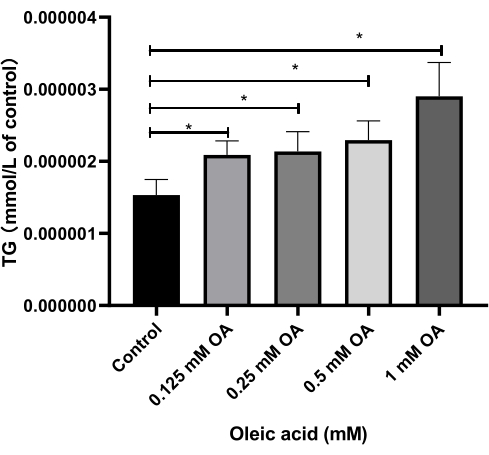
Figure 6: Effects of various concentrations of oleic acid on total triglyceride levels in HepG2 cell supernatant. Relative fold changes are presented in the value of triglyceride levels in different groups. Each column represents the mean ± SD (n = 3). *P < 0.05. Please click here to view a larger version of this figure.
Discussion
MASLD is a clinicopathological syndrome characterized by excessive intracellular fat deposition in hepatocytes due to factors beyond alcohol and other established liver-damaging agents18. MASLD is intricately linked to acquired metabolic stress liver injury, notably associated with insulin resistance and genetic susceptibility. To effectively study and screen drugs for MASLD, it is crucial to select an appropriate experimental model. Establishing a cell model is particularly vital in MASLD research, facilitating a deeper understanding of pathological mechanisms and the evaluation of novel drug effects.
This protocol describes an in vitro model of MASLD established through OA-induced HepG2 cells. ORO staining and lipid content analysis serve as critical methods for creating this model. In addition, assessing cell viability and total TG content in cell supernatants is essential for evaluating the appropriate OA concentration. The diagnostic criterion for MASLD involves the presence of over 5% TG stored in liver cells19,20. MASLD cell models primarily rely on HepG2 cells21,22,23,24,25,26,27,28, known for their successful utilization in constructing fatty liver degeneration models in various domestic and international studies. Despite originating from hepatoma cells, HepG2 cells share many phenotypic characteristics with hepatocytes and are easily cultivated and propagated29,30. Tests such as the CCK-8 kit, ORO staining, lipid content, and total TG measurements offer simple, objective, and reasonable approaches to assess cell viability, fat accumulation, and lipid content in the study subjects. In this context, OA aligns with the pathogenesis of MASLD31, where excess energy is stored in the form of lipids when energy intake exceeds consumption.
Researchers have utilized OA23,28,31,32,33, palmitic acid34,35, and combinations of oleic/palmitic acid26,36 to replicate the MASLD model. Both palmitic acid and OA contribute to liver fatty degeneration and the accumulation of TG. Palmitic acid, the most abundant saturated fatty acid in the human body, exhibits significant lipotoxicity, leading to lipid accumulation in hepatocytes, increased intracellular reactive oxygen radicals, and cell death or necrosis37. Conversely, OA leads to more pronounced intracellular TG deposition (Figure 6) and less cellular modulation38. Thus, researchers often utilize OA-induced HepG2 cells to establish in vitro MASLD models. As described in protocol step 2.2.2, it is crucial to heat the OA solution when adding it. In this study, ORO staining and lipid content analysis were based on the lipid deposition of HepG2 cells, effectively supporting the exploration of in vitro models of MASLD with complex mechanisms and reducing the time and cost required for research.
ORO readily binds to TG in a droplet shape, producing orange to red staining indicative of fat, with color intensity depending on lipid concentration. However, the ORO staining solution is unstable and prone to precipitation, making it unsuitable for preparation in advance. Therefore, the ORO staining solution was prepared after protocol step 3.2, with precautions taken to avoid light exposure during preparation and incubation (protocol steps 3.2, 3.3). In protocol step 3.5, selecting images at multiple time points (3, 6, 9, and 12 o'clock directions) represents a key modification of the experiment that is essential for improving the accuracy of the results. Although elevated OA concentrations affect cell survival, thus representing a limitation of this method, it has been demonstrated that an appropriate OA concentration ensures cell viability.
This study employed a comprehensive approach, using a CCK-8 kit, ORO staining, lipid content analysis, and total TG measurement to establish and validate the model of MASLD. The CCK-8 kit was used to assess the effect of drugs on cell viability, serving as a crucial validation step. In the future, this model holds promise for drug screening and mechanism research aimed at understanding MASLD pathogenesis and identifying potential therapeutic targets. To further ensure the quality of reliability of validation, the expression levels of target proteins implicated in the model will be analyzed using western blotting and quantitative polymerase chain reaction analyses.
Disclosures
The authors have nothing to disclose.
Acknowledgements
The current study was granted by "Study on the key issues of curative effect of Koumiss on regional diseases of Mongolian medicine" in 2018 Supported Project of the science and technology program of the Department of Science and Technology of Inner Mongolia Autonomous Region.
Materials
| 0.22 µm filter | Millex | ||
| 0.25% Trypsin-EDTA (1x) Trypsin-EDTA | Gibco | 25200-056 | |
| 0.45 µm filter | Millex | ||
| 2 mL Crygenic Vials | CORNING | 430659 | |
| 25 cm2 Cell Culture Flask | CORNING | 430639 | |
| 6-well cell culture plate | CORNING | 3516 | |
| 96-well cell culture plate | CORNING | 3599 | |
| Blood Count Plate | Shanghai Jing Jing Biochemical Reagent & Instrument Co. | 02270113 | |
| Cell Counting Kit-8 assays | Beijing Solarbio Science & Technology Co.,Ltd. | CA1210-1000T | |
| CO2 incubator | NUAIRE | NU-5710E | |
| DMSO Dimethyl sulfoxide | Beijing Solarbio Science & Technology Co.,Ltd. | D8371 | |
| Dulbecco's Modified Eagle Medium | Gibco | 8122691 | |
| Enzyme Labeling Equipment | Tecan | Spark | |
| Fetal Bovine Serum, Qualified | Gibco | 10099141 | |
| HepG2 cells line | Beijing North China Chuanglian Biotechnology Research Institute (BNCC) | 221031 | |
| Human Triglyceride (TG) ELISA instruction | Nanjing Jiacheng Bioengineering Institute | 20170301 | |
| Inverted Microscope for Cell Culture | Leica | DMi1 | |
| Isopropanol | Tianjin Zhiyuan Chemical Reagent Co. | 2021030141 | |
| Oil Red Stain Kit, For Cultured Cells | Beijing Solarbio Science & Technology Co.,Ltd. | G1262 | |
| Oleic acid | Sangon Biotech (Shanghai) Co., Ltd. | A502071 | |
| Penicillin Streptomycin | Gibco | 15140122 | |
| SPSS 24.0 | Statistics software |
References
- Alisi, A., Feldstein, A. E., Villani, A., Raponi, M. Pediatric nonalcoholic fatty liver disease: a multidisciplinary approach. Nat Rev Gastroenterol Hepatol. 9 (3), 152-161 (2012).
- Anania, C., Perla, F. M., Olivero, F., Pacifico, L., Chiesa, C. Mediterranean diet and nonalcoholic fatty liver disease. World J Gastroenterol. 24 (19), 2083-2094 (2018).
- Bessone, F., Razori, M. V., Roma, M. G. Molecular pathways of nonalcoholic fatty liver disease development and progression. Cell Mol Life Sci. 76 (1), 99-128 (2019).
- Katsiki, N., Mikhailidis, D. P., Mantzoros, C. S. Non-alcoholic fatty liver disease and dyslipidemia: An update. Metabolism. 65 (8), 1109-1123 (2016).
- European Association for the Study of the Liver (EASL); European Association for the Study of Diabetes (EASD); European Association for the Study of Obesity (EASO). EASL-EASD-EASO Clinical Practice Guidelines for the Management of Non-Alcoholic Fatty Liver Disease. Obes Facts. 9 (2), 65-90 (2016).
- Chalasani, N. et al. The diagnosis and management of nonalcoholic fatty liver disease: Practice guidance from the American Association for the Study of Liver Diseases. Hepatology. 67 (1), 328-357 (2018).
- Díaz, L. A., Arab, J. P., Louvet, A., Bataller, R., Arrese, M. The intersection between alcohol-related liver disease and nonalcoholic fatty liver disease. Nat Rev Gastroenterol Hepatol. 20 (12), 764-783 (2023).
- Cotter, T. G., Rinella, M. Nonalcoholic fatty liver disease 2020: The state of the disease. Gastroenterology. 158 (7), 1851-1864 (2020).
- Lonardo, A. et al. Metabolic mechanisms for and treatment of NAFLD or NASH occurring after liver transplantation. Nat Rev Endocrinol. 18 (10), 638-650 (2022).
- Papatheodoridi, M., Cholongitas, E. Diagnosis of non-alcoholic fatty liver disease (NAFLD): Current concepts. Curr Pharm Des. 24 (38), 4574-4586 (2018).
- Van Herck, M. A., Vonghia, L., Francque, S. M. Animal models of nonalcoholic fatty liver disease-a starter's guide. Nutrients. 9 (10), 1072 (2017).
- Wieckowska, A., Feldstein, A. E. Diagnosis of nonalcoholic fatty liver disease: invasive versus noninvasive. Semin Liver Dis. 28 (4), 386-395 (2008).
- Stein, L. L., Dong, M. H., Loomba, R. Insulin sensitizers in nonalcoholic fatty liver disease and steatohepatitis: Current status. Adv Ther. 26 (10), 893-907 (2009).
- Milić, S., Lulić, D., Štimac, D. Non-alcoholic fatty liver disease and obesity: biochemical, metabolic and clinical presentations. World J Gastroenterol. 20 (28), 9330-9337 (2014).
- Neuschwander-Tetri, B. A., Caldwell, S. H. Nonalcoholic steatohepatitis: summary of an AASLD Single Topic Conference. Hepatology. 37 (5), 1202-1219 (2003).
- Du, J., Zhao, L., Kang, Q., He, Y., Bi, Y. An optimized method for Oil Red O staining with the salicylic acid ethanol solution. Adipocyte. 12 (1), 2179334 (2023).
- Mehlem, A., Hagberg, C. E., Muhl, L., Eriksson, U., Falkevall, A. Imaging of neutral lipids by Oil Red O for analyzing the metabolic status in health and disease. Nat Protoc. 8 (6), 1149-1154 (2013).
- Estes, C., Razavi, H., Loomba, R., Younossi, Z., Sanyal, A. J. Modeling the epidemic of nonalcoholic fatty liver disease demonstrates an exponential increase in burden of disease. Hepatology. 67 (1), 123-133 (2018).
- Watkins, P. A., Ellis, J. M. Peroxisomal acyl-CoA synthetases. Biochim Biophys Acta. 1822 (9), 1411-1420 (2012).
- Heeren, J., Scheja, L. Metabolic-associated fatty liver disease and lipoprotein metabolism. Mol Metab. 50, 101238, (2021).
- Kim, S. H. et al. Effect of isoquercitrin on free fatty acid-induced lipid accumulation in HepG2 cells. Molecules. 28 (3), 1476 (2023).
- Lee, M. R., Yang, H. J., Park, K. I., Ma, J. Y. Lycopus lucidus Turcz. ex Benth. attenuates free fatty acid-induced steatosis in HepG2 cells and non-alcoholic fatty liver disease in high-fat diet-induced obese mice. Phytomedicine. 55, 14-22, (2019).
- Li, J. et al. Hesperetin ameliorates hepatic oxidative stress and inflammation via the PI3K/AKT-Nrf2-ARE pathway in oleic acid-induced HepG2 cells and a rat model of high-fat diet-induced NAFLD. Food Funct. 12 (9), 3898-3918 (2021).
- Li, Y. et al. Protopanaxadiol ameliorates NAFLD by regulating hepatocyte lipid metabolism through AMPK/SIRT1 signaling pathway. Biomed Pharmacother. 160, 114319, (2023).
- Liu, H. et al. Zeaxanthin prevents ferroptosis by promoting mitochondrial function and inhibiting the p53 pathway in free fatty acid-induced HepG2 cells. Biochim Biophys Acta Mol Cell Biol Lipids. 1868 (4), 159287 (2023).
- Mun, J. et al. Water extract of Curcuma longa L. ameliorates non-alcoholic fatty liver disease. Nutrients. 11 (10), 2536 (2019).
- Park, M., Yoo, J. H., Lee, Y. S., Lee, H. J. Lonicera caerulea extract attenuates non-alcoholic fatty liver disease in free fatty acid-induced HepG2 hepatocytes and in high fat diet-fed mice. Nutrients. 11 (3), 494 (2019).
- Xia, H. et al. Alpha-naphthoflavone attenuates non-alcoholic fatty liver disease in oleic acid-treated HepG2 hepatocytes and in high fat diet-fed mice. Biomed Pharmacother. 118, 109287 (2019).
- Alkhatatbeh, M. J., Lincz, L. F., Thorne, R. F. Low simvastatin concentrations reduce oleic acid-induced steatosis in HepG(2) cells: An in vitro model of non-alcoholic fatty liver disease. Exp Ther Med. 11 (4), 1487-1492 (2016).
- Cui, W., Chen, S. L., Hu, K. Q. Quantification and mechanisms of oleic acid-induced steatosis in HepG2 cells. Am J Transl Res. 2 (1), 95-104 (2010).
- Guo, X., Yin, X., Liu, Z., Wang, J. Non-alcoholic fatty liver disease (NAFLD) pathogenesis and natural products for prevention and treatment. Int J Mol Sci. 23 (24), 15489 (2022).
- Rafiei, H., Omidian, K., Bandy, B. Dietary polyphenols protect against oleic acid-induced steatosis in an in vitro model of NAFLD by modulating lipid metabolism and improving mitochondrial function. Nutrients. 11 (3), 541 (2019).
- Tie, F. et al. Kaempferol and kaempferide attenuate oleic acid-Induced lipid accumulation and oxidative stress in HepG2 cells. Int J Mol Sci. 22 (16), 8847 (2021).
- Fang, K. et al. Diosgenin ameliorates palmitic acid-induced lipid accumulation via AMPK/ACC/CPT-1A and SREBP-1c/FAS signaling pathways in LO2 cells. BMC Complement Altern Med. 19 (1), 255 (2019).
- Wu, X. et al. MLKL-dependent signaling regulates autophagic flux in a murine model of non-alcohol-associated fatty liver and steatohepatitis. J Hepatol. 73 (3), 616-627 (2020).
- Scavo, M. P. et al. The oleic/palmitic acid imbalance in exosomes isolated from NAFLD patients induces necroptosis of liver cells via the elongase-6/RIP-1 pathway. Cell Death Dis. 14 (9), 635 (2023).
- Chavez-Tapia, N. C., Rosso, N., Tiribelli, C. Effect of intracellular lipid accumulation in a new model of non-alcoholic fatty liver disease. BMC Gastroenterol. 12, 20 (2012).
- Ricchi, M. et al. Differential effect of oleic and palmitic acid on lipid accumulation and apoptosis in cultured hepatocytes. J Gastroenterol Hepatol. 24 (5), 830-840 (2009).

.