Background autofluorescence of biological samples often complicates fluorescence-based imaging techniques, especially in aged human postmitotic tissues. This protocol describes how autofluorescence from these samples can be effectively removed using a commercially available light emitting diode light source to photobleach the sample prior to immunostaining.
Method Article
Simple Elimination of Background Fluorescence in Formalin-Fixed Human Brain Tissue for Immunofluorescence Microscopy
In This Article
Summary
Abstract
Immunofluorescence is a common method used to visualize subcellular compartments and to determine the localization of specific proteins within a tissue sample. A great hindrance to the acquisition of high quality immunofluorescence images is endogenous autofluorescence of the tissue caused by aging pigments such as lipofuscin or by common sample preparation processes such as aldehyde fixation. This protocol describes how background fluorescence can be greatly reduced through photobleaching using white phosphor light emitting diode (LED) arrays prior to treatment with fluorescent probes. The broad-spectrum emission of white phosphor LEDs allow for bleaching of fluorophores across a range of emission peaks. The photobleaching apparatus can be constructed from off-the-shelf components at very low cost and offers an accessible alternative to commercially available chemical quenchers. A photobleaching pre-treatment of the tissue followed by conventional immunofluorescence staining generates images free of background autofluorescence. Compared to established chemical quenchers which reduced probe as well as background signals, photobleaching treatment had no effect on probe fluorescence intensity while it effectively reduced background and lipofuscin fluorescence. Although photobleaching requires more time for pre-treatment, higher intensity LED arrays may be used to reduce photobleaching time. This simple method can potentially be applied to a variety of tissues, particularly postmitotic tissues that accumulate lipofuscin such as the brain and cardiac or skeletal muscles.
Introduction
Fluorescence microscopy using antibodies targeting specific proteins is routinely used to visualize proteins of interest in cell culture and tissues. A major complication to the acquisition of clear and definitive images in immunofluorescence is autofluorescence, which can be caused endogenously in mammalian tissue by the age pigment lipofuscin and by proteins such as elastin and collagen1,2. Other sources of autofluorescence can be introduced through sample preparation steps such as aldehyde fixation3. Lipofuscin granules, composed primarily of oxidatively modified protein and lipid degradation residues, accumulate in long-living cells with increased age2. This causes difficulties in imaging postmitotic tissues such as the brain and cardiac or skeletal muscles, as the fluorescence emission spectrum of lipofuscin is broad and variable, often coinciding with the emission wavelength of common fluorophores used for labeling4. These factors make imaging of human brain tissue from cases of late-onset neurodegenerative diseases such as frontotemporal lobar degeneration (FTLD) especially challenging.
To reduce autofluorescence, we have devised a technique in which we irradiate the slide-mounted tissue sections with a white light emitting diode (LED) array using a household desk lamp5. This simple technique provides an alternative to techniques that use chemical quenchers such as CuSO4 in ammonium acetate, or commercially available quenching dyes such as Sudan Black B and Eriochrome Black T6. It also has significant cost-saving over multispectral LED lamp photobleaching techniques and avoids complications and artefacts generated from digital autofluorescence removal methods such as spectral un-mixing7,8. White phosphor LEDs have a broad emission spectrum, high luminosity and low manufacturing cost, making them ideal as an off-the-shelf component for photobleaching a variety of chromophores5,9.
In this protocol, we demonstrate the construction of a photobleaching apparatus using accessible components and apply photobleaching to a case of FTLD tissue containing tau-positive inclusions (FTLD-T) using an antibody specific for phosphorylated tau. We demonstrate the effect of photobleaching on imaging fluorescently-labeled antibodies employing two commonly-used chromophores: Alexa 488 and Texas Red. The effect of photobleaching versus untreated sections or those treated with a commercial chemical quencher are quantified and compared. This photobleaching pre-treatment can be incorporated into any standard immunofluorescence staining protocol to remove autofluorescence in a biological sample.
Protocol
Note: The work presented was performed in compliance with recognized international standards, including the International Conference on Harmonization (ICH), the Council for International Organizations of Medical Sciences (CIOMS), and the principles of the Declaration of Helsinki. Use of human tissue was with the approval of University Health Network Research Ethics Board. The human brain samples were collected as a part of the Maritime Brain Tissue Bank. At the time of collection, informed consent was obtained from all patients.
1. Construction of photobleaching apparatus and solutions
- Prepare stock solutions.
- Prepare 1 L of 1x stock Tris-buffered saline (1x TBS) solution (150 mM NaCl, 50 mM Tris-Cl, pH 7.4) by dissolving 8.77 g of NaCl and 6.06 g of Tris base in 800 mL of ddH2O and adjust the pH to 7.4 using HCl. Bring up the volume to 1 L and autoclave.
- Prepare 10% (200x stock) sodium azide by dissolving 1 g of sodium azide in 10 mL of ddH2O (10%, 200x stock).
- For 1-3 standard size slides, use a single 100 mm x 100 mm transparent, square petri dish as a slide chamber. For a single slide chamber, add 0.25 mL of 200x sodium azide stock to 50 mL of 1x TBS to make a 0.05% azide-TBS solution. Stack 2-3 slide chambers vertically to process additional slides. Prepare an additional 50 mL of azide-TBS solution for each chamber.
- Create a scaffold to elevate the slide chamber(s) such that a lamp head can fit underneath.
- For a 100 mm x 100 mm slide chamber, cut openings in the bottom and sides of a 100 mm x 100 mm x 30 mm plastic food container and invert the container. Ensure the side openings are large enough to fit an LED light source and ensure the bottom opening is large enough such that light from the light source reaches the sample chamber without impediment.
- Apply electrical tape to the scaffold to increase the grip between the scaffold and the sample chamber/benchtop. Use any alternative materials to construct the scaffold so long as it securely elevates the slide chamber without impeding the light from reaching the sample.
- Remove any diffusers or opaque plastic from the desk lamp that may impede the LED light from directly reaching the sample (if possible) and orient the LED array upwards. Place the scaffold and slide chamber(s) above the LED array. Use a lamp with a flexible neck for easy manipulation.
- Construct a reflective dome cover for the apparatus by lining the inside of a box large enough to cover the slide chamber and scaffold with aluminum foil. Use a 1 mL pipette tip box for a single chamber or a 150 mm x 150 mm x 150 mm cardboard box for multiple, vertically stacked chambers.
2. Photobleaching pre-treatment of tissue sections
NOTE: Tissue section preparation may vary depending on the source of tissue and fixation and embedding methods used. Here, brain tissue (orbitofrontal gyri) from a case of FTLD-T was fixed for ~2 days in formalin, run through a sucrose gradient, embedded in OCT, and cut to 10 µm thick sections using a cryostat.
- In a 4 ºC cold room, cold cabinet, or refrigerator, orient the lamp under the scaffold and place the sample chamber on the scaffold. Pour 50 mL of azide-TBS solution into the sample chamber.
- Submerge tissue sections mounted on standard glass microscope slides into the slide chamber containing azide-TBS using clean forceps. For multiple slides, ensure that the slides are placed in the chamber on a single layer.
- Cover the apparatus with the reflective dome, turn on the LED lamp, and incubate for 48 h at 4 ºC.
3. Immunofluorescence
- To stain the tissue for phosphorylated tau using DAPI counterstain and Alexa 488- and Texas Red-conjugated secondary antibodies, first prepare solutions for antigen retrieval, permeabilization, blocking, and primary antibody binding.
- Prepare 500 mL of antigen retrieval buffer (10 mM citric acid, 2 mM ethylenediaminetetraacetic acid, 0.05% Tween 20; pH 6.2) by dissolving 0.92 g of citric acid and 0.37 g of ethylenediaminetetraacetic acid (EDTA) in 500 mL of ddH2O. Adjust the pH to 6.2 with NaOH and add 0.25 mL of Tween 20.
- Prepare 500 mL of 0.025% Triton X-100 in TBS solution (TBS-Triton) by adding 0.125 mL of Triton X-100 to 500 mL 1x TBS.
- Prepare a 1% bovine serum albumin (BSA) solution in TBS (BSA-TBS buffer) by dissolving 0.1 g BSA in 10 mL TBS.
- Prepare a blocking solution by adding 0.2 mL of normal goat serum to 1.8 mL of 1% BSA/TBS.
- For each slide, prepare 150 µL of primary antibody solution (1:100 dilution) by pipetting 1.5 µL of anti-phospho-PHF-tau pSer202 + Thr205 (AT8) antibody into 148.5 µL of 1% BSA-TBS buffer and leave on ice.
- To perform antigen retrieval, submerge the photobleached slides vertically in a slide collector containing 25 mL of antigen retrieval buffer. Secure the collector with tape and/or strings such that the collector does not fall into the water bath. Heat the collector in a water bath at 90 ºC for 30 min and allow the collector to cool to room temperature for 30 min before removing the slides. Do not remove the slides immediately as it will cause the sections to dry out.
- Transfer the slides from the antigen retrieval collector into a staining jar filled with 30 mL of TBS-Triton and wash the sections for 5 min on an orbital shaker with gentle shaking. Repeat the wash once with fresh TBS-Triton. Wick away excess buffer with a lint-free tissue and outline the tissue with a hydrophobic pen. Take care not to let the slides dry out.
- For each slide, block the tissue by pipetting 200 µL of blocking solution onto the tissue and place the slide in a humidified chamber. Construct the chamber by placing a slide rack inside a pipette tip box containing a wet paper towel. Incubate at room temperature for 2 h on a level surface. Ensure that the blocking solution fully covers the tissue.
- Remove the blocking solution by aspiration and pipette 100-150 µL of primary antibody solution onto the tissue. Ensure sufficient volume of antibody is present and that the section is on a level surface to avoid pooling of antibody solution to one side. Incubate at 4 ºC overnight in a humidified chamber.
- Prepare the secondary antibody mixture and the DAPI nuclear counterstain.
- For each slide, prepare 150 µL of secondary antibody mixture (1:100 dilutions) by adding 1.5 µL of goat anti-mouse Alexa 488 and 1.5 µL of goat anti-mouse Texas Red to 147 µL of BSA-TBS and leave on ice.
- Prepare 0.1 µg/mL DAPI counterstain by serial dilution. Mix the stock solution thoroughly and dilute 1 µL of stock 5 mg/mL DAPI in 999 of TBS to make 1 mL of 5 µg/mL solution. For each slide, dilute 3 µL of 5 µg/mL solution with 147 µL of TBS to a final concentration of 0.1 µg/mL.
CAUTION: DAPI is a known mutagen and should be handled with care.
- Remove the primary antibody by aspiration. Submerge the slides in a glass staining jar containing 30 mL of TBS-Triton and wash for 5 min with gentle mixing on an orbital shaker. Repeat the wash step with fresh TBS-Triton. Wick away excess TBS-Triton and pipette 100 to 150 µL of secondary antibody mixture to each slide.
- Ensure the tissue is fully covered by the antibody mixture. Incubate for 2 h at room temperature in the humidified chamber in the dark.
- Remove the secondary antibody mixture by aspiration and transfer the slide into a glass staining jar containing 30 mL of TBS (no Triton). Wash for 5 min with gentle mixing on an orbital shaker. Repeat the wash step with fresh TBS. Apply 100 to 150 µL of 0.1 µg/mL DAPI counterstain to each slide and incubate for 10 min at room temperature in the dark.
- Transfer the slides to a glass staining jar containing TBS and wash 3 times with gentle mixing for 5 min each, using fresh TBS for each wash. Wick away excess buffer.
- Apply 3 drops of aqueous mounting medium to the tissue. Using forceps, gently lower a clean glass coverslip onto the tissue, starting with one edge and slowly lowering the other edge to avoid trapping of air bubbles. Take care not to dislodge the coverslip if imaging immediately. Otherwise, allow the mounting medium to dry before storing at 4 ºC in the dark.
4. Fluorescence microscopy
- Turn on the fluorescence lamp, the microscope and the computer and allow the lamp to warm up for 15 min. Place the stained tissue slides in the fluorescence microscope stage. Use the bright field image to locate the tissue at 10x magnification.
- Apply a drop of ddH2O to the coverslip surface and use a 20x water immersion objective lens (NA=1.0). Select the 4-line average plane scan setting. Set the pinhole size to 1 Airy unit that gives an optical slice of ~3 microns. Select the laser excitation and emission wavelengths for each fluorophore in separate tracks for best signal.
NOTE: Alexa 488: λex = 488 nm (argon laser) λem = 493-570 nm; Texas Red: λex = 561 nm (DPSS 561 nm laser), λem = 601-635 nm; DAPI: λex = 405 nm (Diode 405 laser), λem = 410-507 nm.- Adjust the laser power and gain settings to optimize the signal intensity for each track. Collect the composite image and save. Use the same laser settings to compare fluorescence intensities in a different slide.
- For visualization of fluorescence intensity in each channel, install the RGB profile tools macro for ImageJ10. Save the macro from the webpage as a text file (https://imagej.nih.gov/ij/macros/tools/RGBProfilesTool.txt). From the ImageJ menu, select Plugins -> Macros -> Install; select the text file to install the RGB profiles tool.
- Open the confocal image file in ImageJ and convert the composite images from the 3 stacks to RGB by performing the following: Image -> Color -> Channel Tool. Select "Composite" from the dropdown menu and check all three channels. Then, select Image -> Type -> RGB color.
- Select the RGB profile tools icon and draw a line across the section in the image to be profiled. Save the intensity data as a spreadsheet for plotting.
Results
The photobleaching pre-treatment step can be added to a standard immunofluorescence protocol immediately prior to antigen retrieval and immunostaining (Figure 1A). Assembly of the photobleaching apparatus can also be performed using various, inexpensive, off-the-shelf components (Figure 1B). The emission spectrum of white phosphor LEDs covers a wide range of wavelengths which makes them suitable for broad-range photobleaching, agreeing with previous reports (Figure 1C)5,11. After 48 h photobleaching, the intensity of autofluorescent speckles that resemble lipofuscin as well as general background fluorescence was reduced considerably in both emission wavelengths in an unstained section of FTLD-T (Figure 1D). To demonstrated the efficacy of photobleaching, we stained for hyperphosphorylated tau to visualize pathological tau inclusions in a case of FTLD-T using two different secondary antibodies. The distinct shape of tau inclusions and the use of two chromophores for labeling also allows us to confidently distinguish autofluorescent features from the intended targets to validate the technique.
In the composite images at lower magnification, the morphology of the tau-positive inclusions, stained yellow from the combination of Alexa 488 and Texas Red channels, consists of ring-shaped collections of short cell processes that are referred to as 'astrocytic plaques' (Figure 2a-c). This morphology is characteristic of corticobasal degeneration (CBD)12,13, which agrees with the pathology report of this case. In the untreated sample, numerous structures are present in the composite image that did not resemble tau inclusions, and showed fluorescence primarily in the red channel, suggesting that it is autofluorescence rather than intended antibody staining. A noticeable level of background fluorescence is also visible in this channel throughout the field of view (Figure 2a). These autofluorescent features are removed and the overall image appears much cleaner when samples were treated with photobleaching (PB) and the chemical quencher (Figure 2b-c).
We then quantified the fluorescence differences in these samples by profiling a smaller region in each sample. A single astrocytic plaque is presented in each treatment condition for comparison (Figure 2d-r). In the untreated sample, background fluorescence is present in all three channels, but secondary antibody fluorescence for both Alexa 488 and Texas Red antibodies was relatively high (Fig 2h). However, the autofluorescent structures present in the untreated sample had fluorescence intensities in the Texas Red channel comparable to the Texas Red secondary antibody that stained for tau (Figure 2h). If the target protein did not have a distinct, predictable morphology such as tau in our case, the autofluorescence in the tissue would have rendered the image uninterpretable.
In contrast, when the photobleaching pre-treatment was applied prior to immunostaining, background fluorescence in the Alexa 488 and Texas Red channels was significantly reduced compared to the untreated sample, and the fluorescence of immunostained tau remained unaffected (Figure 2i-m). The commercial chemical quencher quenched the autofluorescence in the Alexa 488 channel just as effectively as photobleaching. It also suppressed DAPI background fluorescence, which was not affected by the 48 h photobleaching treatment (Figure 2m). However, the chemical quencher also reduced the intensity of the Texas Red secondary and DAPI signals, suggesting a certain degree of counterproductive quenching (Figure 2n-r).
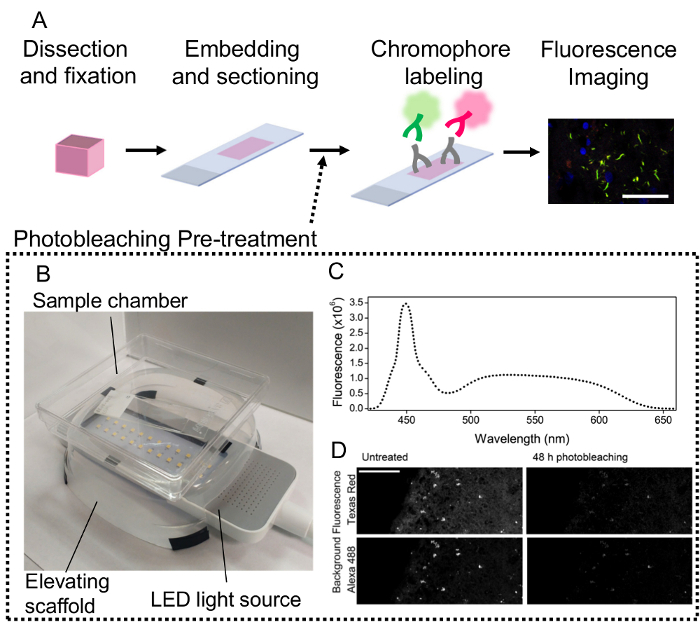
Figure 1: Application of photobleaching pre-treatment in a standard immunofluorescence workflow. A) Simplified schematic of the standard immunofluorescence protocol from tissue acquisition to imaging. Application of primary and secondary fluorescent antibodies is represented by cartoons. A representative microscope image is produced. Scale bar = 100 µm. B) A representative photobleaching apparatus constructed using off-the-shelf components (reflective lid is not shown). C) Emission spectrum of white LED array. A narrow emission peak at 450 nm and a broad peak at 550 nm are observed. D) Effect of photobleaching on endogenous background fluorescence of FTLD-T tissue at Alexa 488 (493-570 nm) and Texas Red (601-635 nm) emission wavelengths. Autofluorescent speckles resembling lipofuscin are visibly reduced after 48 h photobleaching. Scale bar = 100 µm. Please click here to view a larger version of this figure.
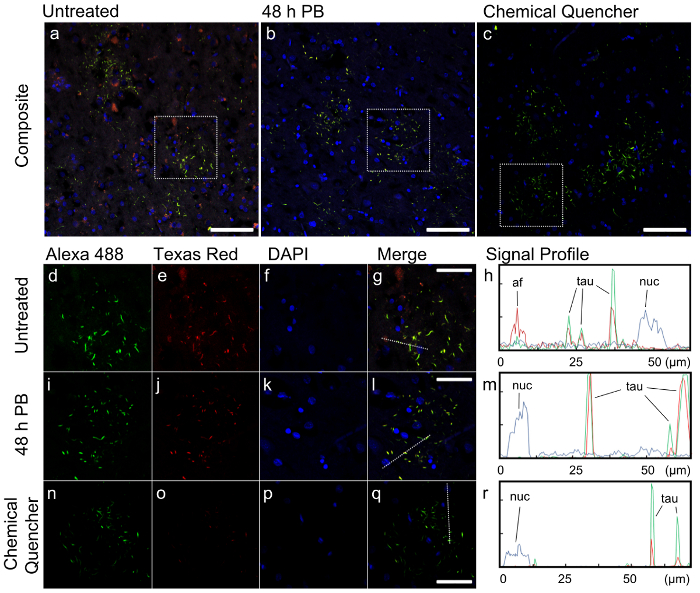
Figure 2:Effect of autofluorescence removal on image quality of a case of FTLD-T tissue with anti-phosphorylated tau immunostaining. a-c) Low magnification, composite immunofluorescence images of representative fields of view in untreated (a), photobleached for 48 h (b) and chemical quencher treated (c) samples. Colors represent fluorescence in the following channels via excitation by their respective light sources: Alexa 488 (green): λex = 488 nm (argon laser) λem = 493-570 nm; Texas Red (red): λex = 561 nm (DPSS 561 nm laser), λem = 601-635 nm; DAPI (blue): λex = 405 nm (Diode 405 laser), λem = 410-507 nm. Scale bar = 100 µm. d-r) Higher magnification images of the dotted regions in untreated (d-g), photobleached (i-l) and chemical quencher treated (n-q) samples, with separate fluorescence channels, merged image, and quantified fluorescence signal profiles. Dotted lines in the merged channels (g, l, q) represent the line on which signal profiles (h, m, r) were generated. Scale bar = 50 µm. Autofluorescent particles (af), immunolabeled tau fluorescence (tau) and nucleus signal (nuc) are indicated. Please click here to view a larger version of this figure.
Discussion
The photobleaching pre-treatment of tissues described in this manuscript allows for effective elimination of autofluorescence using off-the-shelf components. The protocol describes immunofluorescence imaging of phosphorylated tau aggregates in formalin-fixed human brain tissue using secondary antibodies conjugated to Alexa 488 and Texas Red, with DAPI as a nuclear counterstain. To apply the method to other tissues, we recommend performing a 48 h photobleaching pre-treatment to the sample as a starting point. After photobleaching, perform the standard immunofluorescence staining protocol for the features of interest using antibody dilutions following the manufacturer's recommendations. If background fluorescence is still present, the photobleaching duration and/or the antibody staining steps need to be modified. The duration of photobleaching will vary depending on the lamp selected to construct the apparatus and the level of autofluorescence in the sample. The optimal bleaching time for each unique lamp apparatus must be determined. This can be done by photobleaching an unstained, coverslipped tissue section mounted in TBS-azide and measuring the endogenous fluorescence of the slide at 12 h intervals using a fluorescence microscope. In previous reports, we monitored lipofuscin photobleaching by particle analysis and curve fitting to exponential decay functions5, but for simplicity, visual observation of the sections at regular intervals can be equally effective to judge the duration at which most of the fluorescence becomes quenched. In our case of aged brain tissue containing high amounts of lipofuscin pigments, 48 h incubation with an 800 lux lamp was sufficient. If the specific signal remains weak compared to the background after photobleaching, consider increasing the concentration of primary and secondary antibodies during staining. It is also important to perform a secondary antibody-only control to ensure the background signal is not caused by non-specific secondary antibody binding. Take care to select antibodies that do not cross-react, especially when staining for multiple targets. Additionally, ensure that the specific signals are not inadvertently quenched during the staining process. For instance, Nissl stain (for staining neurons) is quenched by BSA. In this instance, the BSA component of the blocking solution should be replaced with alternatives such as fish skin gelatin5.
The use of white phosphor LEDs for photobleaching has certain limitations due to its emission spectrum from 420 nm to 650 nm. Thus, no significant photobleaching in the UV wavelengths is possible. Also, due to the broad emission spectrum, photobleaching chromophores of specific wavelengths requires modifications such as overlaying color filter sheets above the LED arrays to filter out undesirable emission wavelengths. Additionally, photobleaching of tissue may require longer processing times than other methods. In this case, due to the age of the brain tissue (from an 89-year-old individual) and the long aldehyde fixation period of more than 2 days, a 48 h photobleaching duration was required. Although no active processing time is required, one must take into consideration the photobleaching time and plan the staining session accordingly. LED lamps of higher luminosity or the use of multiple lamps may significantly reduce the photobleaching time by the simple increase in photon flux.
Compared to existing methods, our technique offers several significant advantages. Unlike photobleaching using scanning lasers in fluorescence microscopy, we observed no signs of photo-induced damage of our samples using LED photobleaching. Another major advantage of our apparatus is the significant reduction in cost over other techniques. The cost of assembly of our apparatus is approximately $10 USD, and the assembly of the apparatus is flexible enough such that any laboratory can adopt their own version of the photobleacher. In comparison, other methods using mutispectral LED arrays with custom slide holders and cooling chambers requires up to $1000 USD to construct8. In addition, commercial chemical quenchers are consumables that cost $120 USD for 100 slides and introduce potentially unwanted compounds into the sample. The chemical quencher used for comparison in the present study likely contains the lipid-binding Sudan Black dye, which may interfere with immunostaining of lipoproteins.
Overall, the most critical steps in the photobleaching pre-treatment and immunostaining of the specimen involves the handling of the section during immunostaining. It is important that once the section is rehydrated during photobleaching, it is not allowed to dry out in any of the subsequent steps. Drying of the slide will cause uneven distribution of antibodies and create uninterpretable artifacts. To avoid loss of time and potentially precious samples, care must be taken at several steps in the protocol. After antigen retrieval, allow the tissue to cool before transferring to the TBS-Triton permeabilization solution. Even momentary exposure to air when the sample is heated to high temperatures will cause instantaneous drying of the tissue. Also ensure that antibody, blocking, or counterstain solutions fully cover the tissues during application. This can be achieved by making sure that the tissue is fully outlined by the hydrophobic pen to avoid solution run-off and that all solutions are applied in a humidified chamber on a level surface. This is especially important during overnight incubations (primary antibody binding).
The successful application of photobleaching using white phosphor LEDs prior to staining may facilitate the application of immunofluorescence methods to archived tissues. It is a versatile and inexpensive treatment that we expect to be amenable to a wide range of specimens in the future. Although we have only applied this method to human brain tissue, this technique can be easily incorporated into any staining protocol in which autofluorescence is preventing desirable results, particularly in postmitotic tissue such as cardiac or skeletal muscles where lipofucin is more likely to accumulate.
Disclosures
The authors have nothing to disclose.
Acknowledgements
This study was supported in whole or in part by the Canadian Consortium of Neurodegeneration and Aging (CCNA), the Canadian Institute of Health Research (CIHR), the ALS Society of Canada (ALS Canada), and the Alzheimer Society of Canada (ASC). The authors would like to thank Sultan Darvesh and Andrew Reid from the Maritime Brain Tissue Bank for providing the FTLD brain tissues, Milan Ganguly from the Spatio-Temporal Targeting and Amplification of Radiation Response (STTARR) program and its affiliated funding agencies for tissue embedding and sectioning services, and the Advanced Optical Microscopy Facility (AOMF) for providing microscopy instruments. Kevin Hadley is thanked for critical review of the manuscript.
Materials
| Name | Company | Catalog Number | Comments |
|---|---|---|---|
| Trizma Base | Sigma-Aldrich | T6066 | |
| Sodium Choloride | Sigma-Aldrich | S7653 | |
| Hydrochloric Acid | Caledon Laboratory Chemicals | 1506656 | |
| Sodium Azide | BioShop Canada | SAZ001 | |
| 100 mm x 100 mm x 20 mm Pitri dish | Sarstedt | 82.9923.422 | All components of photobleacher can be substituted based on availability |
| 6 W LED Dimmable Desk Lamp | DBPower | DS501 | All components of photobleacher can be substituted based on availability |
| Citric Acid | Sigma-Aldrich | C-2404 | |
| Ethylenediaminetetraacetic acid (EDTA) | BioShop Canada | EDT001 | |
| Tween 20 | Sigma-Aldrich | P-7949 | |
| Sodium Hydroxide | BioShop Canada | SHY700.1 | |
| Water bath | Haake Fisons | K15 | |
| Slide collector | FisherScientific | 12-587-17B | |
| Staining Jar | FisherScientific | E94 | |
| Orbital Shaker | Bellco Glass | 7744-08115 | |
| Triton X-100 | Sigma-Aldrich | T7878 | |
| Bovine Serum Albumin | FisherScientific | BP1600-1 | |
| Normal Goat Serum | Aurion | 905.002 | |
| Hydrophobic pen | Sigma-Aldrich | Z672548-1EA | |
| Phospho-Tau (Ser202, Thr205) Monoclonal Antibody (AT8) | ThermoFisher | MN1020 | |
| Goat anti-Mouse Secondary Antibody, Texas Red-X | ThermoFisher | T862 | |
| Goat anti-Mouse Secondary Antibody, Alexa Fluor 488 | ThermoFisher | A-11029 | |
| DAPI | Sigma-Aldrich | D9542 | |
| Mounting medium | ThermoScientific | 28-600-42 | |
| Glass soverslip | |||
| Confocal Microscope | Zeiss | LSM710 | |
| Imaging software ZEN 2012 Black Edition 11.0 | Zeiss | LSM710 | Software accompanies the Confocal Microscope |
| ImageJ | NIH | https://imagej.nih.gov/ij/download.html | |
| RGB Profile Tools macro | NIH | https://imagej.nih.gov/ij/macros/tools/RGBProfilesTool.txt | |
| Commercial chemical quencher | Biotum | 23007 |
References
- Banerjee, B., Miedema, B. E., Chandrasekhar, H. R. Role of basement membrane collagen and elastin in the autofluorescence spectra of the colon. J Investig Med. 47 (6), 326-332 (1999).
- Terman, A., Brunk, U. T. Lipofuscin . Int J Biochem Cell Biol. 36 (8), 1400-1404 (2004).
- Del Castillo, P., Llorente, A. R., Stockert, J. C. Influence of fixation, exciting light and section thickness on the primary fluorescence of samples for microfluorometric analysis. Basic Appl Histochem. 33 (3), 251-257 (1989).
- Ottis, P., Koppe, K., et al. Human and rat brain lipofuscin proteome. Proteomics. 12 (15-16), 2445-2454 (2012).
- Sun, Y., Chakrabartty, A. Cost-effective elimination of lipofuscin fluorescence from formalin-fixed brain tissue by white phosphor light emitting diode array. Biochem Cell Biol. 94 (6), 545-550 (2016).
- Davis, A. S., Richter, A., et al. Characterizing and Diminishing Autofluorescence in Formalin-fixed Paraffin-embedded Human Respiratory Tissue. J Histochem Cytochem. 62 (6), 405-423 (2014).
- Zimmermann, T., Rietdorf, J., Pepperkok, R. Spectral imaging and its applications in live cell microscopy. FEBS Lett. 546 (1), 87-92 (2003).
- Duong, H., Han, M. A multispectral LED array for the reduction of background autofluorescence in brain tissue. J Neurosci Methods. 220 (1), 46-54 (2013).
- Albeanu, D. F., Soucy, E., Sato, T. F., Meister, M., Murthy, V. N. LED arrays as cost effective and efficient light sources for widefield microscopy. PLoS One. 3 (5), 1-7 (2008).
- Schneider, C. A., Rasband, W. S., Eliceiri, K. W. NIH Image to ImageJ: 25 years of image analysis. Nat Methods. 9 (7), 671-675 (2012).
- Robertson, J. B., Zhang, Y., Johnson, C. H. Light-emitting diode flashlights as effective and inexpensive light sources for fluorescence microscopy. J Microsc. 236 (1), 1-4 (2009).
- Mackenzie, I. R. A., Neumann, M. Molecular neuropathology of frontotemporal dementia: insights into disease mechanisms from postmortem studies. J Neurochem. 138 (S1), 54-70 (2016).
- Kouri, N., Whitwell, J. L., Josephs, K. A., Rademakers, R., Dickson, D. W. Corticobasal degeneration: a pathologically distinct 4R tauopathy. Nat Rev Neurol. 7 (5), 263-272 (2011).
Reprints and Permissions
