The present protocol provides detailed descriptions for the efficient isolation of urinary extracellular vesicles utilizing functionalized magnetic beads. Moreover, it encompasses subsequent analyses, including western blotting, proteomics, and phosphoproteomics.
Method Article
Chemical Affinity-Based Isolation of Extracellular Vesicles from Biofluids for Proteomics and Phosphoproteomics Analysis
In This Article
Summary
Abstract
Extracellular vesicles (EVs) from biofluids have recently gained significant attention in the field of liquid biopsy. Released by almost every type of cell, they provide a real-time snapshot of host cells and contain a wealth of molecular information, including proteins, in particular those with post-translational modifications (PTMs) such as phosphorylation, as the main player of cellular functions and disease onset and progression. However, the isolation of EVs from biofluids remains challenging due to low yields and impurities from current EV isolation methods, making the downstream analysis of EV cargo, such as EV phosphoproteins, difficult. Here, we describe a rapid and effective EV isolation method based on functionalized magnetic beads for EV isolation from biofluids such as human urine and downstream proteomics and phosphoproteomics analysis following EV isolation. The protocol enabled a high recovery yield of urinary EVs and sensitive profiles of EV proteome and phosphoproteome. Furthermore, the versatility of this protocol and relevant technical considerations are also addressed here.
Introduction
Extracellular vesicles (EVs) are membrane-encapsulated nanoparticles secreted by all types of cells and are present in biofluids such as blood, urine, saliva, etc.1,2,3,4. EVs carry a cargo of diverse bioactive molecules which reflect the physiological and pathological state of their host cells and, therefore function as crucial factors in disease progression4,5,6. Moreover, extensive studies have established that EV-based disease markers can be identified prior to the onset of symptoms or the physiological detection of tumors5,6,7.
Phosphorylation acts as a key mechanism in cellular signaling and regulation. Therefore, phosphoproteins provide a valuable source for biomarker discovery as aberrant phosphorylation events are associated with dysregulated cellular signaling pathways and metastatic disease development such as cancer8,9,10. Although profiling phosphorylation dynamics allows for the identification of disease-specific phosphoprotein signatures as potential biomarkers, the low abundance and dynamic nature of phosphoproteins pose major challenges in developing phosphoproteins as biomarkers11,12. Notably, the low-abundant phosphoproteins encapsulated within EVs are protected from external enzymatic digestion in the extracellular environment8. Consequently, EVs and EV-derived phosphoproteins offer an ideal source for biomarker discovery in the early-stage detection of cancer and other diseases.
Although analysis of protein phosphorylation in EVs offers a valuable resource for understanding cancer signaling and early-stage disease diagnosis, the lack of efficient EV isolation methods presents a major barrier. EV isolation is commonly achieved through differential ultracentrifugation (DUC)13. However, this method is time-consuming and is not suitable for clinical implications due to low throughput and poor reproducibility13,14. Alternative EV isolation approaches, such as polymer-induced precipitation15, are limited by low specificity due to co-precipitation of non-EV proteins. Affinity-based approaches, including antibody-based affinity capture16 and affinity filtration17, offer enhanced specificity but are restricted to a relatively low recovery rate due to small volume.
To address the issues in exploring phosphoprotein dynamics in EVs, our group has developed extracellular vesicles total recovery and purification (EVtrap) technique based on chemical affinity to capture EVs onto functionalized magnetic beads18. Previous results have demonstrated that this magnetic bead-based EV isolation method is highly effective in isolating EVs from a wide range of biofluid samples and is able to achieve much higher EV yield while minimizing contamination compared to DUC and other existing isolation methods18,19. We have successfully utilized EVtrap and a titanium-based phosphopeptide enrichment method developed by our group20 to profile the phosphoproteome of EVs derived from diverse biofluids and to detect potential phosphoprotein biomarkers for various diseases19,21,22.
Here, we present a protocol based on EVtrap for the isolation of circulating EVs. The protocol focuses on the urinary EVs. We also demonstrate the characterization of isolated EVs using western blotting. We then detail the sample preparation and mass spectrometry (MS) acquisition for both proteomics and phosphoproteomics analyses. This protocol provides an efficient and reproducible workflow for profiling the urinary EV proteome and phosphoproteome, which will facilitate further studies on EVs and their clinical applications23.
Protocol
All urine samples were collected from healthy individuals after informed consent. The experiments were compliant with all ethical standards involving human samples and conform to the guidelines from Purdue University Human Research Protection Program.
1. Sample collection
- Centrifuge 12 mL of urine sample in a 15 mL conical centrifuge tube for 10 min at 2,500 x g, 4 °C to remove cell debris and large apoptotic bodies.
- Transfer 10 mL of the supernatant into a new 15 mL tube and proceed with EV isolation.
NOTE: The protocol can be paused here, and the samples can be stored at -80 °C and thawed at 37 °C upon use.
2. EV isolation using the EVtrap approach
- Add 0.5 mL of loading buffer (1:10 v/v ratio) and 100 µL of EVtrap bead slurry (1:50 v/v ratio) to the sample according to the manufacturer's instructions.
- Incubate the sample by end-over-end rotation for 30 min at room temperature.
- Pellet the sample by placing the 15 mL conical tube on a magnetic separator rack. Remove the supernatant.
- Resuspend the beads in 1 mL of washing buffer and transfer the suspension to a 1.5 mL microcentrifuge tube. Gently pipette to resuspend the EV-bound beads.
- Place the tube on a 1.5 mL microcentrifuge tube magnetic separator rack and aspirate the supernatant. Use a P200 pipette to completely aspirate the supernatant and avoid aspirating the beads.
- Wash the beads with 1 mL of washing buffer. Add the buffer immediately after aspirating the supernatant to prevent the beads from drying out.
- Wash the beads 2x with 1 mL of phosphate-buffered saline (PBS) at room temperature.
- Incubate the beads with 100 µL of freshly prepared 100 mM triethylamine for 10 min at room temperature and collect the eluted solution containing EVs using a 1.5 mL microcentrifuge tube magnetic separator rack.
NOTE: To prepare 1 mL of 100 mM triethylamine, dilute 14 µL of triethylamine solution in water. - Repeat Step 2.8 and combine the eluted solutions. Dry the eluate using a vacuum centrifuge concentrator at 4 °C.
NOTE: The experiment can be paused here. Dried EV samples can be stored at -80 °C for several months without adverse effects on the following steps or the results.
3. Characterization of EVs by western blotting
- Resuspend 5% of the dried EV sample (equivalent to 0.5 mL of the urine sample) in 20 µL of 1x lithium dodecyl sulfate (LDS) sample buffer with 10 mM dithiothreitol (DTT).
NOTE: EVs from 0.5 mL of urine are enough for detecting CD9 (an EV marker24) signal in western blotting. - Boil the sample for 5 min at 95 °C. Load the sample on a polyacrylamide gel and perform electrophoresis and immunoblotting following standard protocols25.
- After transferring the proteins onto a low-fluorescence polyvinylidene fluoride (PVDF) membrane, block the membrane with 1% bovine serum albumin (BSA) in tris-buffered saline tween-20 (TBST) for 1 h at room temperature. To prepare 1 L of TBST buffer, add 19 mM Tris base, 137 mM NaCl, and 1 mL of Tween-20; adjust pH to 7.4 using HCl.
- Incubate membrane with rabbit anti-CD9 antibody at 1:5,000 ratio in 1% BSA in TBST at 4 °C overnight or for 2 h at room temperature.
- Wash the membrane 3x for 5 min each with TBST. Incubate the membrane with anti-rabbit IgG, HRP-linked secondary antibody at 1:5000 ratio in 1% BSA in TBST for 1 h at room temperature.
- Wash the membrane 3x for 5 min each with TBST. Add the commercially obtained enhanced chemiluminescence (ECL) substrates (1:1 ratio) onto the membrane and detect signals on a chemiluminescence imaging system.
4. Sample preparation for proteomics and phosphoproteomics analysis
- Prepare fresh lysis buffer containing 12 mM sodium deoxycholate (SDC), 12 mM sodium lauroyl sarcosinate (SLS), 100 mM triethylammonium bicarbonate buffer (TEAB), 10 mM tris-(2-carboxyethyl)phosphine (TCEP), 40 mM chloroacetamide (CAA), and 1x phosphatase inhibitor cocktails.
NOTE: The stock solutions are listed in the description of the Table of Materials. The lysis buffer is prepared by adding the stock solutions to achieve the desired concentrations depending on the required volume. - Solubilize the dried EV sample in 100 µL of lysis buffer and heat the sample for 10 min at 95 °C with shaking at 1,100 rpm.
- After cooling the sample to room temperature, dilute it five-fold by adding 400 µL of 50 mM TEAB.
- Measure the protein concentration using a BCA assay kit as per the manufacturer's instructions. Use the lysis buffer diluted five-fold with 50 mM TEAB as blank.
- Add trypsin/Lys-C mix at 1:50 w/w enzyme-to-protein ratio and incubate the sample at 37 °C overnight with shaking at 1,100 rpm.
- Add 50 µL of 10% trifluoroacetic acid (TFA) to acidify the sample.
- Add 600 µL of ethyl acetate to the samples and vortex the mixture for 2 min.
- Centrifuge the sample for 3 min at 20,000 x g and remove the upper layer (organic layer). Avoid disturbing the interface during aspiration.
- Repeat steps 4.7-4.8. Dry the aqueous phase using a vacuum centrifuge concentrator.
- Resuspend the dried sample in 200 µL of 0.1% TFA to acidify peptides and desalt the sample using a C18 desalting tip according to the manufacturer's instructions. Condition the tip with 200 µL of 0.1% TFA in 80% acetonitrile, followed by 2x with 200 µL of 0.1% TFA. Load the acidified peptide sample into the tip and then wash the tip 3x with 200 µL of 0.1% TFA. Elute the peptides with 200 µL of 0.1% TFA in 80% acetonitrile.
- Dry the eluate using a vacuum centrifuge concentrator. Dry 2% of the peptide sample (equivalent to 0.2 mL of the urine sample) separately for proteomics analysis. Use the rest (98%) of the sample for phosphoproteomics analysis.
- Enrich phosphopeptides from the sample using a phosphopeptide enrichment kit according to the manufacturer's instructions. Perform the steps described below for enrichment.
- Resuspend the dried sample in 200 µL of loading buffer. Add 50 µL of the beads to the sample and shake vigorously for 20 min at room temperature. Load the sample with the beads to the fritted tip and centrifuge for 1 min at 100 x g.
- Wash the tip with 200 µL of loading buffer, followed by washing buffer 1, then washing buffer 2. Perform all three washing steps by centrifuging once for 2 min at 20 x g and once for 1 min at 100 x g.
- Put the tip with beads into a new tube to collect the eluted phosphopeptides. Add 50 µL of elution buffer to the tip and centrifuge once for 2 min at 20 x g. Add another 50 µL of elution buffer to the tip and centrifuge once for 2 min at 20 x g. Centrifuge one final time for 1 min at 100 x g.
- Dry the eluted phosphopeptides using a vacuum centrifuge concentrator.
5. LC-MS/MS analysis
NOTE: Different LC-MS/MS systems/settings and data-acquisition methods, such as data-dependent acquisition (DDA) can be used.
- Resuspend the dried proteome/phosphoproteome samples in 0.1% formic acid (solvent A) and load the samples according to the manufacturer's instructions.
- Inject the samples into trapped ion-mobility time-of-flight MS through the liquid chromatography (LC) system and use the preset standardized Whisper 40 samples per day method. Peptides are separated on a 15 cm C18 column (75 µm inner diameter, 1.9 µm particle size) as mentioned in the Table of Materials.
- For proteomics analysis, acquire data using a parallel accumulation-serial fragmentation combined with data-independent acquisition (dia-PASEF) acquisition method with a mass range per ramp spanning from 300-1200 m/z and from 0.6-1.50 1/K0 with a cycle time of 1.38 s.
- For phosphoproteomics analysis, acquire data using a dia-PASEF acquisition method with a mass range per ramp spanning from 400-1550 m/z and 0.6-1.50 1/K0 with a cycle time of 1.38 s.
- Load the raw files into proteomics software and perform signal extraction, identification, and quantitation using a library-free data independent acquisition workflow.
- For search settings, use Homo sapiens database, specific digest types with trypsin/P enzymes, 7 minimal peptide length, 52 maximum peptide length, two missed cleavage, carbamidomethyl at cysteine as fixed modification, acetyl protein N-term, oxidation at methionine, and phosphorylation at serine, threonine, and tyrosine (for phosphoproteomics analysis) as variable modifications, and 5 as maximum variable modifications. Set the FDR at PSM, peptide, and protein group to 0.01.
NOTE: Spectronaut software was used in this protocol. Other DIA data searching software such as DIA-NN and PEAKS are also commonly used. If data was acquired in DDA mode, software such as MaxQuant and Proteome Discoverer are applicable.
- For search settings, use Homo sapiens database, specific digest types with trypsin/P enzymes, 7 minimal peptide length, 52 maximum peptide length, two missed cleavage, carbamidomethyl at cysteine as fixed modification, acetyl protein N-term, oxidation at methionine, and phosphorylation at serine, threonine, and tyrosine (for phosphoproteomics analysis) as variable modifications, and 5 as maximum variable modifications. Set the FDR at PSM, peptide, and protein group to 0.01.
Results
This protocol demonstrates a comprehensive workflow from the isolation of EVs to downstream proteomics and phosphoproteomics analyses (Figure 1). The triplicate urine samples were subjected to EV isolation. The isolated EVs were characterized by western blotting and subsequently processed for mass spectrometry-based proteomics sample preparation including protein extraction, enzymatic digestion, and peptide cleanup. For phosphoproteomics analysis, the phosphopeptides were further enriched based on metal ion-functionalized soluble nanopolymers. Both peptide and phosphopeptide samples were analyzed by high-resolution ion mobility mass spectrometry under data-independent mode. The result raw files were searched against Homo sapiens database, and library-free data-independent acquisition workflow was performed for identification and MS2-level quantification.
To characterize the isolated EVs and estimate the recovery yield, we first loaded an equivalent of 0.5 mL of urine containing EVs onto the gel for western blotting to detect the EV marker CD9 (Figure 2A). In addition, we included the EVs isolated from the same volume of urine using the most used method for EV isolation, differential ultracentrifugation (DUC), for comparison. The results showed that EVtrap was able to produce much higher CD9 signals compared to DUC, indicating an effective capture of EVs by the beads. Further quantitative values for each CD9 band signal demonstrated that EVtrap achieved a recovery yield of ~99% compared to the 5-fold intensity of the direct urine control, while DUC only recovered ~1.5% of EVs (Figure 2B).
By loading 2% of each sample onto the LC-MS/MS for proteomic profiling, we identified > 11,000 unique peptides from ~2,200 unique proteins (Figure 3A), indicating that this workflow provides an in-depth coverage of EV proteome. A high degree of overlap in protein identifications across samples was observed, with 72% of unique proteins being consistently identified in all three replicates (Figure 3B). Moreover, we compared the identification results with the ExoCarta database (Figure 3C)26. Notably, out of the top 100 EV markers and proteins, we successfully identified ~90 of these EV proteins, suggesting an unbiased and complete profiling of EV proteins through this proteomics analysis. To assess the quantitative precision, we further evaluated the distribution of coefficients of variation (CV) for the protein quantification results (Figure 3D). A low medium CV (5.7%) indicates the high reproducibility and reliability of the procedure, including EV isolation, sample preparation, and MS detection.
For the phosphoproteomics analysis, we used 98% of each peptide sample for the phosphopeptide enrichment and identified ~800 unique phosphopeptides corresponding to ~350 unique phosphoproteins (Figure 4A). The enrichment yielded an average of 72% phosphoserine (pS) peptides, 22% phosphothreonine (pT), and 6% phosphotyrosine (pY) peptides, respectively (Figure 4B). In terms of the identification reproducibility of the three replicates, 42% of phosphopeptides were identified by all three analyses, and there was a ~50% overlap between every two analyses (Figure 4C). A medium CV of 21.8% was determined for the quantification of phosphopeptides, suggesting an acceptable quantitative reproducibility using this protocol (Figure 4D).
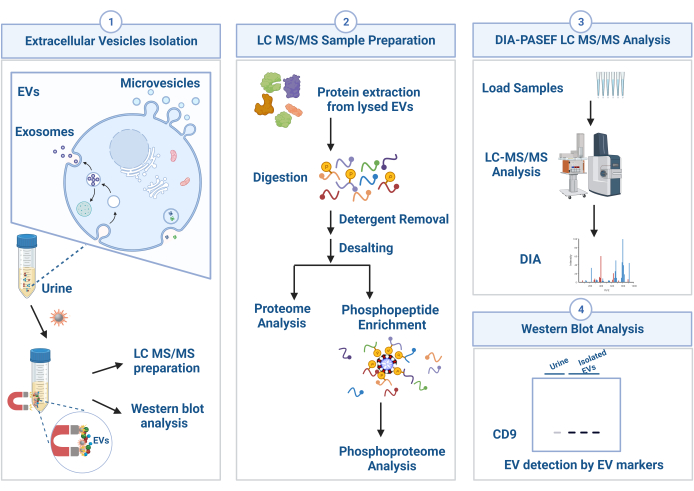
Figure 1: Schematic workflow used for isolation of urinary extracellular vesicle (EV) and downstream analyses. EVs are isolated from urine samples through the extracellular vesicles total recovery and purification (EVtrap) approach, and the isolated EVs are directly subjected to western blotting analysis. For LC-MS/MS analysis, proteins are extracted from EVs and digested into peptides. The peptide samples after the cleanup steps can be used for proteomics analysis or phosphoproteomics analysis after phosphopeptide enrichment. Both proteomics and phosphoproteomics samples are analyzed by LC-MS/MS. Identification and quantification are then performed using data independent acquisition (DIA) workflow method. Please click here to view a larger version of this figure.
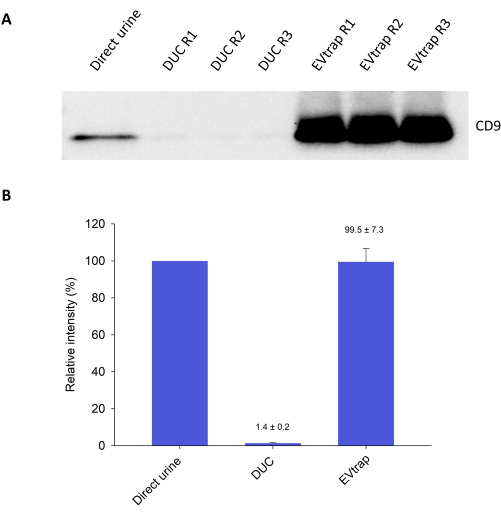
Figure 2: Characterization of isolated EVs by western blotting. (A) Detection of EV marker CD9 from 0.1 mL of direct urine sample (n=1), EVs isolated using differential centrifugation (DUC) approach (n=3), and EVs isolated using EVtrap approach (n=3). (B) Quantification of western blotting signals in (A) is presented as the percentage recovery relative to the direct urine sample (5-fold intensity = 100%). For the DUC and EVtrap samples, the bar plot displays the average intensities and standard deviations (represented by error bars) from the triplicates. Please click here to view a larger version of this figure.
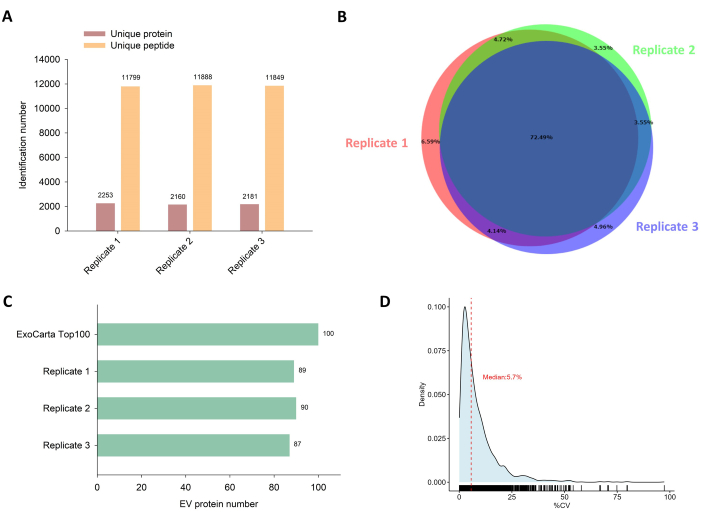
Figure 3: Proteomics analysis of isolated EVs. (A) The total number of identified unique proteins and peptides in triplicates. (B) Venn diagram showing the overlap in identified unique proteins between replicates. (C) The number of identified unique proteins corresponding to the top 100 EV markers in the ExoCarta database. (D) Density plot showing the distribution of coefficient of variation (CV) for protein quantification. The median CV value is highlighted with a red dashed line. Please click here to view a larger version of this figure.
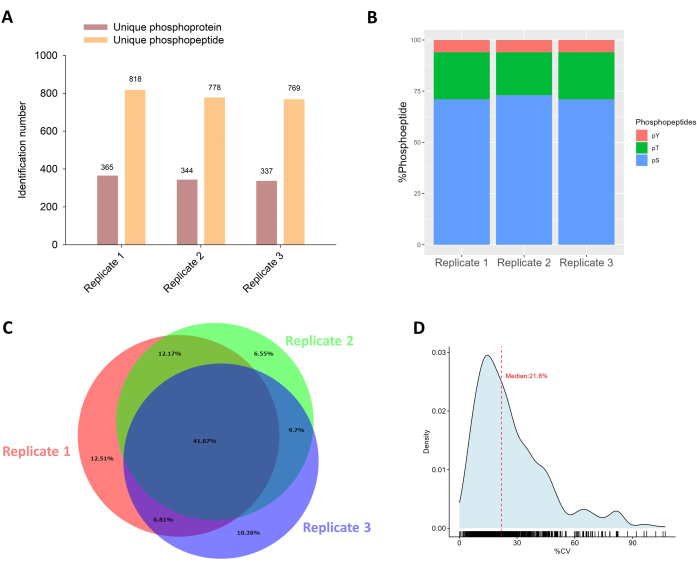
Figure 4: Phosphoproteomics analysis of isolated EVs. (A) The total number of identified unique phosphoproteins and phosphopeptides in triplicates. (B) Percentage composition of pSTY peptides after phosphopeptide enrichment. (C) Venn diagram showing the overlap in identified unique phosphopeptides between replicates. (D) Density plot showing the distribution of CV for phosphopeptide quantification. The median CV value is highlighted with a red dashed line. Please click here to view a larger version of this figure.
Discussion
Effective EV isolation is an essential prerequisite to detecting low-abundant proteins and phosphoproteins in EVs. Despite the development of numerous methods to fulfill this need, the majority still suffer from limitations such as poor recovery or low reproducibility, which impede their utilization in large-scale studies and routine clinical settings. DUC is generally considered as the most common method for EV isolation, and the additional washing steps are normally applied to help increase the purity of target EVs27,28. This procedure leads to a more tedious and time-consuming DUC process (> 6 h). Moreover, low EV recovery yield after DUC has been reported by multiple studies,29,30 and shown in the results in Figure 2. In comparison, EVtrap offers efficient EV isolation (< 1 h) and a high recovery yield (Figure 2). Notably, the successful application of this workflow marks a crucial advancement for the identification of significant EV markers for various diseases and cancers19,21,22 However, EVtrap is incapable of isolating specific subpopulations of EVs, such as microvesicles or exosomes, as it captures the entire EV population.
In this protocol, we used 2% and 98% of the peptide sample for proteomics and phosphoproteomics analyses. Since the EVs isolated from 10 mL of urine by EVtrap typically yield 100-200 µg of total proteins, 98% of the peptides after digestion and cleanup is sufficient for the phosphopeptide enrichment. If a labeling step, such as tandem mass tag (TMT) labeling, is required for quantitative MS analysis, peptide concentration measurement following the desalting step can be performed to normalize the peptide amount and improve the accuracy of quantification31.
While this protocol primarily highlights the use of EVtrap for isolating urinary EVs, it is noteworthy to mention that the versatility of this approach has been demonstrated in processing various sample types32,33,34. Based on previous results, the condition used in this protocol was applicable to isolate EVs from cell culture media. For the isolation of cell-secreted EVs, the cells are cultivated under fetal bovine serum (FBS)-free or EV-depleted FBS conditions to prevent co-isolation of excessive FBS-derived EVs with cell-secreted EVs, which will undermine the reliability of results35. Additionally, the isolated EVs from other sample types can be characterized by western blotting analysis using several common EV markers, including CD9, CD63, CD81, tumor susceptibility gene 101 protein (TSG101), and ALG-2-interacting protein X (ALIX)36.
To increase coverage and improve quantification in MS analysis, building a project-specific library for searching DIA data is an alternative option. Due to the complexity of the spectra produced in the DIA mode, a spectral library containing a collection of reference spectra is beneficial for increasing identification confidence and improving coverage. High-quality spectral libraries can be generated by performing DDA analysis on the same samples or pre-fractionated samples37. The library can also be used to determine optimal windows for dia-PASEF and further improve identification38.
Taken together, the presented protocol provides a simple and effective method for isolating EVs from urine samples for proteomics and phosphoproteomics analyses. By implementing this protocol, we expect improved detection of low-abundant EV proteins and phosphoproteins as biomarkers for early-stage disease detection and longitudinal monitoring. Furthermore, researchers have the great opportunity to advance the field of EV research and contribute to better diagnostic and therapeutic strategies.
Disclosures
The authors declare a competing financial interest. Anton Iliuk and W. Andy Tao are co-founders of Tymora Analytical Operations, which developed EVtrap beads and commercialized PolyMAC phosphopeptide enrichment kit.
Acknowledgements
This work has been funded in part by NIH grants 3RF1AG064250 and R44CA239845.
Materials
| Name | Company | Catalog Number | Comments |
|---|---|---|---|
| 1.5 mL microcentrifuge tube | Life Science Products | M-1700C-LB | |
| 1.5 mL tube magnetic separator rack | Sergi Lab Supplies | 1005 | |
| 15 mL conical centrifuge tube | Corning | 352097 | |
| 15 mL tube magnetic separator rack | Sergi Lab Supplies | 1002 | |
| Anti-rabbit IgG, HRP-linked Antibody | Cell Signaling Technology | 7074P2 | |
| Benchtop incubated shaker | Bioer | DIS-87999-3367802 | Bioer Thermocell Mixing Block MB-101 |
| CD9 (D3H4P) Rabbit mAb | Cell Signaling Technology | 13403S | |
| Chloroacetamide | Sigma -Aldrich | C0267-100G | Used for alkylation of reduced sulfide groups. Freshly prepare 400 mM in water as stock solution. |
| Ethyl acetate | Fisher Scientific | E145-4 | Precipitates detergents |
| Evosep One | Evosep | Liquid chromatography system | |
| Evotips | Evosep | EV2013 | Sample loading for Evosep One system |
| EVtrap | Tymora Analytical | Functionalized magnetic beads, loading buffer, and washing buffer | |
| Immobilon-FL PVDF Membrane | Sigma -Aldrich | IPFL00010 | Blotting membrane |
| NuPAGE 4-12% Bis-Tris Gel | Invitrogen | NP0322BOX | Invitrogen NuPAGE 4 to 12%, Bis-Tris, 1.0 mm, Mini Protein Gel, 12-well |
| NuPAGE LDS Sample Buffer (4X) | Invitrogen | NP0007 | |
| PBS | ThermoFisher | 10010023 | |
| Pepsep C18 15 x 75 x 1.9 | Bruker | 1893473 | Separation column |
| Phosphatase Inhibitor Cocktail 2 | Sigma -Aldrich | P5726-5ML | 100X, Phosphotase inhibitor. |
| Phosphatase Inhibitor Cocktail 3 | Sigma -Aldrich | P0044-1ML | 100X, Phosphotase inhibitor. |
| Pierce BCA Protein Assay Kit | ThermoFisher | 23225 | |
| Pierce ECL Western Blotting Substrate | ThermoFisher | 32106 | HRP substrate |
| PolyMAC phosphopeptide enrichment kit | Tymora Analytical | Polymer-based metal ion affinity capture (PolyMAC) for phosphopeptide enrichment | |
| Sodium deoxycholate | Sigma -Aldrich | D6750-10G | Detergent for lysis buffer. Prepare 120 mM in water as stock solution. |
| Sodium lauroyl sarcosinate | Sigma -Aldrich | L9150-50G | Detergent for lysis buffer. Prepare 120 mM in water as stock solution. |
| timsTOF HT | Bruker | Trapped ion-mobility time-of-flight mass spectrometry | |
| TopTip C-18 (10-200 μL) tips | Glygen | TT2C18.96 | Desalting method |
| Triethylamine | Sigma -Aldrich | 471283-100ML | For EV elution. |
| Triethylammonium bicabonate buffer | Sigma -Aldrich | T7408-100ML | 1 M |
| Trifluoroacetic acid | Sigma -Aldrich | 302031-100ML | |
| Tris-(2-carboxyethyl)phosphine hydrochloride | Sigma -Aldrich | C4706 | Used for reducion of disulfide bonds. Prepare 200 mM in water as stock solution. Aliquot the stock solution into small volume and store it in at-20°C (avoid multiple freeze-thaw cycles). |
| Trypsin/Lys-C MIX | ThermoFisher | PIA41007 |
References
- Abels, E. R., Breakefield, X. O. Introduction to extracellular vesicles: Biogenesis, RNA cargo selection, content, release, and uptake. Cell Mol Neurobiol. 36 (3), 301-312 (2016).
- Maacha, S., et al. Extracellular vesicles-mediated intercellular communication: roles in the tumor microenvironment and anti-cancer drug resistance. Mol Cancer. 18 (1), 55(2019).
- van Niel, G., D’Angelo, G., Raposo, G. Shedding light on the cell biology of extracellular vesicles. Nat Rev Mol Cell Biol. 19 (4), 213-228 (2018).
- Becker, A., et al. extracellular vesicles in cancer: cell-to-cell mediators of metastasis. Cancer Cell. 30 (6), 836-848 (2016).
- Bebelman, M. P., Smit, M. J., Pegtel, D. M., Baglio, S. R. Biogenesis and function of extracellular vesicles in cancer. Pharmacol Ther. 188, 1-11 (2018).
- Urabe, F., et al. Extracellular vesicles as biomarkers and therapeutic targets for cancer. Am J Physiol Cell Physiol. 318 (1), C29-C39 (2020).
- Chang, W. H., Cerione, R. A., Antonyak, M. A. Extracellular Vesicles and Their Roles in Cancer Progression. Methods Mol Biol. 2174, 143-170 (2021).
- Chen, I. H., et al. Phosphoproteins in extracellular vesicles as candidate markers for breast cancer. Proc Natl Acad Sci U S A. 114 (12), 3175-3180 (2017).
- Harsha, H. C., Pandey, A. Phosphoproteomics in cancer. Mol Oncol. 4 (6), 482-495 (2010).
- Singh, V., et al. Phosphorylation: Implications in Cancer. Protein J. 36 (1), 1-6 (2017).
- Delom, F., Chevet, E. Phosphoprotein analysis: from proteins to proteomes. Proteome Sci. 4, 15(2006).
- Thingholm, T. E., Jensen, O. N., Larsen, M. R. Analytical strategies for phosphoproteomics. Proteomics. 9 (6), 1451-1468 (2009).
- Taylor, D. D., Shah, S. Methods of isolating extracellular vesicles impact down-stream analyses of their cargoes. Methods. 87, 3-10 (2015).
- Witwer, K. W., et al. Standardization of sample collection, isolation and analysis methods in extracellular vesicle research. J Extracell Vesicles. 2, (2013).
- Zeringer, E., et al. Methods for the extraction and RNA profiling of exosomes. World J Methodol. 3 (1), 11-18 (2013).
- Mathivanan, S., et al. Proteomics analysis of A33 immunoaffinity-purified exosomes released from the human colon tumor cell line LIM1215 reveals a tissue-specific protein signature. Mol Cell Proteomics. 9 (2), 197-208 (2010).
- Enderle, D., et al. Characterization of RNA from exosomes and other extracellular vesicles isolated by a novel spin column-based method. PLoS ONE. 10 (8), e0136133(2015).
- Wu, X., Li, L., Iliuk, A., Tao, W. A. Highly Efficient Phosphoproteome Capture and Analysis from Urinary Extracellular Vesicles. J Proteome Res. 17 (9), 3308-3316 (2018).
- Iliuk, A., et al. Plasma-derived extracellular vesicle phosphoproteomics through chemical affinity purification. J Proteome Res. 19 (7), 2563-2574 (2020).
- Iliuk, A. B., Martin, V. A., Alicie, B. M., Geahlen, R. L., Tao, W. A. In-depth analyses of kinase-dependent tyrosine phosphoproteomes based on metal ion-functionalized soluble nanopolymers. Mol Cell Proteomics. 9 (10), 2162-2172 (2010).
- Hadisurya, M., et al. Quantitative proteomics and phosphoproteomics of urinary extracellular vesicles define diagnostic and prognostic biosignatures for Parkinson’s Disease. Commun Med. 3 (1), 64(2023).
- Hadisurya, M., et al. Data-independent acquisition phosphoproteomics of urinary extracellular vesicles enables renal cell carcinoma grade differentiation. Mol Cell Proteomics. 22 (5), 100536(2023).
- Wu, X., Liu, Y. K., Iliuk, A. B., Tao, W. A. Mass spectrometry-based phosphoproteomics in clinical applications. Trends Analyt Chem. 163, 117066(2023).
- Mathieu, M., et al. Specificities of exosome versus small ectosome secretion revealed by live intracellular tracking of CD63 and CD9. Nat Commun. 12 (1), 4389(2021).
- Mahmood, T., Yang, P. C. Western blot: technique, theory, and trouble shooting. N Am J Med Sci. 4 (9), 429-434 (2012).
- Keerthikumar, S., et al. ExoCarta: A web-based compendium of exosomal cargo. J Mol Biol. 428 (4), 688-692 (2016).
- Théry, C., Amigorena, S., Raposo, G., Clayton, A. Isolation and characterization of exosomes from cell culture supernatants and biological fluids. Curr Protoc Cell Biol. 3 (22), (2006).
- Livshits, M. A., et al. Isolation of exosomes by differential centrifugation: Theoretical analysis of a commonly used protocol. Sci Rep. 5, 17319(2015).
- Konoshenko, M. Y., Lekchnov, E. A., Vlassov, A. V., Laktionov, P. P. Isolation of extracellular vesicles: general methodologies and latest trends. BioMed Res Int. 2018, (2018).
- Webber, J., Clayton, A. How pure are your vesicles. J Extracell Vesicles. 2, (2013).
- Erdjument-Bromage, H., Huang, F. K., Neubert, T. A. Sample preparation for relative quantitation of proteins using tandem mass tags (TMT) and mass spectrometry (MS). Methods Mol Biol. 1741, 135-149 (2018).
- Charles Jacob, H. K., et al. Identification of novel early pancreatic cancer biomarkers KIF5B and SFRP2 from “first contact” interactions in the tumor microenvironment. J Exp Clinl Cancer Res. 41 (1), 258(2022).
- Nunez Lopez, Y. O., et al. Extracellular vesicle proteomics and phosphoproteomics identify pathways for increased risk in patients hospitalized with COVID-19 and type 2 diabetes mellitus. Diabetes Res Clin Pract. 197, 110565(2023).
- Hinzman, C. P., et al. A multi-omics approach identifies pancreatic cancer cell extracellular vesicles as mediators of the unfolded protein response in normal pancreatic epithelial cells. J Extracell Vesicles. 11 (6), e12232(2022).
- Kornilov, R., et al. Efficient ultrafiltration-based protocol to deplete extracellular vesicles from fetal bovine serum. J Extracell Vesicles. 7 (1), 1422674(2018).
- Willms, E., et al. Cells release subpopulations of exosomes with distinct molecular and biological properties. Sci Rep. 6, 22519(2016).
- Searle, B. C., et al. Generating high quality libraries for DIA MS with empirically corrected peptide predictions. Nat Commun. 11 (1), 1548(2020).
- Skowronek, P., et al. Rapid and in-depth coverage of the (Phospho-)proteome with deep libraries and optimal window design for dia-PASEF. Mol Cell Proteomics. 21 (9), 100279(2022).
Reprints and Permissions
