A method for the assembly of adhesive and soluble gradients in a microscopy chamber for live cell migration studies is described. The engineered environment combines antifouling surfaces and adhesive tracks with solution gradients and therefore allows one to determine the relative importance of guidance cues.
Cells can sense and migrate towards higher concentrations of adhesive cues such as the glycoproteins of the extracellular matrix and soluble cues such as growth factors. Here, we outline a method to create opposing gradients of adhesive and soluble cues in a microfluidic chamber, which is compatible with live cell imaging. A copolymer of poly-L-lysine and polyethylene glycol (PLL-PEG) is employed to passivate glass coverslips and prevent non-specific adsorption of biomolecules and cells. Next, microcontact printing or dip pen lithography are used to create tracks of streptavidin on the passivated surfaces to serve as anchoring points for the biotinylated peptide arginine-glycine-aspartic acid (RGD) as the adhesive cue. A microfluidic device is placed onto the modified surface and used to create the gradient of adhesive cues (100% RGD to 0% RGD) on the streptavidin tracks. Finally, the same microfluidic device is used to create a gradient of a chemoattractant such as fetal bovine serum (FBS), as the soluble cue in the opposite direction of the gradient of adhesive cues.
Directed cell migration is a fundamental property of many cells and is a key aspect of many normal physiological processes, including embryonic development, defense against infection and wound healing. In addition, cell migration also plays a prominent role in many diseases such as vascular disease, tumour cell metastasis and chronic inflammation1,2. While the classical states of cell migration – polarization, protrusion extension, formation of adhesion, force generation and rear retraction – are generally accepted3,4 , the elucidation of spatiotemporal mechanisms by which signal integration is coordinated has been more challenging.
The extracellular matrix (ECM) serves as a substrate for cell adhesion, and through inherent chemical5 and physical6 diversity, provides directional cues for cell navigation7,8. In addition to these adhesive cues9, soluble factors10-12 such as chemokines and growth factors can induce directed cell migration through chemoattractant receptors and their downstream motogenic signalling. Currently, it is not known whether engagement and signalling through adhesion receptors (i.e. integrins) or chemoattractant receptors, such as receptor tyrosine kinase (RTK), are dominant. Nor is it known whether hierarchies of receptor systems are cell type specific.
Live cell microscopy gives a wealth of information that is not accessible in bulk assays and can be combined with microfluidic devices to generate gradients of immobilized 13,14 and soluble cues15 16. The method described here utilizes a series of simple and established steps for surface modification in conjunction with a commercially available microfluidic chamber to create an imaging assay for cell migration that can easily be implemented in a cell biology laboratory (Figure 1). The assembled microfluidic device has optical qualities that are comparable to glass17 and the gradients of diffusible molecules are stable for at least 16 hr. The system can be used for epifluorescence and advanced microscopy techniques. Unlike other chemotaxis setups18, this system is suitable for recording slowly migrating, adherent cells. Importantly, the system is modular and easily allows the introduction of alternative adhesive or soluble migration cues and examination of various cell types.
1. Passivation of Glass Coverslips with PLL-PEG-biotin
This step is designed to passivate the surface so that cells adhere and migrate onto specific regions on the glass coverslip that are created with microcontract printing (Step 2-3a) or dip pen lithography (Step 3b). For the passivation, a co-polymer of poly-L-lysine (PLL) and polyethylene glycol (PEG) is used in which 20% of PEG molecules are grafted to biotin (PLL-PEG-biotin).
2. Fabrication of Stamps for Microcontact Printing
We describe two processes to pattern streptavidin tracks onto the passivated glass coverslips. The first one, microcontact printing, typically requires the fabrication of a silicon master from which a PDMS stamp is cast. In our case, the pattern on the PDMS stamp are 100 μm-wide lines that are spaced 290 μm center-to-center with a feature height of 25 μm. Below, we describe briefly how to fabricate a suitable silicon master (Step 2.1-2.3) and PDMS stamp (Step 2.4). However, there are multiple protocols for microcontact printing described in the literature19-23, which are suitable for printing protein patterns onto glass coverslips. Masters can also be custom made and purchased from commercial sources.
3. Patterning Streptavidin or Adhesive Cues onto Passivated Glass Coverslips
After passivating glass coverslips, protein patterns are printed with microcontact printing (Step 3a) or dip-pen lithography (Step 3b). In our case, streptavidin is printed as lines, which form the basis for RGD gradients (Step 4). The same procedure can also be used for printing matrix proteins to create adhesive patterns.
An alternative method to microcontact printing for the patterning of biomolecules onto surfaces is dip pen lithography. In dip pen lithography, a cantilever is used to transfer a small volume of solution onto the surface. The size of the cantilevers, viscosity of the solution, contact time of the cantilever on the surface, hydrophobicity of the surface and humidity in the printing chamber determine the size of the printed features. The advantage of this method is that different patterns can be printed for each experiment, as there is no need to fabricate masters and stamps. The disadvantage is that it takes longer to print a given pattern and that dip pen lithography requires a specialist instrument that may not be available in many laboratories. The dip pen lithography instrument that we used was the NanoeNabler from Bioforce Nanoscience. Here, we printed small dots that were <10 μm in diameter, for which we used SPT10 cantilevers.
3a. Microcontact Printing (μCP) Technique
3b. Dip Pen Lithography
4. Creating Adhesive Gradients onto Streptavidin-pattern Surfaces
We create adhesive gradients of biotin-RGD onto glass coverslips that are coated with streptavidin (Figure 3) or contain streptavidin patterns on passivated glass coverslips (Figure 5). To create a surface gradient, we used a commercially available microfluidic device (called sticky-Slide Chemotaxis 3D from Ibidi) that creates a stable solution gradient by passive diffusion. To compete for streptavidin binding sites, we employed two opposing gradients of biotin-RGD and biotin that was not conjugated to RGD (see Figure 1).
5. Labelling of Cells with Fluorophores for Live Cell Imaging
Cells are labelled with fluorescent dyes that assist cell tracking under the fluorescent microscope. Common probes are fluorescent organelle markers, such Syto 64 Red, which labels the cell nucleus. To do so, cells are first washed three times with PBS, then incubated with 1 μM Syto 64 Red in culture media for 45 min and finally washed a further three times with PBS. Please note that cells should not be kept in PBS for long periods of time.
Alternative dyes for cell tracking are CellTracker series that stain the cytoplasm and are retained during cell migration and division. Transfection of cells with fluorescent fusion protein is particularly useful to record the subcellular distributions of a protein of interest during migration. However, fluorescent proteins typically photo-bleach faster than organic dyes so that long-term observations may not be possible.
6. Loading of Cells with a Soluble Gradient into the Microfluidics Device
7. Live Cell Imaging and Data Analysis
To understand how cell integrate migratory signals25, we have developed a method to image cells with fluorescence microscopy that migrate in an environment with competing adhesive and soluble gradients (Figure 1). Adhesive tracks that contained fluorescent streptavidin and biotinylated RGD were created with microcontact printed tracks and dip pen lithography (Figure 2). Successful microcontact printing is indicated by the line profile of the fluorescence intensity across the tracks where adhesive tracks and anti-fouling regions can clearly be distinguished (Figure 2b). Dots printed with dip pen lithography appear rounded, not tear shaped, indicating a successful printing process. Surface chemistry and humidity influences the outcome of the printing process. Generally speaking, the more hydrophobic the surface is, the better the printing outcomes.
A gradient of adhesive cues on the printed track were created with a simple microfluidics device by loading biotin-4-fluorescein and biotin-RGD into the opposite side of a microfluidic chamber (Figure 3). Since both molecules bind competitively to the streptavidin track on the glass surface, an immobilized gradient of RGD ligands is generated. After removing the biotin/biotin-RGD solution, the same chamber can be used to introduce a soluble gradient, which is stable within the microfluidic channel for at least 16 hr (Figure 4).
We introduced HeLa cells into the chamber with a chemoattractant gradient, for which FBS was used. At low densities, HeLa cells preferentially adhered to and migrated on the streptavidin/RGD tracks (Ncells = 50) and avoided the anti-fouling PEG regions (Ncells = 19). The position of individual cells was recorded over 16 hr and analyzed with a cell tracking software. In an experiment where adhesive and soluble gradients are opposed to each other (Figure 5), the trajectories of individual cells showed that more HeLa cells migrated towards the source of the chemoattractant (red traces in Figure 5c, Ntraces = 36) than towards higher concentrations of adherent RGD (black traces in Figure 5c, Ntraces = 14). The average distance that cells migrated against (black traces) or in (red traces) the direction of the FBS gradient (x-component of average displacement of each trajectory) was 0.1700 ± 0.1172 and 0.2278 ± 0.1280, respectively (P < 0.0001, Student t-test) although there was no statistically significant difference in average displacement between the black traces (56.18 ± 32.27 μm) and the red traces (72.86 ± 45.05 μm; P > 0.05, Student t-test). HeLa cells migrate with an average speed of 17.47 ± 4.72 μm/hr in the presence of both gradient of adhesive cue (i.e. RGD) and soluble cue (i.e. FBS). The data therefore suggest that for HeLa cells, the FBS gradient determines the direction of migration while the cells maintain an intrinsic migration speed on the adhesive tracks.
We have also assessed the migration of the macrophage cell line J774. In the absence of adhesive and soluble gradients, these cells migrate at much higher speeds (38.55 ± 17.88 μm/hr) than HeLa cells (16.47 ± 4.28 μm/hr) but with less persistency i.e. J774 cells change direction (directionality of 0.059 ± 0.091), measured as the ratio of displacement to track length more often than HeLa cells (0.57 ± 0.12) on microcontact printed fibronectin tracks. J774 cells are also less contact dependent than HeLa cells. The displacement of J774 cells was higher on the PEG regions (102.20 ± 54.73 μm) than on fibronectin tracks (42.95 ± 39.90 μm). In addition, J774 cells appeared to adapt to different surface chemistry by changing their mechanism of migration from mesenchymal to amoeboid. In conclusion, adhesive cues are not as important to J774 cells as they are for HeLa cells. Both cell types preferentially migrated towards the direction of the soluble cue.
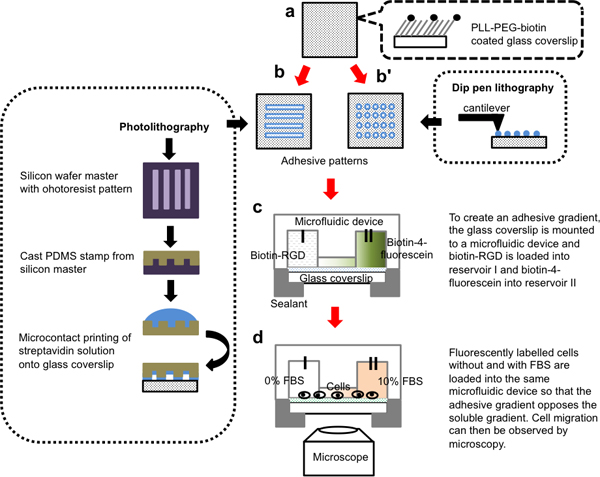
Figure 1. Schematic of the fabrication process of a microfluidic setup that allows the imaging of migrating cells responding to opposite gradients of adhesive versus soluble cues. a. Glass coverslips are passivated with biotinylated PLL-PEG. b. Adhesive patterns containing fluorescent streptavidin are printed onto the biotinylated surface either as lines using microcontact printing (b) or dots using dip pen lithography (b’). c. The modified surface is attached to the bottom of the microfluidic device. Gradients of immobilized biotin-RGD are created via reservoir I and II. d. Cells and a soluble chemoattractant gradient of 0-10% FBS are loaded into the microfluidic device. After cells adhere to the surface, live cell migration over RGD gradients on streptavidin tracks and in the presence of FBS gradients can be imaged in the channel connecting the two reservoirs.
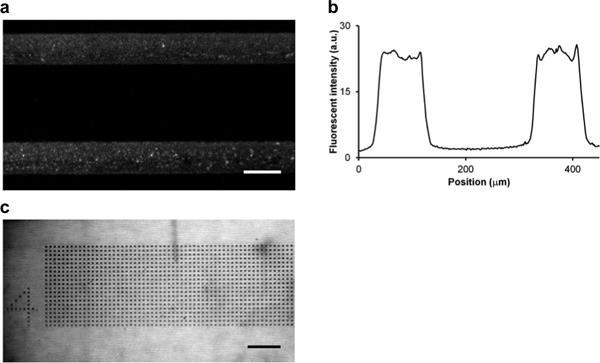
Figure 2. Cell adhesive patterns (lines and dots) can be generated with two different printing techniques. a. Fluorescent image of microcontact printed streptavidin-AlexaFluor350 tracks (Abs: 346 nm, Em: 442 nm; grey) on PLL-PEG-coated glass coverslips. The microcontract printing mask was designed as lines that were 100 μm wide with 290 μm center-to-center space. b. The average fluorescent intensity of microcontact printed streptavidin tracks, as shown in a, from five separate surfaces as cross-sections from top to bottom. The average width of the track is 90 ± 6 μm and the average center-to-center spacing is 293 ± 2 μm. c. A brightfield image of streptavidin-containing dots generated with dip pen lithography. The diameters of the dots ranged from 6 – 9 μm with 15 μm center-to-center space. Scale bars in a and c are 100 μm.
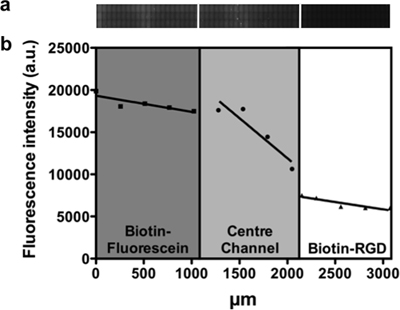
Figure 3. Biotin-4-fluorescein gradient (0 μg/μl – 0.03 μg/μl) on a glass surfaces uniformly coated with streptavidin. Biotin-4-fluorescein and biotin-RGD were loaded in either reservoir of the microfluidic device (sticky-Slide Chemotaxis 3D, Ibidi) that are connected by a 1 mm long channel. After a 1 hr incubation, the device was rinsed with PBS and refilled with PBS. a. 60 mosaic images were taken with a total image length 3,072 μm and b the fluorescence intensity was measured across the length of the entire mosaic. Linear trend lines were fitted to the fluorescence intensity to indicate the RGD gradient in the channel.
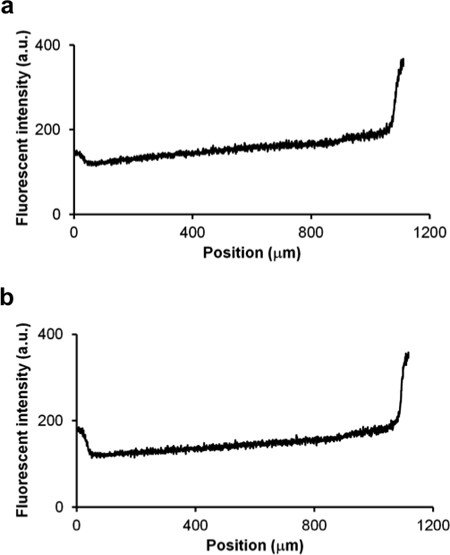
Figure 4. The fluorescence intensity of a fluorescein gradient (0 μM – 1 μM) in the microfluidic channel a immediately after setup (T = 0 hr) and b after a 16 hr incubation. PBS without and with 1 μM fluorescein was loaded from the left and right reservoir of the microfluidic device (sticky-Slide Chemotaxis 3D, Ibidi), respectively. The microfluidic channel is 1 mm in length and is found at position 50 to 1,050 μm. The gradient was stable for at least 16 hr.
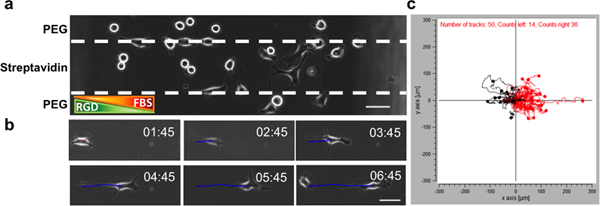
Figure 5. HeLa cell migration in a microfluidics chamber (sticky-Slide Chemotaxis 3D, Ibidi) with opposing adhesive gradient (immobilized RGD on streptavidin tracks) and soluble gradient (0-10% FBS). a. A representative image of cells in a microfluidics chamber with opposing gradients. Scale bar is 50 μm. b Time-lapse images of a cell taken with an epifluorescence microscope (Nikon Ti-E). Images were taken at 15 min intervals for 20 hr and cell trajectory (blue line) obtained via cell centroid positioning (ImageJ manual tracking plugin). Scale bar is 50 μm. c. Cell trajectory from images as shown in b. Cell trajectories that migrated towards the higher concentration of soluble FBS are shown in red (Ntraces = 36); cell trajectories that migrated towards higher concentrations of adherent RGD are shown in black (Ntraces = 14). Click here to view larger figure.
In this protocol, we used a commercially available microfluidic device (sticky-Slide Chemotaxis 3D from Ibidi) to study the effects of chemically modified surfaces and chemoattractant gradients on cell migration. This microfluidic setup does not require flow because the gradient is established by diffusion along the length of the channel. This is important because flow could differentially affect slowly migrating cells such as fibroblasts that form stable focal adhesions and fast migrating cells like most leukocytes that form small focal complexes and synapses26. Shear stress from laminar flow may affect the stability of cell adhesion to adhesive cues and cell chemotaxis towards soluble cues27,28. We found differences in migration behavior between slow moving HeLa cells and fast moving J774 cells thereby showing that the microfluidic setup is applicable for both adherent and less adherent cell types. Such comparisons also revealed interesting difference between cell types in adhesion and migration responses to surface patterns that contained both adhesive cues (RGD peptides or fibronectin) and anti-fouling regions (PEG areas).
Surface patterns were created with microcontact printing29 and dip-pen lithography30,31. Microcontact printing is a simple and relatively fast, reproducible patterning process. However, the design and fabrication of the PDMS stamp, which is achieved by photolithography, is more involved and time consuming. It also introduces its own limitations in that small features (< 5 μm) are difficult to achieve and depend on the aspect ratio of the pattern. In brief, microcontact printing is ideal for large patterns up to hundreds of micron size and in experiments, where the same patterns need to created many times. On the other hand, dip pin lithography can be used to generate micron to nanoscaled patterns. It is more suited to printing dots than lines, although lines can be fabricated. Dip pin lithography affords greater freedom in pattern designs, as there is no need for pre-fabricated masks, masters or stamps. However, the speed of the patterning process is slow, making printing of large areas cumbersome and access to a specialized instrument is crucial. The two patterning methods are relevant for consideration because the size and shape of adhesive cue patterns influence the organization and distribution of biomechanical machineries that regulate cell migration32,33. Additionally, the limitation of the commercial microfluidic device employed here is that the channel length (1 μm) cannot be altered and so one cannot control the maximum steepness of the adhesive and soluble gradients. If steeper gradients are necessary, one would need to fabricate a microfluidic device with a shorter channel between the two reservoirs. A key advantage of the protocol described here is the modular design so that different surfaces, surface chemistries, patterning approaches and microfluidic devices could be combined for a wide variety of live cell imaging experiments.
The authors have nothing to disclose.
The authors acknowledge funding from the Australian Research Council and National Health and Medical Research Council of Australia and also like to thank the Australian National Fabrication Facility for the SU-8 master for the microcontact printing. SHN is supported by the Ministry of Higher Education Malaysia and Universiti Sains Malaysia.
Name of Reagent/Material | Company | Catalogue Number | Comments |
Coverglass staining outfits | Thomas Scientific | 8542 E40 | Coverslip rack |
Oven | Binder | ED 53 series | |
Silicon wafer | Silicon Quest | 708-007 | Boron doped <100> wafer, 4″ diameter, 500 μm, single side polished |
GM1070 SU-8 photoresist | Gersteltec Sarl | ||
SU-8 developer | Gersteltec Sarl | ||
Sylgard 184 curing agent | Dow Corning | ||
Sylgard 184 elastomer prepolymer | Dow Corning | ||
PLL-PEG-biotin (20%) | SuSos AG | PLL(20)-g[3.5]-PEG(2)/PEG(3.4)-Biotin (20%) | 1 mg/ml in PBS |
Fluorescein | Sigma | 46955 | 1 mM in PBS |
Streptavidin-AlexaFluor350 | Invitrogen | S-11249 | 1 mg/ml in PBS |
Biotin-4-fluorescein | Invitrogen | B-1370 | 0.03 μg/μl in PBS |
Biotin-RGD | GenScript | SC1208 | 0.03 mg/ml in PBS |
Syto 64 Red | Invitrogen | S-11346 | 1 μM in PBS |
Sticky slide chemotaxis 3D | Ibidi | 80328 | |
200 μl Greiner yellow bevelled tip | Greiner Bio-One | 739261 | |
Vaseline | Sigma | 16415 | |
Paraffin wax, mp 55-57 °C | Sigma | 327204 | |
Nano eNabler 10 μm cantilever | BioForce | SPT-S-C-10s | |
Image J software | National Institute of Health | rsbweb.nih.gov/ij/download.html | |
Manual Tracking plugin | Fabrice Cordelières | rsb.info.nih.gov/ij/plugins/track/track.html | |
Chemotaxis and Migration Tool | Ibidi GmbH | www.ibidi.com/applications/ap_chemotaxis.html |