This protocol describes how to use quantitative Real-time PCR (QRT-PCR) to detect tumor cell specific mRNA representing metastasis within the mouse lung tissue.
Metastatic disease is the spread of malignant tumor cells from the primary cancer site to a distant organ and is the primary cause of cancer associated death 1. Common sites of metastatic spread include lung, lymph node, brain, and bone 2. Mechanisms that drive metastasis are intense areas of cancer research. Consequently, effective assays to measure metastatic burden in distant sites of metastasis are instrumental for cancer research. Evaluation of lung metastases in mammary tumor models is generally performed by gross qualitative observation of lung tissue following dissection. Quantitative methods of evaluating metastasis are currently limited to ex vivo and in vivo imaging based techniques that require user defined parameters. Many of these techniques are at the whole organism level rather than the cellular level 3-6. Although newer imaging methods utilizing multi-photon microscopy are able to evaluate metastasis at the cellular level 7, these highly elegant procedures are more suited to evaluating mechanisms of dissemination rather than quantitative assessment of metastatic burden. Here, a simple in vitro method to quantitatively assess metastasis is presented. Using quantitative Real-time PCR (QRT-PCR), tumor cell specific mRNA can be detected within the mouse lung tissue.
QRT-PCR analysis is proposed as a method for assessing tumor metastasis. This method is proposed as an alternative for users that are interested in evaluating metastasis but may not have access to specific equipment such as in vivo imaging equipment or a fluorescence capable stereoscope. A discussion of commonly used methods is presented followed by a demonstration for how QRT-PCR analysis can be used either as a separate or as a companion method to evaluate metastasis. This procedure has the potential to provide a quantitative analysis of metastatic burden.
Standard methods of gross analysis, including visualization of lungs under a stereomicroscope as well as serial sectioning followed by hematoxylin and eosin (H&E) staining of lung tissue, are quantifiable but rely heavily on user defined parameters for counting 2-5. When evaluating whole lungs using a stereomicroscope, only large surface metastases are visible and analysis requires the investigator to have reasonable knowledge of lung anatomical structure to determine what constitutes a metastatic lesion. Fluorescent labeling of tumor cells with a marker such as GFP and use of a stereomicroscope that contains a light cube with the appropriate excitation/emission maxima (e.g. near 470/510 nm for GFP) assists in this process, but only surface tumor nodules are detectable. Additionally, fluorescence from blood contamination, which is visible under the same parameters as GFP, may lead to false identification of possible metastatic lesions.
Sectioning of the lung followed by H&E staining to visualize lung metastasis is a useful method to evaluate micrometastases and other microscopic processes including immune cell infiltration but often requires use of the entire lung tissue for paraffin embedding, sectioning, and staining procedures. Therefore, downstream procedures are not ideal following this method. Although quantifiable, this procedure requires the investigator to evaluate a large number of stained lung sections per animal to ensure that the analysis accounts for the entire 3D structure of the lung. Consequently, this type of examination is time consuming, can lead to counting error, and analysis relies heavily on investigator discretion.
Several in vivo imaging techniques (e.g. MRI, PET, SPECT) are currently used to perform or test biological processes in experimental rodent models 8. In vivo bioluminescent imaging is a common method used to acquire a gross view of metastasis 9. This technique is generally applied to evaluate the presence of luciferase reporter activity due to the accumulation of tumor cells, which are engineered to contain a luciferase response element, that reside in specific organs like the mammary gland after tumor cell implantation and the lung upon spontaneous metastasis 10. Visualization of luciferase reporter activity is induced by the presence of luciferin substrate (D-luciferin). Luciferase catalyzes the oxidative decarboxylation of D-luciferin to oxyluciferin generating bioluminescence. While informative, this method is limited by several factors including substrate stability (i.e. short half-life), adequate distribution of substrate which depends on how it is delivered to experimental animals, and low sensitivity of detection 9. A main merit to this technique is that it is non-invasive, can be performed on live animals, and can lead to the detection of tumor cell metastases in multiple organs that may not have been normally harvested at dissection 9,10.
One positive aspect of in vivo imaging techniques is that the lung tissue is undisturbed allowing for secondary procedures like paraffin embedding or as presented here, QRT-PCR analysis. However, because QRT-PCR is theoretically a more sensitive measure of detection, gross evaluation may not reveal low numbers of tumor cells present in the lung. While useful, the imaging techniques described above can be substituted or supplemented with the QRT-PCR method currently described. QRT-PCR has the potential to provide a sensitive measure of tumor-derived mRNA within a lung.
The protocol follows the guidelines and animal care standards of the Medical University of South Carolina (MUSC) and its Institutional Animal Care and Use Committee (IACUC).
1. Lung Dissection
2. RNA Isolation
Note: For the representative analysis, RNA was isolated using a RNA isolation kit (see Materials List). While the current analysis uses one specific manufacturer's product, a variety of isolation kits are available from several reputable vendors. Additionally, non-kit based centrifugation methods are also an option. cDNA should also be prepared from a positive control RNA sample, such as a cell line or plasmid, for standard curve analysis. Alternatively, a positive control specific for the primer probe set may be purchased (see Materials List).
3. First Strand Synthesis
Note: For the representative analysis, the reverse transcriptase (RT) reaction was performed a First Strand cDNA synthesis kit designed for QRT-PCR (see Materials List).
4. Real-time PCR
Note: For the representative analysis, SYBR green was used. However, any preferred method can be substituted at the user's discretion.
Beyond the time it takes to perform the initial inoculation of tumor cells into the experimental animal and if performing, primary in vivo tumor analysis, the tissue harvest, RNA isolation, and QRT-PCR analysis is a 1-2 day procedure (Figure 1).
An example of gross analysis is bioluminescent imaging to evaluate tumor cells within the lung tissue. Here, a mammary tumorigenesis experiment was performed to evaluate whether an investigational agent that targets the gap junction protein connexin43, called ACT1, would impair spontaneous metastasis of 4T1-luc mammary tumor cells to the lung. After several weeks of treatment, animals that received placebo or the test agent were injected with luciferin and sacrificed. Upon dissection, lungs were visualized for luciferase bioluminescence. From the representative images it appears that lungs from the drug treated animals are negative for luciferase activity which indicates that no tumor cells are present in the lung, suggesting an inhibition of metastasis after ACT1 treatment (Figure 2A). The main purpose of these representative images is to demonstrate that bioluminescent imaging is an appropriate method of detection for metastasis. However, upon detailed investigation of H&E sections of lungs from animals treated with ACT1, micrometastases were identified that were not illuminated by the luciferase imaging (Figure 2B), perhaps suggesting that this type of imaging may not be sensitive enough to detect low numbers of tumor cells embedded within the lung. Ideally, a companion analysis for QRT-PCR would be performed to confirm these results.
The QRT-PCR analysis presented here uses a probe specific for human HER2 to detect human tumor cells in the lung from HER2+ JIMT-1 cells that were originally transplanted into the mammary fat pad of host animals (Figure 3). Metastasis occurred spontaneously after tumor development. Upon dissection, when viewed under a stereomicroscope, no grossly visible metastases were observed on any of the lungs. However, based on the subsequent QRT-PCR analysis it appears that two of the eleven lungs harvested from tumor bearing animals harbored metastases, denoted by the arrows in Figure 3, suggesting that tumor cells that were undetected by visualization are present. cDNA derived from a piece of JIMT-1-derived tumor was used as a positive control for HER2 expression (Figure 3, (+)) and a lung from a mouse that was not injected with tumor cells was used as a negative control (Figure 3, (-)). A mouse specific probe for gapdh was used as an internal control to determine the proportion of human tumor cells to total mouse lung tissue. The positive control sample was normalized to the gapdh levels from the control lung as a reference. An alternate normalization strategy would be to average the amount of gapdh across all lung samples to acquire more consistent normalization levels for control samples. Alternative probes for non-mouse and non-human genes, such as GFP could be substituted to detect tumor cells that have been labeled accordingly, prior to introduction into the mouse.
A secondary analysis was also performed to provide a relative quantitation of total tumor cell number present in the lung. These results are shown in Figure 4. Here, a standard curve analysis was prepared to determine the relative HER2 quantity normalized to mouse lung gapdh in a cell number series. In theory, this allows the researcher to determine the relative amount of HER2 in 1×10⁶, 1×10⁵, 1×10⁴, 1×10³, 1×10², and 10 cells. The results show that the QRT-PCR probe and analysis performed was sensitive enough to detect HER2 levels in as low as 10 cells (Figure 4A). The resulting calculated HER2 values were plotted on a log-scale and a simple linear regression analysis was used to determine the relative cell number in each lung sample, as well as the positive and negative controls. As shown in Figure 4B, cell number specific values were generated for the experimental samples.
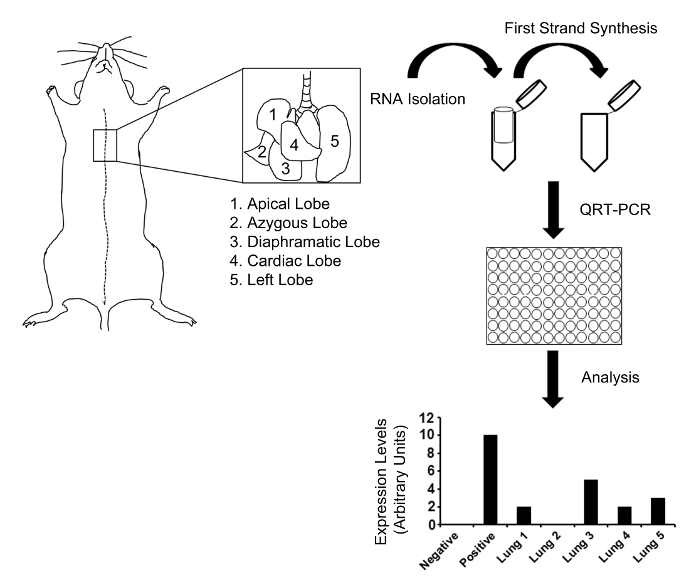
Figure 1. Schematic representation of lung dissection and analysis. The mouse lung contains 5 lobes, as indicated by the inset enlarged drawing. From dissection to analysis the QRT-PCR procedure generally takes 1-2 days to complete. Please click here to view a larger version of this figure.
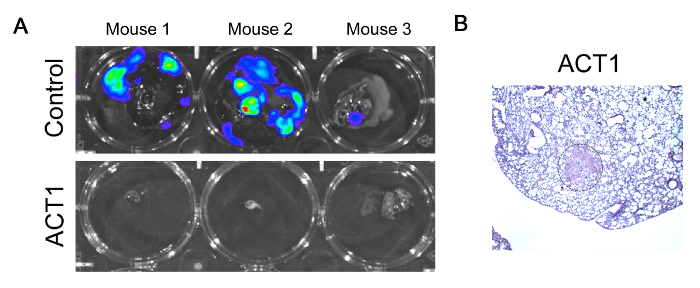
Figure 2. Gross analysis of metastasis. (A) Representative bioluminescent images of lungs from animals that were injected with 4T1-luc cells and treated with either placebo or an investigational drug called ACT1 that targets the gap junction protein, connexin43. (B). Representative H&E section of a micrometastasis in the lung of an animal with a 4T1 tumor that was treated with ACT1. Please click here to view a larger version of this figure.
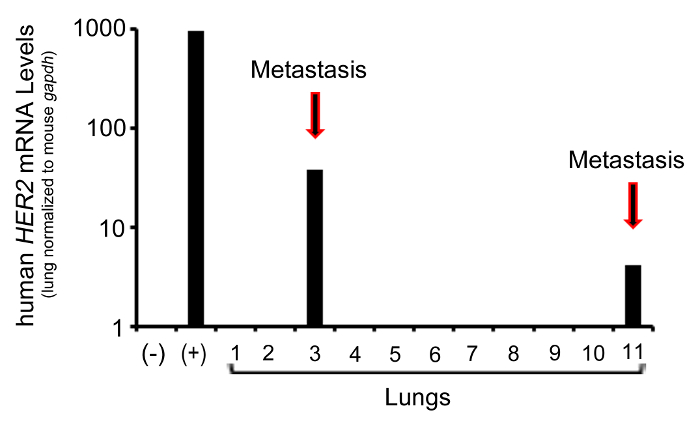
Figure 3. Representative QRT-PCR analysis. Bar graph representing the quantitated data from the QRT-PCR analysis of human HER2, a gene present in the JIMT-1 human breast cancer cell line. Human HER2 levels in the lung are normalized to mouse gapdh. (+) denotes positive control. (-) denotes negative control. Results are plotted on a log-scale. Please click here to view a larger version of this figure.
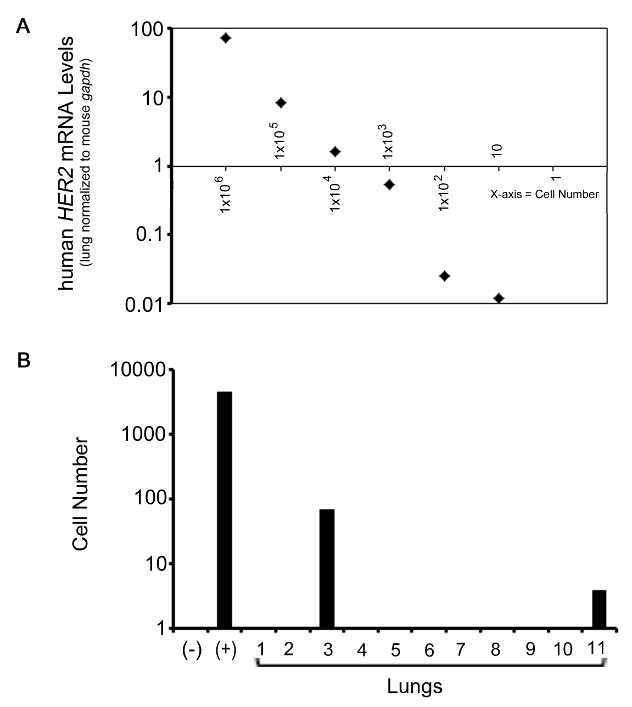
Figure 4. Representative QRT-PCR analysis from cell number analysis. (A) Graph representing HER2 levels in relation to the cell number quantity of JIMT-1 cells from 1×10⁶ to 10 cells. (B) Bar graph representing the quantitated data from the QRT-PCR analysis of human HER2, a gene present in the JIMT-1 human breast cancer cell line. Human HER2 levels in the lung are normalized to mouse gapdh. (+) denotes positive control. (-) denotes negative control. Results are plotted on a log-scale. Please click here to view a larger version of this figure.
Template RNA | 0.5-2 µg |
iScript Supermix | 4 µl/sample |
Nuclease-free water | up to 20 µl/sample |
Table 1. First Strand Synthesis reaction mix components (step 3.3.1).
Step 1: 25 °C | 5 min |
Step 2: 42 °C | 30 min |
Step 3: 85 °C (termination) | 5 min |
Table 2. PCR conditions for First Strand Synthesis (step 3.3.3).
iTAQ Master Mix | 10 µl/sample |
Primer Mix | 1 µl/sample |
Nuclease Free water | up to 20 µl/sample |
Table 3. Real-time PCR reaction mix components (step 4.3).
Step 1 | Activation | 95 °C | 2 min | 1 cycle |
Step 2 | Denaturation | 95 °C | 5 sec | 40 cycles |
Annealing/Extension | 60 °C | 30 sec | ||
Step 3 | Melt Curve (optional) | 65-95 °C (0.5 increments) | 5 sec/step |
Table 4. Real-time PCR conditions (step 4.5).
This protocol describes use of QRT-PCR to evaluate mammary tumor cell metastasis to the lung using a xenograft mouse model. It is acknowledged that other techniques, including bioluminescent imaging, are available and are also effective for detecting metastasis despite having their own values and limitations. The data presented suggests that QRT-PCR provides an effective measure of detecting tumor-derived mRNA within lung tissue for quantitation of total metastasis. It is proposed that QRT-PCR analysis provides a secondary method that can complement or be performed in lieu of these imaging techniques. This technique may be best suited for research environments with limited access to certain types of equipment or for research groups with specific interests in metastatic burden but not detailed mechanistic studies.
While informative, the QRT-PCR analysis described here has limitations. It is not possible to perform additional downstream analysis, including immunohistochemistry (IHC) or immunofluorescence (IF) staining because the entire lung tissue is used for RNA isolation. However, if paired with an in vivo imaging technique the lung tissue may be isolated post-imaging to perform this secondary type of analysis. Also, this technique is limited to detecting mRNA and thus protein analysis is not possible unless a multi-prep isolation kit is used to prepare the lung tissue. The analysis of resulting protein is still limited to having to evaluate a total protein mix that includes the tumor and lung tissue all in one, whereas IHC/IF allows the user to delineate proteins stained in tumor tissue from staining found in mouse tissue based on the visualization of the IHC/IF staining. Alternative to using the whole lung, maintaining half of the lung tissue for other analysis such as histology may be beneficial but runs the risk of conflicting findings if metastases are identified in one portion of the lung and not the other.
Several points of modification and troubleshooting are recommended. The accuracy of the QRT-PCR data is dependent on the primer probe that is chosen for the assay and optimization of probes is recommended including the use of a proper standard curve analysis for transcript quantitation. Additionally, it is important to gauge the quality of the RNA that is isolated. Over-digestion of tissue with proteinase K can reduce the RNA quality and thus optimization is recommended based on the specific tissue of interest and method of RNA preparation. Choosing an appropriate housekeeping reference gene is also important. While gapdh is a commonly used reference gene, every gene serves a normal function in the cell that could be altered due to experimental conditions (i.e. genetic modification of host animals such as gene knockout) and thus alternative choices are useful. Some common reference genes that are reported to have ubiquitous expression and low variation in quantity are the genes encoding TATA-box binding protein (tbp), Retinitis Pigmentosa 2 (rp2), Actin-like protein (Act), and Tubby bipartite transcription factor(Tub)11. Furthermore, the critical steps that assure accurate analysis include accurate dissection and washing of the lung (step 1.2.2-1.2.6), correct quantitation of the total RNA isolated (step 3.2), and accurate pipetting during the QRT-PCR setup (step 4.4). Use of a repeat pipettor can aid in this process.
In summary, this protocol aims to demonstrate that QRT-PCR is a quantifiable method to identify lung metastases. Both positive value and limitations are identified with the use of this procedure and it may be best suited to be paired with a secondary method of analysis. However, this method could be a straight forward procedure of quantitation for those research laboratories with specific research needs or lack of extensive equipment to investigate metastasis. . Future applications of this method include modification to look for metastases in target organs beyond the lung, such as lymph node or brain, which are other common sites of metastasis.
The authors have nothing to disclose.
The Yeh lab is supported by research funding from an American Cancer Society Institutional Research Grant (IRG-97-219-14) awarded to the Hollings Cancer Center at MUSC, by research funding from a Department of Defense grant (W81XWH-11-2-0229) at MUSC, and by an award from the Concern Foundation (to ESY).
2-mercaptoethanol | Fisher | BP176-100 | |
DNAse | Thermo Scientific | EN0521 | |
GeneJet RNA Isolation Kit | Thermo Scientific | K0732 | |
iScript Reverse Transcription Supermix for QRT-PCR | Bio-Rad | 1708841 | |
iTaq Universal SYBR Green Supermix | Bio-Rad | 172-5121 | |
PrimePCR SYBR Green Assay: ERBB2, Human | Bio-Rad | 100-25636 | |
PrimePCR Template for SYBR Green Assay: ERBB2, Human | Bio-Rad | 100-25716 | |
gapdh Primer Sequence | For-ATGGTGAAGGTCGGTGTGAACG Rev-CGCTCCTGGAAGATGGTGATGG |