NOTE: Prior to fixation, all steps are completed in a sterile laminar flow hood.
1. 2D matrix
NOTE: 2D matrices are used to determine the percentage of cells forming invadosomes and the matrix degradation area per cell.
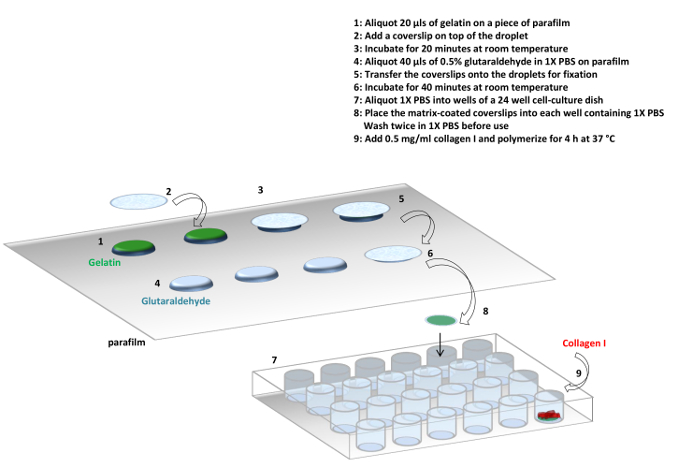
Figure 1: Protocol. Summary of the protocol used to prepare gelatin and collagen I matrices. It is possible to make the gelatin matrix only or a gelatin and collagen I mixed matrix. Please click here to view a larger version of this figure.
- Gelatin matrix
NOTE: Fluorescent gelatin matrices are used to quantify matrix degradation, and non-fluorescent gelatin is used to promote the adhesion of collagen I fibers. Fluorescent gelatin matrices are also used for podosome and invadopodia studies (see Figure 1).- Under a sterile laminar flow hood, place a piece of parafilm (20 cm x 15 cm) on the work area and disinfect it with 70% ethanol.
- Aliquot 20 µL droplets of 1 mg/mL gelatin in a line, spaced approximately 1 cm apart; refer to Figure 1 for droplet organization.
- Cover each 20 µL gelatin droplet with an autoclaved glass coverslip (12 mm in diameter).
- Incubate for 20 min at room temperature. If the gelatin is fluorescent, protect it from light.
- Aliquot 40 µL droplets of 0.5% glutaraldehyde in 1x phosphate-buffered saline (PBS) in a line, each spaced approximately 1 cm below the line of coverslips from step 1.1.3.
CAUTION: Glutaraldehyde is a toxic fixative agent. Use gloves and do not inhale. - Using jeweled forceps, transfer each gelatin-coated coverslip to a glutaraldehyde droplet.
NOTE: It is normal that a small gelatin droplet remains on the parafilm. Do not reuse this for another experiment. - Incubate for 40 min at room temperature. For fluorescent coverslips, protect them from light.
- Take a 24-well cell culture plate and fill each well with 500 µL of sterile 1x PBS. Place the coverslips, gelatin side up, into each well.
- Wash twice in 1x PBS for 5 min each.
NOTE: At this step, the coverslips can be used for experimentation or stored in 1x PBS at 4 °C. Non-fluorescent coverslips can be stored for one week, and fluorescent coverslips can be stored for 48 h.
- Fibrillar collagen type I matrix
NOTE: Fibrillar collagen type I matrix is used to study linear invadosome formation and the associated matrix degradation. A combination of fluorescent collagen I and non-fluorescent gelatin coverslips is used to colocalize invadosome markers with collagen fibers (e.g., F-actin in the far-red channel, collagen I in the red channel, Tks5 in the green channel, and Hoechst dye for a nuclear stain). On the other hand, a combination of non-fluorescent collagen I with non-fluorescent gelatin coverslips is used to maximize the number of invadosome markers stained (e.g., F-actin in the far-red channel, cortactin in the red channel, Tks5 in the green channel, and Hoechst dye for a nuclear stain). Finally, a combination of non-fluorescent collagen I with fluorescent gelatin coverslips is used to quantify the gelatin-associated degradation (e.g., F-actin in the far-red channel, Tks5 in the red channel, in the green channel, and Hoechst dye for a nuclear stain) (see Figure 1). Hoechst dye is used to stain the nucleus, and it also checks for mycoplasma contamination, in addition to a PCR test done regularly on the cell lines used.- Fluorescent collagen I
- Use commercial collagen I extracted from rat-tail tendon in 0.02 N acetic acid. Withdraw the quantity of collagen I necessary to prepare 500 µL of solution per coverslip at a final concentration of 0.4 mg/mL of collagen I.
- Add 5-carboxy x rhodamine succinimidyl ester at a final concentration of 10 µg/mL, calculated for the final volume of collagen I solution (n x 500 µL).
- Mix the solution by pipetting up and down and incubate for 5 min at room temperature, protected from light.
- Dilute to the final volume with 1X Dulbecco's Phosphate-Buffered Saline (DPBS) containing calcium and magnesium, and use directly.
- Fibrillar collagen I coverslip
- Use the non-fluorescent or fluorescent gelatin coverslips previously prepared in step 1.1.
- Prepare a solution of fluorescent or non-fluorescent collagen I at a final concentration of 0.4 mg/mL in 1X DPBS containing calcium and magnesium.
- Add 500 µL of fluorescent or non-fluorescent collagen I solution per coverslip in a 24-well cell culture plate.
- Incubate for 4 h at 37 °C for collagen I polymerization.
- After incubation, remove the excess collagen I by tilting the plate and pipetting on the side of the well (not directly on the coverslip) to avoid damaging the matrix.
NOTE: This matrix cannot be stored. Seed the cells immediately after removing excess collagen I.
- Fluorescent collagen I
2. Cell seeding, time of culture, and fixation
- Depending on the cell type, prepare the cells in the appropriate culture medium and add cells for a final volume of 500 µL per well.
- To characterize the ability of a cell line to form linear invadosomes and to degrade the matrix, plate the cells for 4 h, 12 h, and 24 h on collagen I matrix to determine the kinetics of linear invadosome formation and the associated degradation activity.
NOTE: Table 1 contains examples of cell lines tested in the laboratory.
Table 1: Cell seeding and incubation time reference. This table presents a non-exhaustive list of cell lines used to study linear invadosomes. It indicates the number of cells to seed on the matrix, the time necessary to observe linear invadosomes, and the time necessary to observe the associated matrix degradation. Linear invadosomes have a short lifetime. To be able to observe linear invadosomes in the maximum number of cells, the cells have to be in contact with the collagen I matrix for a short period of time. On the other hand, to be able to visualize the reported gelatin degradation, the cells must be in contact with the collagen I matrix for a longer period of time than those listed above.Cell line Number of cells per coverslip Time of contact with matrix for linear invadosome quantification Time of contact with matrix for quantification of linear invadosome degradation activity MDA MB 231 40,000 4 h 12 h HUH7 40,000 12 h 24 h HEP 3B 40,000 12 h 24 h SNU 398 40,000 12 h 24 h NIH 3T3 src 30,000 4 h 12 h A431 50,000 6 h 24 h A549 40,000 12 h 24 h RAW 40,000 12 h 12 h PAE 40,000 12 h 12 h - After the removal of the cell culture medium, fix the coverslips for 10 min in 500 µL of 4% paraformaldehyde in 1X PBS.
- Wash twice with 1x PBS.
- Store at 4 °C, protected from light.
3. Immunofluorescence
- Permeabilize the cells for 10 min with a freshly prepared solution of 0.2% Triton X-100 in 1x PBS. Do not reuse this solution.
- Wash the coverslips twice with 1x PBS.
- Place a piece of parafilm (20 cm x 15 cm) on the bench.
- Dilute primary antibody in 4% bovine serum albumin (BSA) in 1x PBS, as described in the Materials Table.
- Aliquot 50 µL droplets of primary antibody solution in a line, each spaced approximately 1 cm apart.
- Place each coverslip on a droplet.
- Incubate for 40 min at room temperature, protected from light.
- After the incubation period, wash twice with 1x PBS.
- Dilute the secondary antibody, phalloidin, and Hoechst dye in 4% BSA in 1x PBS.
- Aliquot 50 µL droplets of the mix, each spaced approximately 1 cm below the first line of coverslips, as done previously.
- Place each coverslip on a droplet.
- Incubate for 30 min at room temperature, protected from light.
- After incubation, wash twice with 1x PBS.
- Wash once with distilled water to remove the salts.
- Mount the coverslips on a glass slide with polymerizing mounting medium.
- Let the coverslips dry overnight at room temperature, protected from light, before microscopy.
4. Quantifications
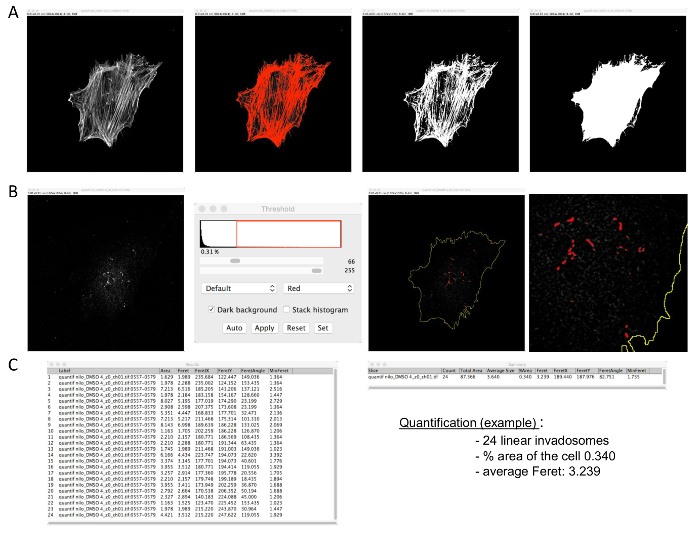
Figure 2: Linear invadosome quantification. The macro requires confocal images of F-actin and Tks5 staining (format: 1,024 x 1,024). (A) First, open the F-actin picture and make a mask. (B) Then, open the Tks5 picture and threshold it. Apply the macro. (C) Analyzed results will appear in two tables. The number of linear invadosomes per cell and other information, such as the percentage area used by linear invadosomes in the cell, will be in the Summary table. The size of each linear invadosome will be in the Results table. Please click here to view a larger version of this figure.
- Percentage of cells forming linear invadosomes
- Count the cells forming linear invadosomes, approximately 100 cells per coverslip (use technical triplicates). Quantify at least 300 cells per n, with n = 3.
- Calculate the percentage of cells forming linear invadosomes by taking the average of three independent experiments, resulting in 900 quantified cells.
- Linear invadosome size and number per cell
NOTE: Use a confocal microscope to take sequential images of the F-actin and Tks5 stains. The macro is adapted to a 1,024 x 1,024 image format.- Use ImageJ with the supplementary macro.
- Degradation per cell
- Use three coverslips per condition.
- Take 30 images per coverslip of fluorescent gelatin and Hoechst-stained nuclei.
- Use the ImageJ software as described in Martin KH et al.9.
5. 3D Collagen Invasion Assay
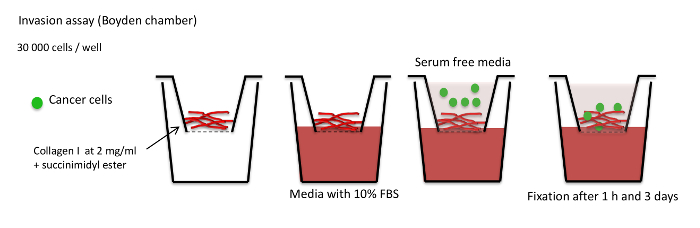
Figure 3: Invasion assay schema. Summary of the invasion assay protocol. Collagen I is cross-linked with succinimidyl ester dye and polymerized for 1 h at 37 °C. Cells are added in serum-free medium on top of the collagen I plug. The insert is placed in medium with 10% FBS. Collagen I plugs are fixed 1 h after cell seeding in the control and 3 days after cell seeding in the experimental condition to determine the invasion capacity of the cells. Please click here to view a larger version of this figure.
- Collagen I plug preparation
- Make a time course of 4 h, 12 h, 24 h, 48 h, and 72 h for the first experiment to determine the kinetics of invasion into the gel according to the cell type. For each experiment, add a 1 h time point as a reference time point when no invasion occurs.
- Prepare the collagen I solution on ice under a sterile laminar flow hood. Prepare 500 µL of solution for 3 Boyden chamber inserts.
- Aspirate 1 mg of commercial rat-tail collagen I to prepare a solution with a final concentration of 2 mg/mL collagen I.
- Add 5-carboxy x Rhodamine succinimidyl ester at a final concentration of 1 µg/mL, calculated for the final volume of collagen I solution (in this case, 500 µL).
- Mix well and incubate for 5 min on ice under the sterile laminar flow hood, protected from light.
- Add 50 µL of ice-cold, filtered 10X PBS and 6.25 µL of ice-cold 1 M sodium hydroxide (NaOH).
- Add sterile water according to the formula 443.75 – x µL of collagen I.
- Add 100 µL of solution per Boyden chamber insert.
- Incubate for 1 h at 37 °C to allow for polymerization.
- Add cell culture medium enriched with fetal bovine serum (FBS) into new wells; place inserts into these wells.
- Seed 30,000 cells on top of the collagen I plug in FBS-free medium.
- After culturing the cells at 37 °C, fix the collagen I plug for 30 min in 4% paraformaldehyde in 1x PBS.
- Complete immunofluorescence as in step 3, with the exception of the following steps: permeabilize with 0.2% Triton X-100 in 1x PBS for 30 min, not 10 min; incubate with primary and secondary antibody solutions for 1.5 h each, rather than 40 min and 30 min, respectively. Stain for F-actin or nuclei to localize the cells.
- After immunofluorescence, use a scalpel to cut around the membrane of the insert and carefully transfer the collagen I plug to a glass-bottom dish. Make sure that the top of the collagen I plug is in contact with the glass. Keep the insert membrane attached to the bottom of the collagen I plug in order to maintain the integrity of the plug.
NOTE: The collagen I plug remains intact in the glass-bottom dish. The depth between the glass bottom and the plastic surrounding the glass bottom is equivalent to the thickness of the plug. - Place a coverslip on the collagen I plug and mount with polymerizing mounting medium to prevent the plug from drying out.
- Use an inverted confocal microscope to image the collagen I plug; the top of the plug is in contact with the glass bottom of the dish.
- Acquire a z-stack from the top to the bottom of the collagen I plug to visualize cell invasion. Determine the thickness of the z-stack by examining how deeply the cells invade the imaging field. Perform acquisitions with a 40X oil objective in a 512 x 512 format with a z-step size of 0.25 μm.
NOTE: For reference, the average z-stack for MDA-MB-231 cells 3 days after seeding is 30 µm.
- Acquire a z-stack from the top to the bottom of the collagen I plug to visualize cell invasion. Determine the thickness of the z-stack by examining how deeply the cells invade the imaging field. Perform acquisitions with a 40X oil objective in a 512 x 512 format with a z-step size of 0.25 μm.
Using a combination of two types of matrices, gelatin and type I collagen (Figures 1 and 4), we have highlighted a new type of invadosome, known as linear invadosomes. The labelling of these matrices allows for the observation of linear invadosome formation along collagen I fibers and of their degradation capabilities (Figure 5). The number of invasive structures can then be quantified by the macro described previously (step 4.2), and the degradation activity can also be determined using the ImageJ software, as describe by Martin et al. and Diaz et al.9,10. The mixed matrix allows for the characterization of linear invadosomes by defining DDR1 as the receptor necessary for linear invadosome formation and functionality (Figure 6).
In order to understand the invasive capacity of cells, we have also developed a 3D type I collagen plug assay (Figures 3 and 7). This assay allows us to determine the number of cells that have invaded into the collagen I plug, as well as the distance traveled, by using z-stack reconstructions.
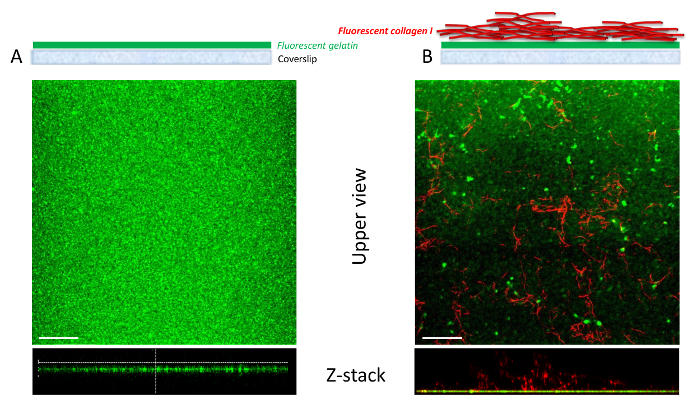
Figure 4: Comparison of gelatin and gelatin-collagen I mixed matrices using confocal microscopy. Schematic representation showing the organization of fluorescent gelatin coverslips on the top panel. (A) Confocal z-stack reconstruction demonstrates that the fluorescent gelatin matrix forms a thin, uniform layer that covers the entire surface of the coverslip. (B) In the mixed matrix, after the deposition of fluorescent gelatin on the coverslips, type I collagen fibrils polymerize on top. The collagen I fibrils are stained in red. The collagen I matrix is thick and heterogeneous on the coverslip. The distribution of the collagen I fibers is dependent on the polymerization of collagen I α chains. Scale bar = 10 µm. Please click here to view a larger version of this figure.
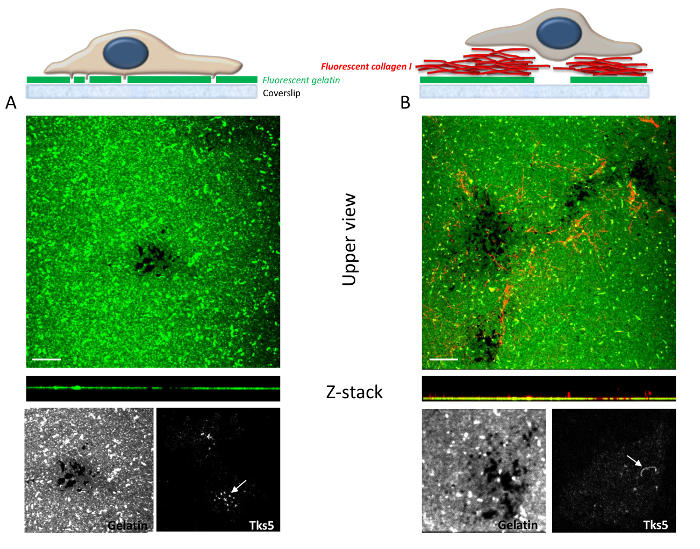
Figure 5: Impact of gelatin and gelatin-collagen I matrices on invadosome formation and activity. The cells used for these assays are MDA-MB-231 breast cancer cells. (A) A schematic representation shows cells seeded on a fluorescent gelatin coverslip on the top panel. Degradation areas are visualized in black due to the reduction of fluorescence. Tks5 staining was used as an invadosome marker. On gelatin, the invadosomes that form are organized as dots. (B) A schematic representation shows cells seeded on a mixed matrix of gelatin and collagen I. Collagen I is labeled in red; the addition of type I collagen fibrils increases the ability of the cell to degrade gelatin. Interestingly, the invadosome marker Tks5 is reorganized, and the dots are replaced by linear structures representing linear invadosomes. Degradation areas are visualized in black due to the reduction of fluorescence. Scale bar = 5 µm. Please click here to view a larger version of this figure.
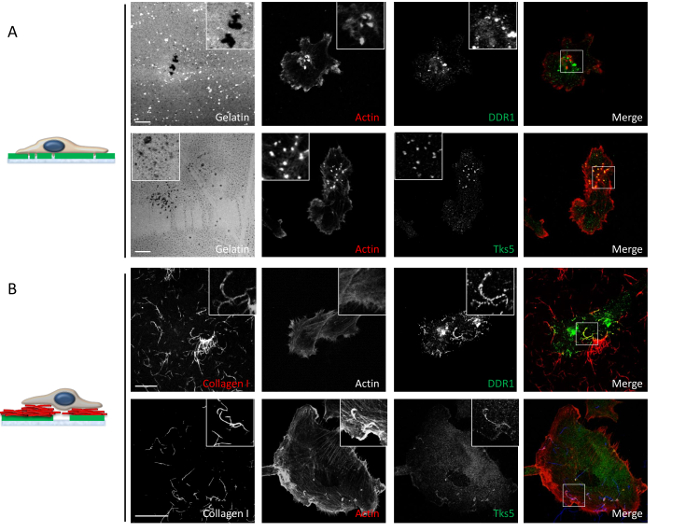
Figure 6: Confocal microscopy analysis of the molecular composition and organization of invadosomes in both gelatin and mixed-matrix conditions. (A) In the gelatin condition, invadosomes are organized in dots, and F-actin (red) co-localizes with Tks5 (green, bottom panel), but not with DDR1 (green, top panel). These are classical invadosomes. Scale bars = 5 µm. (B) In the gelatin-collagen I mixed-matrix condition, DDR1 (green, top panel) colocalizes with the collagen I fibrils (red, top panel), Tks5 (green, bottom panel), and F-actin (red, bottom panel). The type I collagen fibrils induce the formation of linear invadosomes. Scale bars = 10 µm. Please click here to view a larger version of this figure.
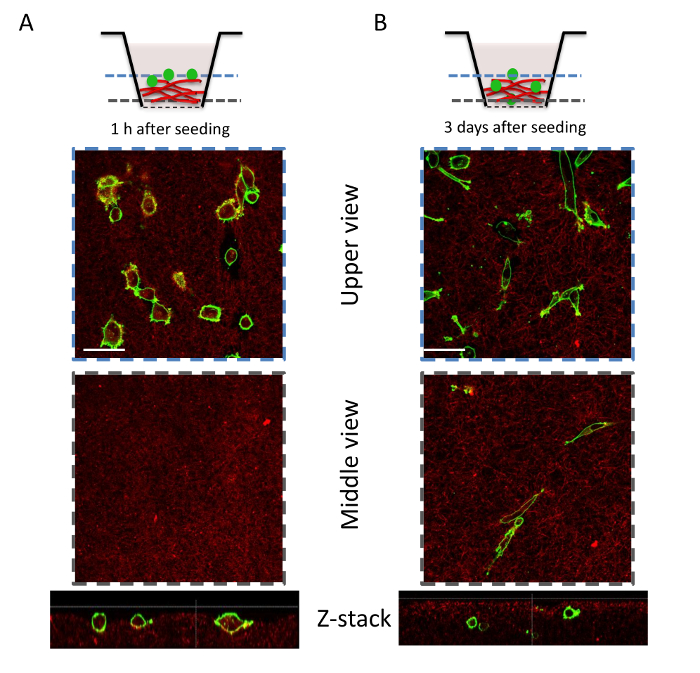
Figure 7: Cell invasion assay of MDA-MB-231 cells in a collagen I plug. 1 h after seeding the cells, control inserts are fixed and stained. (A) z-stack acquisition of the collagen I plug is performed using confocal microscopy. The cells do not invade the collagen I plug at this time point; rather, they remain on top of the collagen I plug. Thus, this is used as the control time point when no invasion occurs. MMP activation is necessary for the cells to invade a collagen I plug at this density. (B) Three days after seeding, some cells invade the collagen I plug. This assay allows for the observation and quantification of cell invasion. In addition, it can be used to study the impact of various drugs or siRNAs, for example. Scale bar = 20 µm. Please click here to view a larger version of this figure.
