By studying the architectures of load bearing biological structures (LBBSs), such as shell and bone, engineers have developed new composite materials that are both strong and tough 1. It has been shown that the remarkable mechanical properties of LBBSs and their bio-inspired counterparts are related to their intricate internal architectures 2. However, the relationships between LBBS architectures and mechanical properties are not fully understood. Measuring a LBBS's mechanical response is the first step toward understanding how its architecture enhances its mechanical properties.
However, it is important that the type of test used to measure a LBBS's mechanical response is consistent with its mechanical function. For example, since feathers must support aerodynamic loads, the primary function of a feather rachis is to provide flexural stiffness 3. Therefore, a bending test is preferred to a uniaxial tension test for measuring its mechanical response. In fact, many LBBSs—such as feather rachises 3, grass stems 4, and spicules 5,6,7,8—primarily deform by bending. This is because these LBBSs are slender—i.e., their length is much greater than their width or depth. However, performing bending tests on these LBBSs is challenging because the forces and displacements that they can withstand before failing range from 10-2 to 102 N and 10-4 to 10-3 m, respectively 3,4,5,7,8. Consequently, the device used to perform these mechanical tests should have force and displacement resolutions of ≈10-5 N and ≈10-7 m (i.e., 0.1% of the sensor's maximum measureable force and displacement), respectively.
Commercially available, large scale, mechanical testing systems typically cannot measure forces and displacements with this resolution. While atomic force microscope-based 9,10 or microelectromechanical systems-based 11 testing devices have adequate resolution, the maximum force (respective displacement) they can measure is smaller than the maximum force (respective displacement) that the LBBS can withstand. Therefore, to perform bending tests on these LBBSs, engineers and scientists must rely on custom-built mechanical testing devices 5,7,12,13. The primary advantage of these custom-built devices is that they can accommodate large ranges of forces and displacements. However, the construction and operation of these devices is not well documented in the literature.
A protocol is described for performing three-point bending tests using a custom-built mechanical testing device that can measure forces ranging from 10-5 to 101 N and displacements ranging from 10-7 to 10-2 m. Technical drawings, including all dimensions, of the components of the mechanical testing device are provided in the Supplementary Material. The primary advantage of this mechanical testing device is that the force and displacement ranges can be easily adjusted to suit different LBBSs. The device's operating principle is similar to that of an atomic force microscope 9. In this device, a specimen is placed across a trench cut in a stainless steel plate (see Figure 1A-C). The span of the trench is measured from optical micrographs to be 1278 ± 3 µm (mean ± standard deviation; n = 10). The trench edges support the specimen during a bending test (see Figure 1C, and D). This sample stage is attached to a three-axis translation stage and positioned beneath an aluminum wedge so that the wedge is located midway across the trench's span (see Figure 1C). By moving the stage in the  direction (see Figure 1A, and C), the specimen is pushed into the wedge causing the specimen to bend.
We refer to the wedge as the load point tip (LPT) and the component of the device that contains the wedge as the load point (LP). The LP is attached to the end of a cantilever whose displacement is measured by a fiber optic displacement sensor (FODS). The FODS emits infrared light, which is reflected off of a mirror located on the top surface of the LP (see Figure 1B) and received by an optical fiber in the FODS. A ≈5 mm square piece of a polished silicon wafer is used as the LP mirror and is affixed to the LP using epoxy. The FODS measures displacements by comparing the intensities of the emitted and reflected light. The cantilever stiffness and displacement are used to compute the force,  , experienced by the wedge due to its interaction with the specimen. The cantilever displacement is also used to compute the displacement of the specimen's cross-section beneath the wedge,
  . Cantilever-based force sensors have been used in a number of micro- and macro-scale mechanical testing studies 10,11,12,13,14. The specific design presented here is adapted from a mechanical testing device used for performing adhesive contact experiments 14. A similar design has also been used in a commercially available micro-tribometer 15,16.
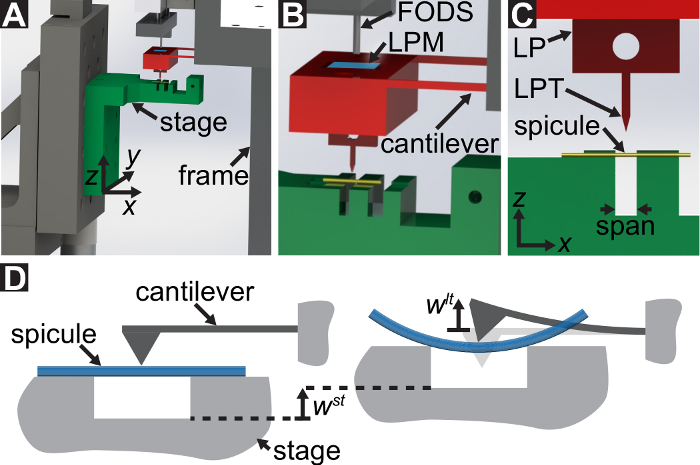
Figure 1: Overview of the custom-built mechanical testing device. (A) A computer aided design rendering of the device. The stage components are highlighted in green. The force sensing subassembly (cantilever, load point (LP)) is highlighted in red. (B) A magnified view of (A). The LP mirror is shown in blue on the top surface of the LP beneath the FODS and is labeled LPM. (C) The coordinate system used to describe the motion of the translation stage. By leveling the stage in step 1.9 of the protocol, the direction is made to coincide with the vector normal to the surface of the LP mirror. (D) A schematic of the three-point bending configuration showing the deformation of the spicule and the measured displacements  , and
, and  . Please click here to view a larger version of this figure.
The device's capabilities are demonstrated by performing three-point bending tests on the skeletal elements of the marine sponge Euplectella aspergillum6,7. This sponge's skeleton is an assembly of filaments, called spicules (see Figure 2A). The spicules are ≈50 µm thick and are composed primarily of silica 6. Biosilica-based spicules are found in sponges belonging to the classes Demospongiae, Homoscleromorpha, and Hexactinellida. Sponges, such as E. aspergillum, that belong to the class Hexactinellida are also known as "glass sponges." While the spicules of glass sponges are composed primarily of silica, it has been shown that the silica often contains an organic matrix composed of either collagen 17,18 or chitin 19,20,21. This organic matrix plays an important role in silica biomineralization 18,20. Furthermore, in some spicules the organic matrix also serves as a template for the biomineralization of calcium 22. In addition to being distributed within the silica, the organic matrix can also form distinct layers that partition the spicule's silica into concentric, cylindrical lamellae 6,23. It has been shown that this concentric, lamellar architecture can affect the spicules' deformation behavior 6,7,8,24,25,26. Consequently, the spicules' mechanical properties are determined by a combination of their chemistry (i.e., the chemical structure of the silica-protein composite) and their architecture 27. Both the chemical structure and architecture of glass sponge spicules are still under investigation 24,28,29.
Most of the spicules in E. aspergillum are cemented together to form a stiff skeletal cage. However, at the base of the skeleton there is a tuft of very long (≈10 cm) spicules known as the anchor spicules (see Figure 2A). We describe the protocol for performing three-point bending tests on small sections of the anchor spicules.
In step 1 of the protocol, the procedure for assembling and aligning the components of the custom-built mechanical testing device is described. Steps 2 and 4 of the protocol provide instructions for generating calibration data used to compute forces and displacements in the bending test. The steps taken to prepare a section of a spicule and mount it to the test fixture are described in step 3. The procedure for conducting the bending test on the spicule section is described in step 5. Finally, in the Representative Results section the calibration data obtained in steps 2 and 4 are used along with the bending test data obtained in step 5 to compute and .
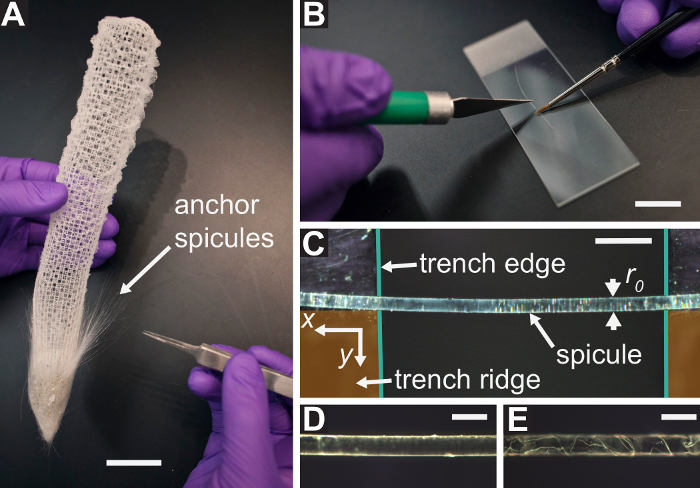
Figure 2: Procedure for sectioning and inspecting E. aspergillum spicules. (A) The skeleton of E. aspergillum. The tuft of free-standing anchor spicules is shown at the base of the skeleton. The scale bar is ~25 mm. (B) A single anchor spicule is held in place on a microscope slide using a #00000 red sable brush and sectioned using a razor blade. The scale bar is ~12 mm. (C) A section of an E. aspergillum spicule placed across the trench on the sample stage. The trench edges and trench ridge are highlighted in teal and orange, respectively. The spicule is pushed against the trench ridge to ensure that its axis is perpendicular to the trench edges. (D) A micrograph of a spicule that passes the inspection procedure described in step 3.4 of the protocol, which describes how to determine if a spicule section is damaged and should be discarded. (E) A micrograph of a spicule containing many cracks and missing large sections of silica layers that would fail the inspection procedure described in step 3.4 of the protocol. Scale bars = 250 µm (C), 100 µm (D), and 100 µm (E). Please click here to view a larger version of this figure.
1. Assembly and Alignment
- Choose a cantilever whose stiffness is appropriate for the intended experiment. Attach the LP to the cantilever using #4-40 socket head cap screws (SHCSs) (see Figure 3A). Take care to not plastically deform the cantilever arms while attaching the LP.
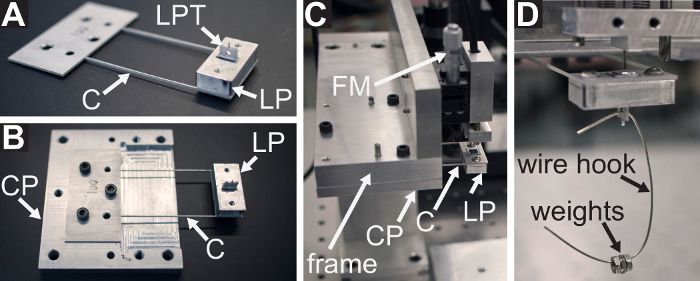
Figure 3: Procedure for assembling the cantilever force sensor and measuring its stiffness. (A) The load point (LP) is attached to the cantilever (C), with the load point tip (LPT) pointed upward. (B) The cantilever and LP subassembly is attached to the cantilever plate, denoted as CP. The recessed pocket of the cantilever plate is shown beneath the cantilever arms. (C) The cantilever plate is attached to the underside of the frame so that the side of the plate shown in (B) is facing the  direction. The FODS micrometer is denoted as FM. (D) The wire hook and calibration weights used in step 2 of the protocol are shown hanging from the hole in the LPT. Please click here to view a larger version of this figure.
- Apply a few drops of 2-propanol to a lint free cotton swab and wipe the surface of the LP mirror. Inspect the mirror for scratches and replace the mirror if it is damaged.
- Loosely attach the cantilever to the cantilever plate using #6-32 SHCSs on the side of the plate containing the recessed pocket with the LPT pointing away from the plate (see Figure 3B). Insert the 1/8" alignment pins through the cantilever and plate, tighten the screws, and then remove the alignment pins.
- Retract the FODS as much as possible by turning the FODS micrometer counter-clockwise (see Figure 3C). Loosely attach the cantilever plate to the frame using #6-32 SHCSs with the LPT pointing in the
 direction (see Figure 1A). Insert the 1/8" alignment pins through the frame and cantilever plate, tighten the screws, and then remove the alignment pins (see Figure 3C).
 - Turn on the power supply and set the voltage to 12.00 V in constant voltage mode using the adjustment knob. Then turn on the voltage output and confirm that the current draw displayed on the power supply's LCD screen is roughly 60-70 mA. Wait at least one hour for the current draw to reach steady state to reduce voltage measurement uncertainty.
- Open and run the the Basic_Data program (see Supplementary Code files). Turn the FODS micrometer (see Figure 3C and Figure 4A) clockwise to move the FODS toward the LP mirror until the output voltage displayed on the user interface graph reaches a maximum value.
- Adjust the gain of the FODS by turning the set screws on the side of the FODS housing so that the voltage output is 5.0 V. Turn the FODS micrometer counter-clockwise to retract the FODS.
- Turn on the microscope illuminator and adjust the microscope position and focus using the two manual translation stages so that the LPT is centered in the field of view. Stop the Basic_Data program by clicking the 'Stop' button.
- Open the motor controller user interface software. Use the potentiometer slider on the
 -axis motor controller to move the stage to the maximum allowable travel in the direction and set the home position by clicking the 'Home' button in the user interface.
- Use the potentiometer slider on the
 -axis motor controller to move the stage to the maximum allowable travel in the
  direction and set the home position. Close the user interface software.
- Use the potentiometer slider on the
- Seat the stage on the stage base plate (see Figure 4A) so that the tips of the micrometer heads on the leveling plate rest in the stage base plate divots. Place a bubble level on the isolation table and adjust the pressure in each of the table's legs by turning the valve arm thumb screws so that the surface is level.
- Move the bubble level to the top of the stage leveling plate and adjust the micrometers so that it is also level. Note the micrometer positions and remove the stage from the stage base plate. Note: The protocol can be paused here.
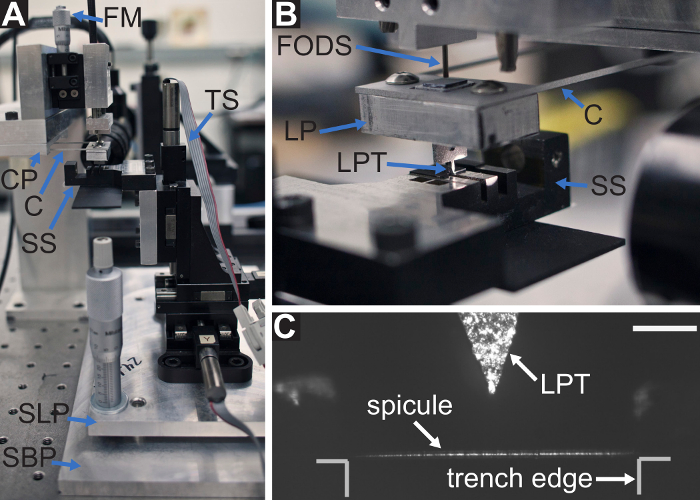
Figure 4: The mechanical testing device as assembled in steps 1.9 and 3.7 of the protocol. (A) The sample stage (SS), is attached to the translation stage (TS), and is leveled using the micrometers on the stage leveling plate (SLP), which are seated on the stage base plate (SBP). The stage base plate is attached to the optical breadboard of the isolation table. The cantilever (C); cantilever plate (CP); and fiber optic displacement sensor (FODS) compose the force sensing system. (B) The load point (LP) is attached to the cantilever and the load point tip (LPT) is positioned over the spicule on the sample stage. During a bending test, the displacement of the LP is measured using the FODS. The initial distance between the FODS and the LP mirror is controlled by the FODS micrometer (FM) shown in (A). (C) A micrograph of the spicule laying across the trench in the sample stage, positioned beneath the LPT. Scale bar = 250 µm (C). Please click here to view a larger version of this figure.
2. Cantilever Stiffness Measurement
- Run the Basic_Data program and turn the FODS micrometer clockwise until the output voltage is approximately 4 V. Stop the program by clicking the 'Stop' button.
- Measure the mass of the wire hook and calibration weights using an analytical balance.
- Open the Cantilever_Calibration program (see Supplementary Code files) and enter the desired file name for the force calibration output file in the text box in the user interface.
- Run the Cantilever_Calibration program and click 'OK' when prompted to enter the mass of the first calibration weight. Wait for the output voltage displayed in the user interface graph to stop oscillating and click the green 'Voltage Stabilized' button to take a voltage measurement.
- Use tweezers to hang the wire hook from the hole in the LPT so that the hook is facing away from the microscope objective (see Figure 3D). Use the tweezers to damp the vibration of the cantilever caused by the addition of the hook.
- Enter the mass of the hook in grams in the dialog box and click 'OK'. As in the previous step, wait for the output voltage to stop oscillating before clicking the 'Voltage Stabilized' button.
- Use tweezers to hang the first weight on the wire hook and repeat the process of taking a voltage measurement as described in the previous step. Repeat this step until either all of the calibration weights have been hung or the output voltage is less than 1.8 V. At this point, click 'Cancel' in the dialog box to exit the Cantilever_Calibration program.
- Turn the FODS micrometer counter-clockwise to retract the FODS. Carefully remove the hook and weights from the LPT.
NOTE: The force calibration output file is a tab delimited list of the force applied by the calibration masses, the mean of 100 FODS output voltage readings and the standard deviation of those readings. The Representative Results section describes how this data file is processed to measure the cantilever stiffness.
3. Specimen Preparation
- Wear nitrile gloves when handling the E. aspergillum sponge skeletons and store the skeletons in sealed containers when they are not being handled.
CAUTION: Since the spicules are composed primarily of silica, broken spicule fragments are sharp and can become embedded in skin, leading to irritation. - Use a pair of tweezers to grasp one anchor spicule by its distal end and pull to remove it from the skeleton (see Figure 2A). Place the spicule on a clean microscope slide.
- Hold the spicule against the slide near the midpoint along its length using a #00000 red sable brush. Cut a ≈4 mm section of the spicule by pushing a razor blade against the spicule on either side of the brush perpendicular to the slide surface (see Figure 2B). Discard the large distal and proximal spicule sections and keep the ≈4 mm section.
- Inspect the 4-mm spicule section using a polarized light microscope at 10x magnification (see Figure 2C–E). Discard the spicule section and return to step 3.2 if it is missing large regions of silica layers (see Figure 2E). Handle inspected spicule sections exclusively using the #00000 red sable brush to avoid introducing any new damage to their silica layers.
- Clean any spicule fragments or other particles from the surface of the sample stage with a brush or compressed air. Then apply a few drops of 2-propanol to a lint free cotton swab and wipe the sample stage. Avoid contact with the areas of the stage coated with non-reflective paint.Note: The paint is used to reduce the number of specular reflections in the images taken during the bending test.
- Transfer the spicule section to the sample stage. Position the spicule section across the trench with the desired span for the bending test and gently push it in the
 direction against the trench ridge. Ensure that the spicule is perpendicular to the trench edges (see Figure 2C).
 - Seat the stage on the stage base plate so that the tips of the micrometer spindles rest in the stage base plate divots. If needed, adjust the micrometers on the stage leveling plate to the values noted in step 1.9 of the protocol.
4. Voltage-displacement Interpolation File
- Open the Bending_Test program (see Supplementary Code files). Set the 'step size' to 2 µm, 'maximum displacement' to 0.5 mm, 'low voltage stop' to 1.5 V, and 'high voltage stop' to 4.6 V using the text boxes shown in the user interface.
- Select the desired image and data directories and the output file name using the text boxes in the user interface. Set the 'save images' switch in the user interface to the down position and click the green rectangular button below the words 'Voltage Difference' so that it becomes illuminated.
- Run the Bending_Test program and wait for the motor controller and camera interfaces to initialize.
- Turn on the illuminator and adjust the brightness so that the LPT is visible. Turn the FODS micrometer clockwise until the output voltage displayed in the user interface graph is ~1.7 V.
- Use the potentiometer slider on the -axis motor controller to move the stage in the direction until it is ~1 cm below the LPT and set the -axis home position by clicking the "Home" button.
- Use the potentiometer slider on the
- Use the potentiometer sliders on the – and
 -axis motor controllers to position the LPT over the center of the thin steel strip located on the sample stage in the
  direction from the trench. Use the potentiometer slider on the -axis motor controller to move the stage in the direction until the stage is within the microscope's field of view.
 - Use the potentiometer slider on the -axis motor controller to move the stage in the direction while watching the output voltage graph in the user interface. Determine the approximate position at which the LPT contacts the stage's surface by looking for a change in voltage with further movement of the stage. Retract the stage approximately 10 µm.
- Click the button labeled "Begin Test". When prompted, enter values of 0.003 V and 0.001 mm for 'touch sensitivity' and 'touch off step size', respectively. Wait for the test to complete.
NOTE: After this point, do not remove the stage from the stage base plate until the bending test is complete in order to ensure accurate displacement measurements. The voltage-displacement interpolation output file is a tab delimited list of the mean of 100 FODS output voltage readings and the standard deviation of those readings along with the-axis stage position at every stage displacement increment. The Representative Results section describes how this data file is used to convert measured FODS output voltages to LP displacements.
5. Bending Test
- Open and run the Basic_Data program and turn the FODS micrometer counter-clockwise until the output voltage displayed on the user interface graph is approximately 3 V. Use the potentiometer slider on the -axis motor controller to position the LPT between the trench edges above the spicule (see Figure 4C).
- Use the potentiometer slider on the -axis motor controller to move the stage in the direction until the LPT is below the top surface of the trench ridge (see Figure 5A). Finally, use the potentiometer slider on the -axis motor controller to bring the front surface of the trench ridge into focus so that the complete width of the LP is between the edges of the trench ridge. Stop the Basic_Data program by clicking the 'Stop' button.
- Use the potentiometer slider on the
- Open and run the Center_LoadPoint program (see Supplementary Code file). Use the -axis motor controller to move the stage until the LPT is nearly in contact with the right trench edge. Click the "Find Edge" button.
- When prompted, use the -axis motor controller to move the stage until the LPT is nearly in contact with the left trench edge. Click the "Find Edge" button. Wait for the program to position the LPT mid-way across the trench span (see Figure 5B).
NOTE: After this point it is important not to adjust the-axis motor controller as this will result in a misalignment of the LPT. - Open the Bending_Test program. Set the step size to 2 µm, maximum displacement to 0.5 mm, low voltage stop to 1.5 V, and high voltage stop to 4.5 V using the text boxes in the user interface.
- Select the desired image and data directories and the output file name using the text boxes in the user interface. Set the 'save images' switch in the user interface to the up position and click the green rectangular button below words 'Voltage Difference' so that it is not illuminated.
- Run the Bending_Test program and wait for the motor controller and camera interfaces to initialize.
- Move the stage in the direction using the potentiometer slider on the motor controller until the spicule is within the microscope's field of view. Use the potentiometer slider on the -axis motor controller to move the stage until the spicule is under the LPT.
- Adjust the microscope focus knobs so that the spicule is in focus in the user interface (see Figure 4C). Turn the FODS micrometer counter-clockwise until the output voltage is approximately 1.8 V.
- Use the potentiometer slider on the z-axis motor controller to move the stage in the direction while watching the output voltage graph in the user interface. Determine the approximate position at which the LPT contacts the spicule by looking for a change in voltage with further movement of the stage. Retract the stage approximately 50 µm.
- Click "Begin Test" and wait until the bending test is completed and the stage returns to the -axis home position.
NOTE: The stage will move in 2 µm increments (as is prescribed in step 5.4 of the protocol) in the direction, bending the spicule (see Figure 5C) until one of several stopping conditions is met. The stopping conditions are: a) the maximum stage displacement of 0.5 mm is reached; b) the spicule breaks and the program detects a large drop in the FODS output voltage; or c) the high voltage limit of 4.5 V is reached. For stopping condition (a), the user will be prompted if they would like to end the test or override the previous value. When 'Override' is selected, the user will have the opportunity to either increment the stage displacement limit or reverse the direction of the stage displacement step in order to continue collecting data as the spicule is unloaded. The stage displacement increment direction can also be changed by clicking the "Reverse Loading" button at any point during the test. The bending test output file has the same structure as the voltage-displacement interpolation output file generated in step 4.6 of the protocol. That is, it is a tab delimited list of the mean of 100 FODS output voltage readings and the standard deviation of those readings along with the -axis stage position at every stage displacement increment. The Representative Results section describes how this data file is used along with the voltage-displacement interpolation file to compute the cantilever displacements and stage displacements during the bending test. Subsequently, the cantilever stiffness is used to compute the force applied by the LPT on the spicule. - After the test is complete, turn the FODS micrometer counter-clockwise until the FODS is at least 5 mm from the LPT mirror. Then, carefully remove the stage from the stage base plate.
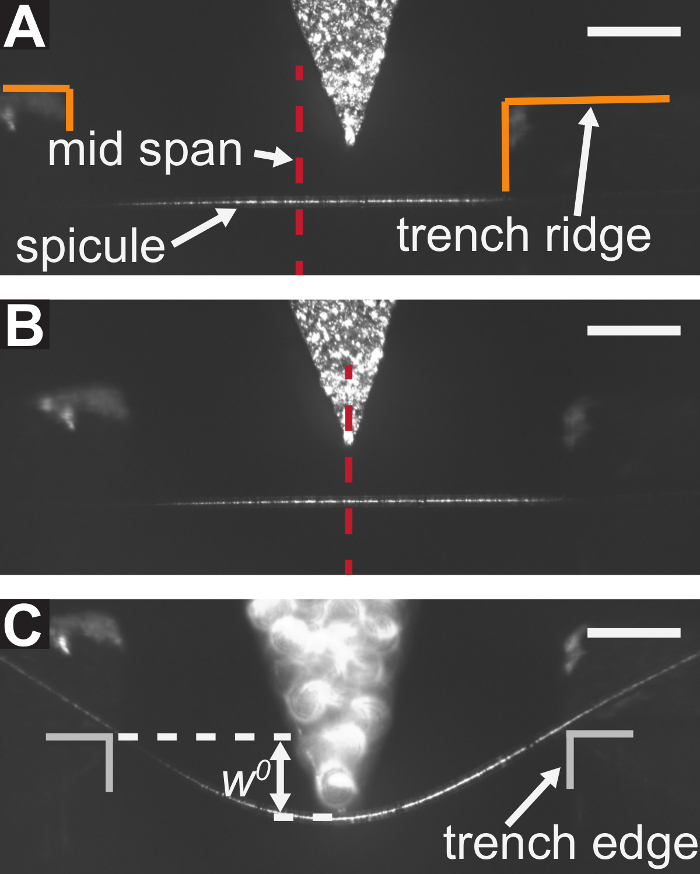
Figure 5: Procedure for aligning the LPT with the trench's mid span and performing a bending test. (A) The LPT is positioned below the top surface of the trench ridge at the end of step 5.1 of the protocol, but it is not yet positioned at mid span. (B) The position of the LPT after the centering procedure described in steps 5.2 and 5.3 of the protocol are completed. (C) A micrograph of a spicule taken during the bending test. The displacement of the spicule cross-section beneath the LPT,  , is marked schematically. Scale bars = 250 µm (A–C). Please click here to view a larger version of this figure.
The most basic outputs of any mechanical test are the magnitude of the force applied to the specimen and the displacement at the location where the force is applied. In the case of a three-point bending test, the goal is to obtain the magnitude of the force applied by the LPT,  , and the displacement of the specimen's cross-section beneath the LPT in the direction, . However, for the mechanical testing device described here, several post-processing steps must be performed to transform the output data obtained from steps 2, 4 and 5 of the protocol into this desired – data. The data files obtained from the three-point bending test are: 1) the voltage-displacement interpolation file; 2) the force calibration file; and 3) the bending test file. A summary of the measured and derived quantities is shown in Table 1.
| Symbol | Definition | |||
| Nh | Number of voltages values in the voltage-displacement interpolation output file | |||
| Vh | Measured voltage values in step 4 of the Protocol | |||
| σVh | Standard deviation of Vh | |||
| zsh | Measured stage position in step 4 of the Protocol | |||
| Nc | Number of force measurements in the force calibration output file | |||
| Fc | Force applied by calibration weights in step 2 of the Protocol | |||
| Vc | Measured voltage values in step 2 of the Protocol | |||
| σVc | Standard deviation of Vc | |||
| zlc | Position of the LP in step 2 of the Protocol computed using Vh and Vc | |||
| wlc | Displacement of the LP in step 2 of the Protocol computed from zlc | |||
| Nt | Number of force and displacement measurements in the bending test output file | |||
| zst | Position of the stage in step 5 of the Protocol | |||
| wst | Displacement of the stage in step 5 of the Protocol | |||
| Vt | Measured voltage values in step 5 of the Protocol | |||
| σVt | Standard deviation of Vt | |||
| zlt | Position of the LP in step 5 of the Protocol computed using Vh and Vt | |||
| wlt | Displacement of the LP in step 5 of the Protocol computed from zlt | |||
| F | Force applied by the LP in step 5 of the Protocol computed from zlt | |||
| w0 | Displacement of the spicule’s cross-section under the LP in step 5 of the Protocol | |||
Table 1: Summary of symbols used for quantities measured in steps 2, 4 and 5 of the Protocol and computed in the Representative Results section.
The purpose of the voltage-displacement interpolation file is to relate measured FODS output voltages to LPT displacements. This is done by rigidly coupling the LPT to the translation stage so that as the stage is moved in the direction, the change in the -axis stage position is equal to the LPT displacement (step 4 of the protocol). The voltage-displacement interpolation file contains a set of points 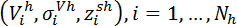 , where
  is the average FODS output voltage taken over 100 measurements at a sampling rate of 1000 Hz,
  is the associated standard deviation of the 100 voltage measurements,
  is the -axis stage position and
  is the number of stage displacement steps (see Figure 6 (B)).
The force calibration file allows the cantilever stiffness to be measured so that LP displacements can be used to compute the magnitude of the force applied by the LP. The force calibration file contains a set of points 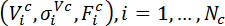 , where
  is the average FODS output voltage taken over 100 measurements at a sampling rate of 1000 Hz,
  is the associated standard deviation of the 100 voltage measurements,
  is the force exerted by the weights on the LPT, and
  is the number of calibration weights used. Notice that there are two more points than there are calibration weights because the first point is measured for zero applied force and the second point for the force exerted by the wire hook alone.
Finally, the bending test file is used to compute and . It contains a set of points 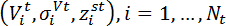 , where
  is the average FODS output voltage taken over 100 measurements at a sampling rate of 1000 Hz,
  is the associated standard deviation of the 100 voltage measurements,
  is the -axis stage position and
  is the number of stage displacement steps during the bending test.
First, the component of the LPT's position during the force calibration,  , is found by using the set
  to map values to
  values via linear interpolation. The component of the LPT displacement is given by
  ,
,  . Since the LPT displacements are small compared to the length of the cantilever, the relationship between and
  appears to be linear. Therefore, the cantilever stiffness can be computed by fitting a line to the
  data and computing the slope,
  . A representative set of points and its corresponding fitted line are shown in Figure 6A. The stiffness of the cantilever used in the bending experiments was 90.6 ± 0.3 N/m.
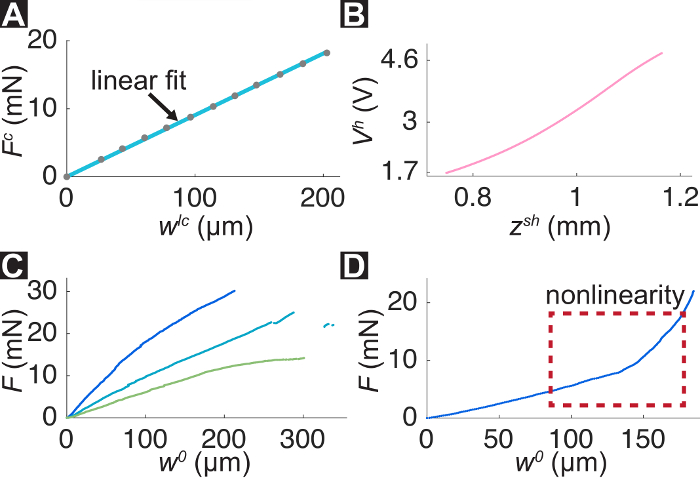
Figure 6: Representative results of the three-point bending test. (A) Force and displacement data (gray) obtained in step 2 of the protocol along with the linear fit (blue) used for estimating the stiffness of the cantilever. (B) Representative example of the data contained within the voltage-displacement interpolation output file. For a measured FODS output voltage,  , the position of the stage,
  , can be obtained via linear interpolation. This is used to measure the cantilever displacement, , during the bending test. (C) Representative force-displacement responses of 3 different E. aspergillum anchor spicules from successful three-point bending tests. (D) A force-displacement response from an unsuccessful three-point bending test. The nonlinearity of the curve suggests that the spicule was not properly seated on the sample stage and slid or reoriented after initial contact was made with the LPT. Please click here to view a larger version of this figure.
Next, the component of the LPT's position during the bending test, 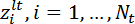 , is found by using the set to map values to
  values via linear interpolation. The component of the LPT displacement during the bending test is given by
  ,
,  . The component of the stage displacement during the bending test is given by
  .
.
Since the LPT and the spicule are in contact during the entirety of the bending test, the spicule displacement,  is given by
 (1)
(1)
and the force applied by the LPT,  , is
, is
 (2)
(2)
It is important to note that since the set is used to obtain both and values via interpolation, the values of the  and must be within the range of . This is ensured by setting appropriate values for the starting voltage and high voltage stop values in steps 2, 4 and 5 of the protocol.
Figure 6C shows force-displacement curves for three representative spicules. For slender, linear elastic structures loaded in three-point bending, is expected to increase linearly with for small values of 30. Nonlinearity of the – curve for small (e.g., see Figure 6D) typically suggests that the spicule may not be seated correctly on the sample stage. In this case, the test should be stopped and the spicule repositioned on the sample stage (step 3.6 of the protocol).
In order to ensure sufficient accuracy of the and measurements, the total voltage change over the course of the bending test, 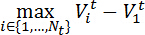 , should be at least 1 V. If the total voltage change is less than 1 V, a more compliant cantilever should be selected.
Several steps of the protocol are particularly important for ensuring that forces and displacements are measured accurately. While some of these critical steps are universal to all three-point bending tests, others are unique to this mechanical testing device.
In step 1.2 of the protocol the LP mirror is cleaned and inspected for scratches, and in step 1.6 of the protocol the FODS gain is set. It is important for the gain and the LP mirror reflectance to be constant for steps 2, 4, and 5 of the protocol. For this reason, the two calibration steps (steps 2 and 4 of the protocol) should be performed immediately before the bending test (step 5 of the protocol).
In steps 1.9 and 3.7 of the protocol the stage is leveled with respect to the surface of the isolation table. These steps ensure that is the component of force perpendicular to the spicule's longitudinal axis. The frame of the mechanical testing device is manufactured so that the cantilever, LP mirror, and surface of the FODS are all parallel to the surface of the isolation table. This means that the force sensor will measure the component of force and displacement normal to the isolation table surface. If the top of the stage is misaligned by an angle  with respect to the surface of the isolation table, then the measured displacement of the LPT will be
 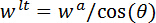 , where
  is the actual displacement in the direction perpendicular to the spicule's longitudinal axis (see Figure 7). Since
  , this results in an over prediction of applied forces and the under prediction of spicule displacements per equations (1) and (2).
Figure 7: Effect of stage leveling on displacement measurements. (A) The stage is tilted at an angle, , with respect to the surface of the isolation table and the bottom surface of the cantilever. (B) The displacement of the LP in the vertical direction, (see Figure 1 (D)), is measured by the FODS. The component of the LP displacement in the direction perpendicular to the spicule's axis is . Please click here to view a larger version of this figure.
In steps 5.1–5.3 of the protocol the LPT is positioned mid way across the trench's span. Misalignment of the LPT with respect to the mid span will result in the specimen appearing stiffer than it actually is 31,32. That is, the spicule's displacement will be smaller than that which would be measured if the same force were applied at the mid span. This type of misalignment can be avoided by not removing the stage from the stage base plate or adjusting the x-axis stage position after the centering procedure is complete (steps 5.1–5.3 of the protocol).
One limitation of this method is that in order to reduce the relative measurement uncertainty of the force and displacement measurements, the cantilever stiffness should be selected so that the FODS output voltages span the full range of 1.8 to 4.5 V during the bending test. However, this voltage range corresponds to a cantilever displacement of approximately ≈250 µm, which is roughly the same as the spicule displacement just before it fails (see Figure 6 (C)). This means that the cantilever and the spicule have similar stiffnesses. While this is not problematic for measuring the elastic response and strength properties of the spicules, it does preclude the accurate measurement of the spicules' toughness properties. This is because in order to ensure accurate measurement of toughness properties, a crack in the spicule must propagate in a controlled manner 33. Typically, this is only possible if the testing device is much stiffer than the specimen 33. In order to increase the stiffness of the testing device, a more sensitive displacement sensor could be used in place of the FODS.
While the bending test protocol is demonstrated on E. aspergillum spicules, the mechanical testing device can be used to perform three-point bending tests on other LBBSs and synthetic materials as well. This mechanical testing device is most appropriate for specimens whose cross-sectional diameters range from 0.01 to 1 mm and for trench spans ranging from 1 to 10 mm. For larger diameters, the sample stage should be redesigned so that the specimen cannot roll across the stage. This is not an issue for smaller fibers, like the spicules, because the roughness of the stage's surface is enough to prevent the specimen from rolling. The radii of the trench edges and LPT should also be made larger to avoid introducing local damage at the points where the specimen is supported 31,32. Furthermore, the stage leveling plate should be fastened to the stage base plate (see Figure 4A) using ¼"-20 socket head cap screws after step 3.7 of the protocol to prevent stage tilting if forces exceed ≈1 N.
For accurate force and displacement measurement, the cantilever's stiffness should always be much smaller than the frame's stiffness (≈107 N/m). This requirement limits the maximum force that can be applied by this device to ≈25 N. Consequently, it is important to estimate the maximum force a specimen can withstand before performing a bending test to determine if this device can be used to perform the test.
This work provides the protocol, technical drawings (see Supplementary File 1) and software (see Supplementary Code files) for reproducing and using our mechanical testing device. This will hopefully provide a platform for accurately measuring the flexural behavior of many different LBBSs. These measurements are a prerequisite for developing a deeper understanding the relationship between a LBBS's architecture and its mechanical properties.
