Summary

Ablation of a Neuronal Population Using a Two-photon Laser and Its Assessment Using Calcium Imaging and Behavioral Recording in Zebrafish Larvae

Published: June 02, 2018
doi:

Summary

Here, we present a protocol to ablate a genetically labeled subpopulation of neurons by a two-photon laser from Zebrafish larvae.

Abstract

To identify the role of a subpopulation of neurons in behavior, it is essential to test the consequences of blocking its activity in living animals. Laser ablation of neurons is an effective method for this purpose when neurons are selectively labeled with fluorescent probes. In the present study, protocols for laser ablating a subpopulation of neurons using a two-photon microscope and testing of its functional and behavioral consequences are described. In this study, prey capture behavior in zebrafish larvae is used as a study model. The pretecto-hypothalamic circuit is known to underlie this visually-driven prey catching behavior. Zebrafish pretectum were laser-ablated, and neuronal activity in the inferior lobe of the hypothalamus (ILH; the target of the pretectal projection) was examined. Prey capture behavior after pretectal ablation was also tested.

Introduction

To understand how behavior arises from neuronal activity in the brain, it is necessary to identify the neural circuits that are involved in the generation of that behavior. At the larval stage, the zebrafish provides an ideal animal model for studying the brain function associated with the behavior because their small, transparent brains make it possible to investigate neuronal activity at a cellular resolution in a broad area of the brain while observing the behavior1. Imaging of neuronal activity in specific neurons has become possible through the invention of genetically encoded calcium (Ca) indicators (GECIs) such as GCaMP2. GCaMP transgenic zebrafish have proven to be useful for associating the functional neural circuit with behavior by conducting Ca imaging in behaving animals3.

While Ca imaging can demonstrate correlations between neuronal activity and behavior, to show causality, suppression of neuronal activity and testing its consequence(s) on behavior are important steps. There are various ways to achieve this: use of genetic mutation that alters specific neural circuits4, expression of neurotoxins in specific neurons5,6, use of optogenetic tools such as halorhodopsin7, and laser ablation of targeted neurons8,9. Laser ablation is particularly suited for eliminating activity in a relatively small number of specific neurons. Irreversible elimination of neuronal activity by killing neurons facilitates assessing behavioral consequences.

One interesting behavior that can be observed at the larval stage in zebrafish is prey capture (Figure 1A). This visually-guided, goal-directed behavior provides a favorable experimental system for the study of visual acuity10, visuomotor transformation11,12,13, visual perception and recognition of objects14,15,16,17,18, and decision making19. How prey is recognized by predators and how prey detection leads to prey catching behavior has been a central question in neuroethology20. In this paper, we focus on the role of the pretecto-hypothalamic circuit formed by projections of a nucleus in the pretectum (nucleus pretectalis superficialis pars magnocellularis, hereafter, simply noted as the pretectum) to the ILH. Laser-ablation of the pretectum was shown to reduce prey capture activity and abolish neuronal activity in the ILH that is associated with the visual prey perception21. Here, protocols for performing laser ablation and testing its effect using Ca2+ imaging and behavioral recording in zebrafish larvae are described.

Protocol

1. Ablation of a Subpopulation of Neurons Using a Two-photon Laser Microscope  

Note: If users plan on performing Ca imaging following ablation, use the UAShspzGCaMP6s line21. If users plan on performing behavioral recording following ablation, use the UAS:EGFP line, as the ablation of EGFP-positive cells is easier to perform than of GCaMP6s-expressing cells.

  1. Begin by setting up the mating of a Gal4 line that labels specific neurons to be studied and UAS:EGFP or UAShspzGCaMP6s. Be sure to use the nacre background for both parents so that nacre homozygotes can be obtained.
    Note: Homozygotes of nacre contain no melanophores on the body surface (Figure 1B). In the present study, a Gal4 line gSAIzGFFM119B (which labels the pretectum) and another Gal4 line hspGFFDMC76A (which labels the ILH) are used21.
  2. On the following day of the mating setup, collect the zebrafish eggs, and raise them to the larval stage at which point the neurons of interest will express fluorescent reporters.
  3. Mount the zebrafish larva in 2% low melting point-agarose (Figure 1B).
    1. Begin by preparing 2% agarose stock solution: dissolve 2 g of low melting-point agarose powder in 100 mL system water (i.e., the water used to maintain adult zebrafish in a circulating water system)22 or E3 water23, by bringing the water to the boiling point in a microwave, and mixing vigorously.
    2. Microwave the 2% low melting-point agarose stock until it boils. Pour 3.5-4.0 mL of the agarose onto the lid of a 6-cm Petri dish. Wait until the agarose cools so that it is warm to the touch before proceeding.
    3. Next, place a single larva (not anesthetized at this step) in the agarose. Keep adjusting the position and orientation of the larva so that it is upright, using a dissecting needle (Figure 1C), until the agarose solidifies to ensure the proper positioning of the larva.
      Note: The larva will continue to swim around while the agarose solidifies.
    4. Once the larva is positioned, allow 5 min for the agarose to solidify completely.
    5. Pour 5 mL of tricaine solution (0.4% at 1x working concentration) over the agarose.
      Note: To avoid movements by the larvae during laser ablation, the larvae must be kept anesthetized throughout the ablation procedure.
  4. Ablate the larva using the bleaching function in a two-photon laser microscopy system.
    1. Place the agarose-embedded larva under a two-photon laser scanning microscope and start the microscopy system.
    2. Start the image acquisition software and click the "On" button on the "Laser" tab to turn on the laser (Figure 1D). Wait for the "Status" of the laser to change from "Busy" to "Mode-locked."
    3. On the "Channels" tab, set the laser's wavelength at 880 nm (maximum power: approximately 2,300 mW) for EGFP ablation, or at 800 nm (maximum power: approximately 2,600 mW) for GCaMP ablation.
    4. Select the 20X objective lens by manually moving the lens revolver. Click the "Locate" tab, click "GFP" to change the optical pathways, and directly view the fluorescence by eye.
    5. Locate the zebrafish larval brain at the center of view; then click the "Acquisition" tab to go back to the two-photon microscopy.
    6. As a record of the 'before ablation' condition, take a z-stack image with the 20X objective lens at fast scanning-speed (to avoid heat-damage). Later compare the images taken before and after ablation experiments (Figure 2A). To obtain a z-stack, click "Z-Stack" to select the z-stack option and expand the tab. Set the lower limit (click the "Set First" button") after focusing on the ventral end of the larval brain, and set the upper limit (click the "Set Last" button) after focusing on the dorsal most-surface of the brain. Then, click the "Start Experiment" button to run the z-stack image acquisition.
    7. Select the 63X objective lens by manually moving the lens revolver.
    8. Click the "Locate" tab to switch to the epi-fluorescent microscopy, locate the cells to be ablated at the center of view by eye, then click the "Acquisition" tab to go back to laser scanning microscopy.
  5. On the "Acquisition Mode" tab, set the "Frame Size" at 256 x 256. Click "Live" and observe the neurons of interest.
  6. Starting from the dorsal-most side, find a focal plane in which the cells to be ablated are in focus.
  7. Mark a small, circular area about one third the cell's size in diameter on each neuron as a region of interest (ROI) using the "Regions" function.
  8. Set the scan speed to 13.93 s/256 x 256 pixels (134.42 µm x 134.42 µm), which corresponds to a laser dwell time of approximately 200 µs/pixel, or 200 µs/0.5 µm. Also, set 4 repetitions ('Iteration cycle: 4'). Alternatively, optimize the number of iterations and scanning speed so that sufficient ablation is achieved.
  9. Perform the 'Bleaching' function for ablation, in combination with the 'Time series (2 cycles)' to image the sample (before and after ablation) and 'Regions' (to set the ROIs) or equivalent functions in the software used (Figure 1D).
  10. By comparing the first image (before ablation) and the second image (after ablation) in the Time series cycle, ensure that after bleaching, the fluorescence in the targeted cells decreases to that observed at the background level (Figure 2B).
  11. If fluorescence is still present after ablation, increase the number of iterations.
  12. Next, move the focal plane slightly deeper (i.e., towards the ventral side), and choose the next focal plane where un-ablated cells appear.
  13. Perform the bleaching function as described above (step 1.9). Repeat these steps until all the cells in the neural structure of interest have been ablated.
  14. After going through all the focal planes covering the neural structures to be ablated, check the cells for abolished fluorescence. If some cells are found to still be fluorescent due to insufficient ablation, laser-irradiate them again as described above.
  15. If the larva needs to be recovered from agarose after laser irradiation, do not try to force it out of the agarose because this might damage the larva. Instead, carefully make tiny cuts in the agarose around the larva perpendicularly to the surface of its body. Then, wait for the larva to swim out of agarose on its own when the anesthetic wears off.
  16. Proceed to the next larva for ablation or perform control experiments using another population of neurons that are uninvolved in the behavior under investigation.
    Note: Here, as a control, olfactory bulb neurons in UAS:EGFP; gSAIzGFFM119B larvae were laser-ablated using the same protocol described above (Figure 2A, right).
  17. Allow several hours or 1 day for recovery before proceeding to Ca imaging (Section 2) or behavioral recording (Section 3). During this recovery time, check the larval health (i.e., normal spontaneous swimming, no apparent heat-damage around the ablated area, etc.) and remove larvae showing any signs of poor health.

2. Calcium Imaging to Record Prey-evoked Neuronal Activity in the Pretectum-ablated Zebrafish Larvae

  1. To prepare a recording chamber, put a secure-seal hybridization chamber gasket on a glass slide, with the adhesive side facing on the glass, and remove the top seal.
    Note: This creates a small recording chamber that is 9 mm in diameter and 0.8 mm in depth (Figure 3A).
  2. Next, place a nylon mesh (size of opening: 32 µm) on a 50-mL tube that has the bottom cut open. Use the cap to attach the mesh on the tube (Figure 3B).
  3. Prepare the paramecia (which is the prey to be used as the visual stimulus for larva).
    Note: Prepare the Paramecium culture (steps 2.3.1 and 2.3.2) beforehand.
    1. Obtain paramecia seed culture from commercial sources or academic bio-resource centers24 in advance.
    2. Culture the paramecium for several days in water containing autoclaved rice straw and a pellet of dry beer-yeast22 (Figure 3C).
    3. Pour the paramecium culture through 2 sieves successively (one with a 150-µm aperture, followed by another with a 75-µm aperture) to remove debris from the culture.
    4. Collect paramecia in the flow-through from the previous step on a nylon mesh (13-µm aperture).
    5. Re-suspend the paramecia on the nylon mesh into a glass beaker using a squeeze bottle of system water (Figure 3D).
  4. Rinse the mesh (Figure 3B) in system water 2x (Figure 3E).
    Note: The purpose of this step is to remove any possible odorants and tastants contained in the paramecium culture medium, as the goal of the present study is to observe visually driven neuronal activity.
  5. Place a zebrafish larva in the tricaine solution to anesthetize.
  6. Mount a single larva in 2% low melting-point agarose.
    1. First, microwave 2% low melting-point agarose and add 1/10 volume of 10x concentrated tricaine to the agarose.
    2. Place one drop of the tricaine-containing agarose onto the recording chamber (Figure 3A).
    3. After confirming the agarose is not too hot, place the anesthetized larva (from step 2.5) into the agarose, immediately removing any excess agarose so that the surface of the agarose looks slightly convex.
    4. Quickly orient the larva into an upright position with a dissecting needle (Figure 1C).
      Note: These procedures must be completed within several seconds before the agarose solidifies.
    5. Once the larva is properly positioned, allow 5 min for the agarose to solidify completely. Then, pour a drop of 1x tricaine solution on the agarose.
  7. Remove the agarose around the head of the zebrafish larva and make space for the paramecium to swim using a surgical knife. To do this, first, make a few small cuts in the agarose (Figure 3F). Then, carefully remove the excess agarose by gently pouring system water on the chamber.
    Note: At this step, the tricaine will be washed out.
  8. Next, put one paramecium in the recording chamber to serve as a visual stimulus.
    Note: When the paramecium swims near the head of the zebrafish larva, it will evoke a neuronal response (Figure 3G).
  9. Place the recording chamber under an epi-fluorescence microscope equipped with a scientific CMOS camera (Figure 3H) and select a 2.5X objective lens (Figure 3I).
  10. Collect time-lapse recordings of the GCaMP fluorescence signals.
    1. Start the image acquisition application for the equipped camera.
    2. Click "Sequence Pane" and select "Hard Disk Record" on the pane. In the Scan Settings section, set the "Frame Count" to 900 or any other total frame number desired.
      Note: If available, use time-lapse recording software with a module (here, "Hard Disk Record") that enables efficient saving of the data onto a hard drive.
    3. In the "Capture" pane, set the exposure time at 30-ms (i.e., 33.3 fps), and Binning 2 x 2.
    4. On the microscope controlling touch panel, choose a filter set for GFP, as the GCaMP has similar excitation/emission spectra to GFP.
    5. Click "Live" on the Capture pane to locate the larva in the camera view and focus (Figure 4A), and then click "Stop Live" and click the "Start" button. Save the movie in .cxd or any other format that holds information about the acquisition condition.
  11. After the recordings, analyze the GCaMP6s fluorescent signals (Ca signals) by obtaining mean pixel values for the ROI set on a brain structure in the time-lapse movie using the free software Fiji25.
    Note: Fiji is a version of ImageJ with many useful plug-in's preinstalled and can read .cxd format image files with the Bio-Formats plug-in.
  12. If the larva move slightly during the recording, perform image registration by running the TurboReg plug-in26 in Fiji. From the menu, select 'Plugins', 'Registration', and 'TurboReg'.
  13. Consider how to analyze the data according to the objective of the study. The following is an example.
    1. Calculate the F/F0 (fluorescence intensity at each time, divided by the fluorescence intensity at rest or before any Ca transient has occurred) as follows:
    2. Set ROIs on the pretectum or the ILH using the ROI Manager: in the menu, select "Analyze," "Tools," "ROI Manager", and "Add" to the list of the ROIs (Figure 4A).
    3. Calculate the mean pixel values for the ROIs (i.e., fluorescence intensities of GCaMP6s) by selecting on the ROI Manager panel: "More," "Multi-Measure", and "OK." Save the Results as a spreadsheet file.
    4. As the signals are noisy, average the signals for 11 time-points (moving average) using an application that can handle spreadsheet data.
    5. Divide F (fluorescence intensities over time) by F0 (fluorescence intensity at the basal level) to calculate the normalized fluorescence intensity. As an example of data visualization, changes in normalized GCaMP6s fluorescence intensity in the pretectum and the ILH are color-coded and mapped on the paramecium trajectories (Figure 4B – D).

3. Assessment of Behavioral Consequences Following Laser Ablation

  1. Set up a behavioral recording system that consists of a stereoscope equipped with a video camera. Use a camera with an appropriate image acquisition software, commercial or custom-made (Figure 5A).
  2. Optimize the lighting condition so that the paramecium can be detected by image processing. For example, use a ring white LED light with a spacer (Figure 5B).
    Note: The distance from, and the angle of, the LED affects the appearance of the sample (i.e., bright in dark background or dark in bright background) and are, therefore, critical for successful image processing. Determine the best height of the spacer (Figure 5C).
  3. Place a zebrafish larva (recovered from the laser-ablation experiment described in Section 1) in a behavioral recording chamber (which was attached to a glass slide) with the original top seal removed (Figure 5D).
  4. Collect 50 paramecia from the culture (step 2.3.5) using a micropipette and place them in the recording chamber.
  5. Place a cover slip on top of the recording chamber. Put a small drop of water on the cover slip before placing on the water surface of the recording chamber to avoid introducing air in the chamber.
    Note: In this step, some water with paramecia will overflow from the recording chamber. The remaining number of paramecia in the recording chamber will be approximately 30-40.
  6. Place the recording chamber (containing a larva and paramecia) in the lighting system (Figure 5D).
  7. Start the time-lapse recording at 10 fps for 11 min (6,600 frames).
  8. (Optional) For each larva that was tested for behavior, observe the fluorescence of the laser-ablated areas by fluorescent microscopy to confirm the effectiveness of the laser-ablation (i.e., absence, or significantly reduced number of, fluorescent cells in the laser-irradiated area).
    Note: Even after irradiation, some fluorescent cells can still be observed owing to later onset of Gal4 gene expression in cells that differentiated after ablation27.
  9. After recording the larva's behavior, to compensate for the lack of uniformity in the background, perform a pixel-by-pixel division of each frame by an average image in Fiji: click 'Process', 'Image Calculator', 'Operation: Divide', '32-bit(float)result', and 'OK'. To make an average image, click 'Image', 'Stacks', 'Z-Project', 'Average intensity', and 'OK' (Figure 5E, F).
  10. Count the number of paramecia left in the chamber by clicking 'Analyze', 'Analyze Particles', setting an area range that covers all the paramecia, checking the 'Show:Masks' checkbox, and clicking 'OK'. The 'Show:Masks' option will provide an extracted paramecia image (Figure 5G), with a list of the number of particles (paramecia) in each frame.
  11. Plot the number of paramecia left in the recording chamber over time. Because the estimates of the number of paramecia are noisy, we recommend performing a moving average on each point in a range of 600 frames (1 min) on the spreadsheet.

Representative Results

Specific neurons were genetically labeled with either EGFP or GCaMP6s, whose expression were driven in Gal4 lines. A Gal4 line gSAIzGFFM119B was used to label a nucleus in the pretectal area (magnocellular superficial pretectal nucleus), and a subpopulation of olfactory bulb neurons. Another Gal4 line, hspGFFDMC76A, was used to label the ILH. We laser-ablated the pretectal neurons bilaterally (Figure 2A left panel) and also ablated neurons in the olfactory bulb bilaterally as a control (Figure 2A right panel) in zebrafish larvae of a Gal4 line gSAIzGFFM119B that were mated with UAS:EGFP reporter fish. Results show that two-photon laser can ablate targeted cells while leaving adjacent cells or neurites unaffected (Figure 2B).

The pretectal neurons project their axons toward the ILH ipsilaterally. Here, we investigated their functional connectivity using Ca imaging. Neuronal activity in this region can be observed as Ca signals with a Ca probe GCaMP6s (Figure 4A), whose expression was driven by a Gal4 line gSAIzGFFM119B (Figure 4B) or another Gal4 line hspGFFDMC76A (Figure 4C). The colored arrowheads (Figure 4) show swimming directions and trajectories of the paramecium, as well as color-coded Ca signal-changes in the specified brain area, which were evoked by the sight of the swimming paramecium (Figure 4B-D). Both the pretectum (Figure 4B) and the ILH (Figure 4C) showed neuronal activity in the proximal presence of prey, suggesting that both neuronal activities are visually driven.

By using the double Gal4 GCaMP6s larvae (gSAIzGFFM119B; hspGFFDMC76A; UAShspzGCaMP6s), we ablated the pretectal neurons unilaterally and further performed Ca imaging to observe neuronal activity in the pretectum and the ILH in the ablated larvae. The left pretectum that was laser-ablated showed residual to no neuronal activity (Figure 4D, top left), suggesting that laser-ablation was successful. However, the ipsilateral ILH showed dramatically reduced neuronal activity (Figure 4D bottom left), suggesting that the major input to the ILH comes from the ipsilateral pretectum. In contrast, the ILH on the other side of the laser-ablated pretectum (Figure 4D bottom right) showed neuronal activity comparable to the neuronal activity in the ipsilateral pretectum (Figure 4D, top right), which suggests that the right ILH is receiving inputs from the right pretectum.

The choice of which behavioral assay to use in an experiment depends on the possible role(s) of the neurons under investigation. Here, we show an example of a prey-capture assay following ablation of a pretectal nucleus that was identified as a prey detector21. Using the lighting system shown in Figure 5A-D, the number of paramecium in the recording chamber can be counted by image processing (Figure 5E-G). Automated extraction of eyes, and calculation of eye positions (i.e., changes in the angles of the eyes) can also be possible because the eyes of the zebrafish larva appear darker than the background in this lighting condition (Figure 5H).

Results of the experiment show that bilateral-ablation of the pretectum abolished prey-capture activity (Fig. 5I, PT) while ablation of a subpopulation of neurons in the olfactory bulb did not (Figure 5I, OB). These results, together with experiments shown in Figure 4, suggest that the pretecto-hypothalamic circuit is essential in prey-capture behavior.

Figure 1
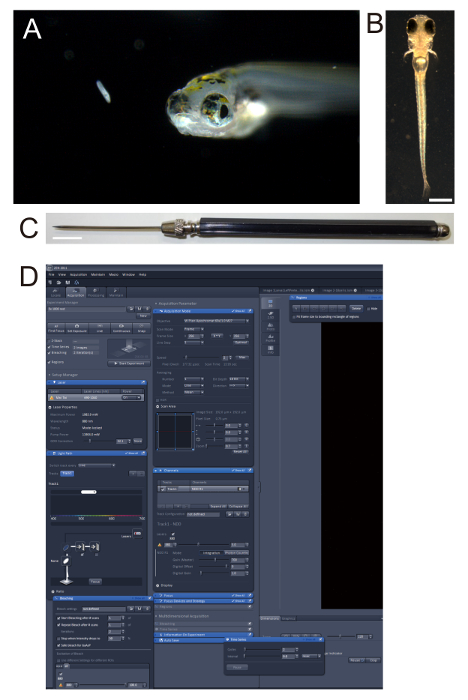
Figure 1. Zebrafish larvae. (A) Five-day old (5-day post-fertilization (5-dpf)) zebrafish larva and its prey, a paramecium. (B) 4-dpf nacre larva embedded in 2% low melting-point agarose. Note that the nacre strain lacks black pigments on the body while the retinal pigment epithelium is intact. Scale bar: 0.5 mm. (C) Dissecting needle used for orienting zebrafish larvae in agarose. Scale bar: 1 cm. (D) Screenshot of the software used in the two-photon microscopy, showing "Bleaching", "Time Series", and "Regions" panels that were used in ablation. Please click here to view a larger version of this figure.

Figure 2
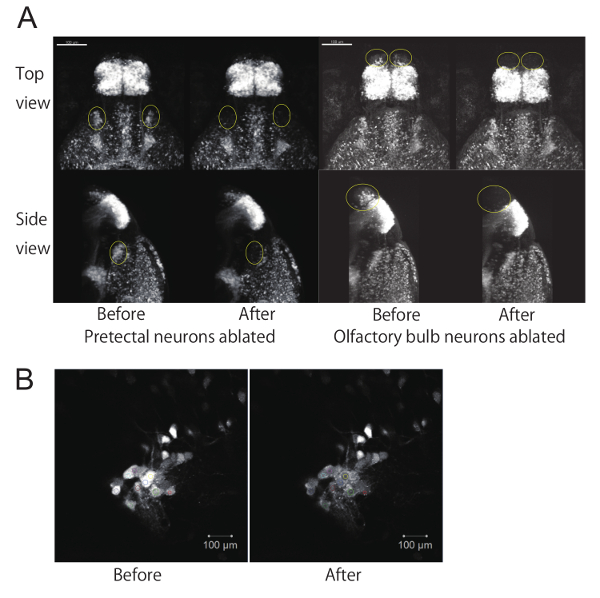
Figure 2. Ablation of a subpopulation of neurons using a two-photon laser microscope. (A) EGFP fluorescent images of 4-dpf zebrafish larvae before and after ablation of neurons. Top view and side view of 3D reconstructed z-stack images using image processing software. The z-stack images were taken with a 20X objective lens. The ablated areas (either the pretectum or olfactory bulb) are circled in yellow. Scale bar: 100 µm. (B) Example of laser ablation at a single focal plane using the "Bleaching" function. Laser-irradiated areas (set as ROIs) are shown in colors on each cell. Scale bar: 10 µm. Please click here to view a larger version of this figure.

Figure 3
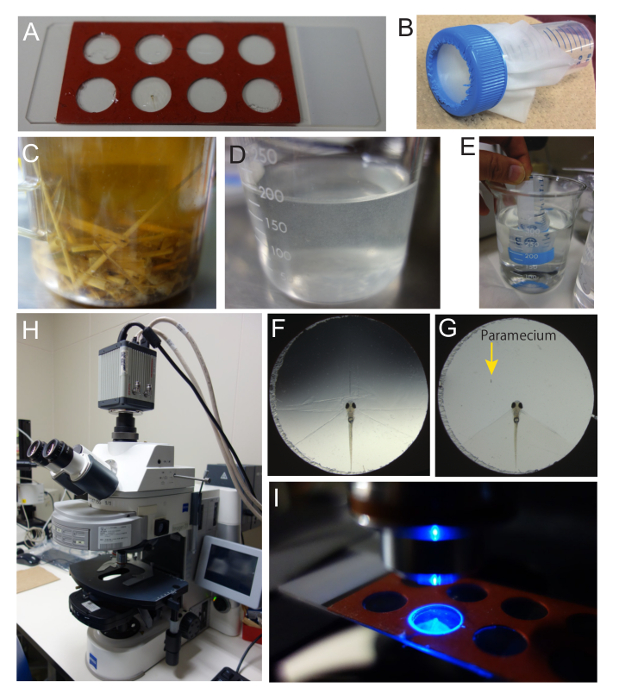
Figure 3. Preparation of zebrafish larvae and paramecia for Ca imaging. (A) Recording chamber. A commercially available 9 mm diameter x 0.8 mm depth hybridization gasket with 8 chambers was utilized as the recording chamber. The gasket was put on a glass slide and adhered. The seal on the top of the gasket was peeled off. (B) The nylon mesh (32 µm) used to rinse the paramecia. The mesh was placed on a 50-mL tube. (C) Paramecium culture containing rice straw and dry yeast pellets. (D) Paramecium stock solution prepared from the culture shown in C. (E) Paramecium stock solution was rinsed with system water twice to remove possible olfactory and gustatory cues in the medium. (F) Paramecium embedded in the recording chamber. To remove a portion of agarose, several cuts were made. (G) Recording chamber with a zebrafish larva and a paramecium. The majority of the agarose was removed to allow the paramecium to swim. The head of the zebrafish larva is exposed. (H) Upright fluorescent microscope used in Ca imaging. The microscope is equipped with a scientific CMOS camera. (I) Zebrafish larva in the recording chamber under the microscope with the excitation light on. With a 2.5X objective lens, the illuminated area is slightly larger than the size of the chamber. Please click here to view a larger version of this figure.

Figure 4
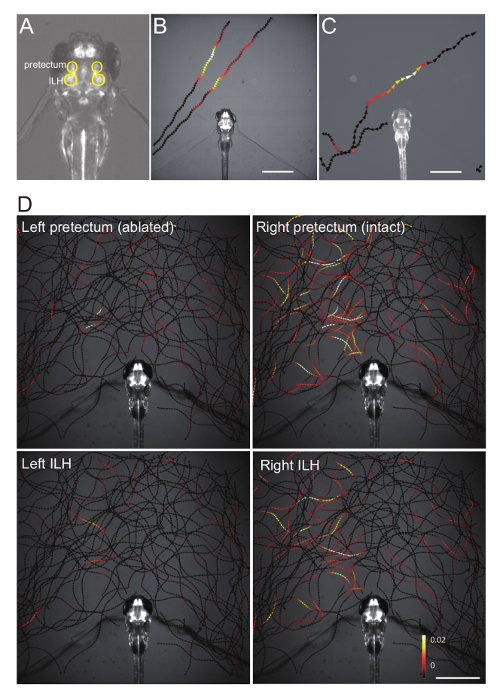
Figure 4. Representative Ca imaging data. (A) Position of the pretectum and the inferior lobe of the hypothalamus (ILH), circled in yellow, in a double Gal4 hspGFFDMC76A; gSAIzGFFM119B; UAShspzGCaMP6s zebrafish larva. (B) Changes in the pretectum Ca signal (averaged bilaterally), color-mapped onto the trajectories of a paramecium in a gSAIzGFFM119B; UAShspzGCaMP6s larva. Scale bar: 1 mm. (C) Changes in the ILH Ca signal (averaged bilaterally), color-mapped on the trajectories of a paramecium in a hspGFFDMC76A; UAShspzGCaMP6s larva. Scale bar: 1 mm. (D) Changes in the pretectum and the ILH Ca signals color-mapped on the trajectories of a paramecium in a hspGFFDMC76A; gSAIzGFFM119B; UAShspzGCaMP6s larva that was subjected to two-photon laser-ablation of the left pretectum. Scale bar: 1 mm. This image was reproduced from the same data previously published21. Please click here to view a larger version of this figure.

Figure 5
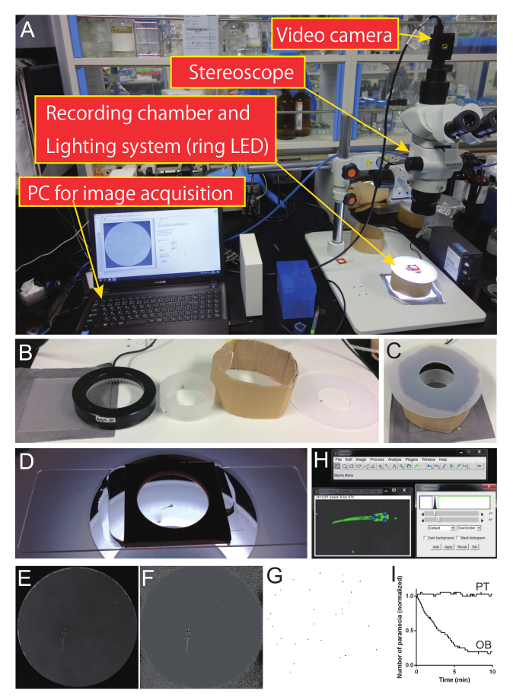
Figure 5. Prey capture assay and representative data in laser-ablated zebrafish larvae. (A) Behavioral recording system. The stereomicroscope was equipped with a CMOS camera. Images were acquired using a custom-made script. (B) Components of the lighting system. A grey-colored paper, a glass diffuser, white LED ring light, diffuser, a custom-made spacer (cardboard), and diffuser with a hole at the center. (C) The lighting system assembled from the parts shown in B. (D) Recording chamber for the prey capture assay. A chamber (diameter: 20 mm; depth: 2.5 mm) was placed on a glass slide. The original top seal of the chamber was peeled off. A glass-cover was put on the recording chamber. (E) Raw image from a frame of the recorded movie. (F) A frame divided (pixel-by-pixel) by an average image in a movie. Note that the non-uniform background in lighting can be compensated by this image processing. (G) Paramecia extracted from a frame using the "Particle Analysis" function in Fiji. (H) Example of image in Fiji with an applied threshold. Paramecia appear bright, whereas the eyes of the zebrafish larva appear dark, and the background is grey. Changes in eye positions (i.e., angles with respect to the body axis) can be calculated, if necessary. (I) Representative experimental data of paramecium consumption in an olfactory-bulb-ablated control larva (OB) and a pretectum-ablated larva (PT). Pretectum ablation significantly reduced prey hunting ability while olfactory bulb ablation did not affect it. Please click here to view a larger version of this figure.

Discussion

Although the two-photon laser has an excellent spatial resolution to specifically ablate individual neurons, great caution should be taken to avoid any undesired damage on the brain tissue owing to heat. The most important step in the ablation experiment is to determine the optimal amount of laser irradiation. Insufficient irradiation fails to kill the neurons. Too much irradiation will heat-damage the surrounding tissue, which will result in undesired effects. The optimal range of laser irradiation (areas of the ROIs, number of iterations, and scanning speed) appears to be narrow. A few factors affect the efficiency of the ablation.

First, by using different fluorescent reporter proteins, the ablation conditions need to be optimized for each reporter. GCaMP expression is observed in the cytoplasm devoid of nuclei. In contrast, EGFP fluorescence appears throughout the inside of the cell, which may be advantageous for efficient and specific ablation of the targeted cells, compared to GCaMP. The use of GCaMP is also disadvantageous as a laser-ablated GCaMP-expressing cell can exhibit increased fluorescence intensity owing to immediate massive Ca influx, in contrast to decreased fluorescence intensity when EGFP was used for ablation. Thus, the change in fluorescence cannot be a reliable indicator of the extent of ablation with GCaMP. In such cases, it may be necessary to validate ablation by observing the loss of fluorescent cells after a specific period. Absence or significant reduction of the Ca signals in the ablated area can be another criterion for successful ablation with GCaMP.

Second, the amount (i.e., scan speed, iteration number of scans) of laser irradiation required for successful ablation can vary depending on the depth of the location of the neurons from the surface of the brain. Compared with cells located near the surface, those located deep inside the brain require more laser irradiation, thus, making it more difficult to ablate them. Optimization for the amount of laser irradiation should be specifically determined for each targeted subpopulation of neurons.

Third, it was empirically observed that setting a number of ROIs in a small area in one scan often heat-damaged the tissue around the cells as well (judged by the appearance of bubbles in the laser-irradiated area), whereas targeting one cell alone, or sparsely distributed ROIs in a scan under the same condition did not have harmful effects. In the present study, bleaching was applied only on a small region (approximately one third of the cell body size) to avoid damage to tissues outside of the targeted cells. Typically, 5-10 cells were targeted on each focal plane (4-8 planes to cover the entire pretectal area).

In addition to optimizing the amount of laser irradiation, extensive validation of laser ablation by performing control experiments is critical. One control experiment can include laser ablation of another subpopulation of cells that are unlikely to be involved in the behavior being studied. Olfactory bulb neurons labeled in the same Gal4 line served as control in the present study (Figure 2A, right, and Figure 5I). However, for the reason described above, no groups of neurons can serve as an ideal control. Each subpopulation of neurons differs from the others with respect to their position in the brain, cell density, fluorescent reporter transgene expression level, the proliferation rate, and the timing of the reporter transgene expression. These differences make it impossible to use the exact same setting for ablation (the 'Bleaching' function) in control experiments. Thus, different types of control experiments should be also considered, such as measurements of the optokinetic response, visual behavior28, and basal activity in locomotion21 to ensure the specific effect of the ablation.

In our experience, ablation of dozens of the pretectal cells bilaterally, takes approximately 1 h (from embedding in agarose, ablation using a two-photon microscope, to retrieving from the agarose after ablation). Up to 8 larvae a day (e.g., 4 larvae for experimental and 4 for control) can be ablated; hence, a couple of sets of experiments may be required to ensure that there are enough larvae for an experimental group (e.g., n = 12) and for a control group (e.g., n = 12). Additionally, it is desirable to allow half a day or one day for the larvae to recover from ablation (e.g., laser ablation at 4-dpf followed by a behavioral recording at 5-dpf, or ablation in the morning followed by Ca imaging in the afternoon). During this recovery time, any ill-looking larvae should be excluded from the study.

The protocol used to analyze the obtained data depends completely on the objective of the study. The present study focused on the relationships between the location of paramecium in the visual field and neuronal activity in the pretectum and the ILH. Considering the slow decay (~ seconds) of the GCaMP6s signals29, only the timing of the increase, but not the decrease, of the GCaMP6s signals correlates with the location of the paramecium. The Ca signals can be high even when the paramecium move away. Hence, we only included increased fluorescence intensity of GCaMP6s in the data presentation. This type of analysis often requires custom-made scripts written with specific programming languages or macro languages. The scripts used in this paper are available upon request.

The restrained condition (i.e., agarose-embedded) might be stressful to the zebrafish larvae to some extent; however, we did not observe apparent stress-induced neuronal activity or behavior in this condition, when compared with the free-swimming condition21,22. Agarose-embedded zebrafish larvae can survive at least 24 h, (probably more) without any apparent problem. Paramecium-driven Ca signals in the pretectum and the ILH in the constrained condition were similar to that observed in free-swimming larvae21. Zebrafish visual behavior can be controlled by the circadian rhythm. Hence, we conducted behavioral experiments from early to late evening. Wild type and control larvae consumed a significant number of paramecia during this recording time.

The functional and behavioral assays described here utilize the most commonly available equipment that can be found in many laboratories or could be easily set up, and thus it should have broad applications in different fields of behavioral science.

Disclosures

The authors have nothing to disclose.

Acknowledgements

These studies were funded by grants received from the MEXT, JSPS KAKENHI Grant Numbers JP25290009, JP25650120, JP17K07494, and JP17H05984.

Materials

NuSieve GTG Agarose Lonza Cat.#50080 low-melting temperature agarose
6 cm petri dish FALCON Product#:351007
dissecting needle AS ONE Corporation Cat. No. 2-013-01 https://keystone-lab.com/en/item/detail/404142
LSM7MP Carl Zeiss two-photon laser scanning microscope
W Plan-Apochromat 63x/1.0 Carl Zeiss 63X objective lens
Imager.Z1 Carl Zeiss an epi-fluorescence microscope
ZEN Carl Zeiss Image acquisition software for confocal microscopes
Secure-Seal Hybridization Chamber Gasket, 8 chambers, 9 mm diameter x 0.8 mm depth Molecular Probes Catalogue # S-24732 Used as a recording chamber in Ca imaging
Imageing Chambers Grace Bio-Labs CoverWell Imaging Chambers PCI-A-2.5 Used as a behavioral recording chamber
surgical knife MANI Ophthalmic knife MST15
ORCA-Flash4.0 Hamamatsu Photonics model:C11440-22CU a scientific CMOS camera
HCImage Hamamatsu Photonics image acuisition software
Hard Disk Recording module Hamamatsu Photonics An software module that enables saving the movie files onto a hard disc drive in a short time
SZX7 Olympus stereoscope
DF PL 0.5X Olympus objective lens for SZX7
Point Grey Grasshopper3 4.1 MP Mono USB3 Visio FLIR Systems, Inc. Product No. GS3-U3-41C6NIR-C CMOS camera
XIMEA xiQ camera XIMEA Product No. MQ042RG-CM CMOS camera
a ring LED light CCS Model: LDR2-100SW2-LA White LED
Nylon mesh 32µm Tokyo Screen N-No.380T http://www.tokyo-screen.com/cms/sta20347/
Nylon mesh 13µm Tokyo Screen N-No. 508T-K http://www.tokyo-screen.com/cms/sta20347/
Metal seive 150 micron aperture Tokyo Screen http://www.tokyo-screen.com/cms/sta20341/#ami
Metal seive 75 micron aperture Tokyo Screen http://www.tokyo-screen.com/cms/sta20341/#ami
EBIOS Asahi Food & Healthcare, Co. Ltd. dry beer yeast
LabVIEW National Instruments an integrated development environment for programming
Mai-Tai HP Spectra Physics  two-photon laser 

References

  1. Feierstein, C. E., Portugues, R., Orger, M. B. Seeing the whole picture: A comprehensive imaging approach to functional mapping of circuits in behaving zebrafish. Neuroscience. 296, 26-38 (2015).
  2. Nakai, J., Ohkura, M., Imoto, K. A high signal-to-noise Ca(2+) probe composed of a single green fluorescent protein. Nat Biotechnol. 19 (2), 137-141 (2001).
  3. Muto, A., et al. Genetic visualization with an improved GCaMP calcium indicator reveals spatiotemporal activation of the spinal motor neurons in zebrafish. Proc Natl Acad Sci U S A. 108 (13), 5425-5430 (2011).
  4. Lorent, K., Liu, K. S., Fetcho, J. R., Granato, M. The zebrafish space cadet gene controls axonal pathfinding of neurons that modulate fast turning movements. Development. 128 (11), 2131-2142 (2001).
  5. Asakawa, K., et al. Genetic dissection of neural circuits by Tol2 transposon-mediated Gal4 gene and enhancer trapping in zebrafish. Proc Natl Acad Sci U S A. 105 (4), 1255-1260 (2008).
  6. Sternberg, J. R., et al. Optimization of a Neurotoxin to Investigate the Contribution of Excitatory Interneurons to Speed Modulation In Vivo. Curr Biol. , (2016).
  7. Arrenberg, A. B., Del Bene, F., Baier, H. Optical control of zebrafish behavior with halorhodopsin. Proc Natl Acad Sci U S A. 106 (42), 17968-17973 (2009).
  8. Orger, M. B., Kampff, A. R., Severi, K. E., Bollmann, J. H., Engert, F. Control of visually guided behavior by distinct populations of spinal projection neurons. Nat Neurosci. 11 (3), 327-333 (2008).
  9. Huang, K. H., Ahrens, M. B., Dunn, T. W., Engert, F. Spinal projection neurons control turning behaviors in zebrafish. Curr Biol. 23 (16), 1566-1573 (2013).
  10. Smear, M. C., et al. Vesicular glutamate transport at a central synapse limits the acuity of visual perception in zebrafish. Neuron. 53 (1), 65-77 (2007).
  11. Bianco, I. H., Engert, F. Visuomotor transformations underlying hunting behavior in zebrafish. Curr Biol. 25 (7), 831-846 (2015).
  12. Trivedi, C. A., Bollmann, J. H. Visually driven chaining of elementary swim patterns into a goal-directed motor sequence: a virtual reality study of zebrafish prey capture. Front Neural Circuits. 7, 86 (2013).
  13. Jouary, A., Haudrechy, M., Candelier, R., Sumbre, G. A 2D virtual reality system for visual goal-driven navigation in zebrafish larvae. Sci Rep. 6, 34015 (2016).
  14. Muto, A., Ohkura, M., Abe, G., Nakai, J., Kawakami, K. Real-time visualization of neuronal activity during perception. Curr Biol. 23 (4), 307-311 (2013).
  15. Del Bene, F., et al. Filtering of visual information in the tectum by an identified neural circuit. Science. 330 (6004), 669-673 (2010).
  16. Semmelhack, J. L., et al. A dedicated visual pathway for prey detection in larval zebrafish. Elife. 3, 04878 (2014).
  17. Preuss, S. J., Trivedi, C. A., vom Berg-Maurer, C. M., Ryu, S., Bollmann, J. H. Classification of object size in retinotectal microcircuits. Curr Biol. 24 (20), 2376-2385 (2014).
  18. Romano, S. A., et al. Spontaneous Neuronal Network Dynamics Reveal Circuit’s Functional Adaptations for Behavior. Neuron. 85 (5), 1070-1085 (2015).
  19. Barker, A. J., Baier, H. Sensorimotor decision making in the zebrafish tectum. Curr Biol. 25 (21), 2804-2814 (2015).
  20. Ewert, J. -. P. . Neuroethology: an Introduction to the Neurophysiological Fundamentals of Behavior. , (1980).
  21. Muto, A., et al. Activation of the hypothalamic feeding centre upon visual prey detection. Nat Commun. 8, 15029 (2017).
  22. Muto, A., Kawakami, K. Calcium Imaging of Neuronal Activity in Free-Swimming Larval Zebrafish. Methods Mol Biol. 1451, 333-341 (2016).
  23. Westerfield, M. . THE ZEBRAFISH BOOK, 5th Edition. , (2007).
  24. . Fiji Available from: https://fiji.sc (2017)
  25. Thevenaz, P., Ruttimann, U. E., Unser, M. A pyramid approach to subpixel registration based on intensity. IEEE Trans Image Process. 7 (1), 27-41 (1998).
  26. Mueller, T., Wullimann, M. F. BrdU-, neuroD (nrd)- and Hu-studies reveal unusual non-ventricular neurogenesis in the postembryonic zebrafish forebrain. Mech Dev. 117 (1-2), 123-135 (2002).
  27. Muto, A., et al. Forward genetic analysis of visual behavior in zebrafish. PLoS Genet. 1 (5), 66 (2005).
  28. Chen, T. W., et al. Ultrasensitive fluorescent proteins for imaging neuronal activity. Nature. 499 (7458), 295-300 (2013).
check_url/57485?article_type=t

Play Video

Cite This Article
Muto, A., Kawakami, K. Ablation of a Neuronal Population Using a Two-photon Laser and Its Assessment Using Calcium Imaging and Behavioral Recording in Zebrafish Larvae. J. Vis. Exp. (136), e57485, doi:10.3791/57485 (2018).

View Video