Ozone is a form of elemental oxygen that occurs in the atmosphere, and is classed as an air pollutant harmful to human health. Using the Schönbein technique, levels of ozone at sites of interest can be quantified. Ozone molecules are comprised of three oxygen atoms bonded in a structure that is highly reactive as an oxidizing agent, and they occur in both the stratosphere and troposphere levels of the atmosphere.
Ozone molecules in the stratosphere form the ozone layer, which helps prevent harmful UV rays from reaching the Earth’s surface. In lower altitudes of the troposphere, ozone is harmful to human health, and as a pollutant contributes to photochemical smog. Ozone can directly damage human respiratory tissue if inhaled, or harm plant tissues and softer materials, including tires on vehicles.
Ozone presence in the troposphere can be quantified using Schönbein paper, a mixture of starch, potassium iodide, and water spread on filter paper. Once dry, the paper changes color in the presence of ozone.
This video will illustrate the process of making Schönbein paper, placing and reading test strips, and quantifying ozone levels using the Schönbein color scale.
One way that outdoor tropospheric ozone is formed at ground level is when nitrous oxides and volatile organic compounds from automobile emissions are exposed to sunlight. Consequently, conditions for ozone formation and escalated health concern increase in sunny environments, or at times or locations of heavy automobile use.
Indoors, tropospheric ozone can be formed when electrical discharge from high voltage equipment, like ionic air purifiers, laser printers, or photocopiers, break down the chemical bonds of atmospheric oxygen in the surrounding air. The free radicals of oxygen then combine with an oxygen molecule in the air to create ozone.
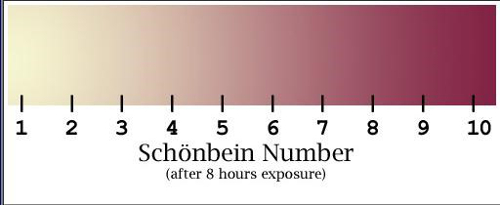
Using Schönbein paper, filter paper impregnated with a starch and potassium iodide solution, tropospheric ozone can be quantified. Ozone in the air will oxidize the potassium iodide on the paper, producing iodine. The iodine reacts with iodide to produce triiodide, which then reacts with the starch also present on the paper, staining it a deep violet. Intensity of this color will depend on the amount of ozone present in the air, with darker colors indicating higher amounts of tropospheric ozone.
Determining the ozone concentration using this method can be performed at almost any site, indoor or outdoors. Now that we are familiar with the principles behind the Schönbein measurement, let us take a look at how to perform the experiment.
To begin the procedure, place 100 mL of distilled water into a 250-mL beaker. To this, add 6 g of cornstarch. Place the beaker onto a heated stir plate. Turn the heat to a medium-high setting, and stir the mixture until it reaches approximately 90 °C and forms a gel. Next, remove the beaker from the heat source and add 1 g, or ¼ teaspoon, of potassium iodide and stir thoroughly until the potassium iodide is dissolved. Allow the solution to cool for 5 min on the bench top.
Lay a piece of filter paper on a glass plate, and using a small paintbrush, carefully brush the paste onto the filter paper. Turn the filter paper over and repeat on the other side, applying the paste as uniformly as possible. Set the paper out overnight away from sunlight to dry. Alternatively, place in a drying oven at 20 °C until dry. Once dry, cut the paper into 1-inch wide strips. If storing the paper for later use, place the strips in a sealable plastic bag or glass jar out of direct sunlight.
To detect ozone, first spray the strips of test paper lightly with distilled water. Hang a minimum of three strips at each data collection site out of direct sunlight, securely fastened by one end to a structure, or hung by wire. Ensure the strips are unobstructed. Leave the test strips to hang for 8 h.
Note where each strip was hung, and using a psychrometer, measure relative humidity at each site. Alternatively, accessing weather data, record relative humidity at each location during paper exposure. If results will not be read immediately, strips can be sealed in an airtight container after exposure.
To observe and record test results, spray the paper with distilled water. Observe the color by comparing it to the Schönbein color scale and record the corresponding number. Calculate the average Schönbein number for each site.
Use the relative humidity data for each site and the Relative Humidity Schönbein Number Chart to convert Schönbein site averages to ozone concentration, or parts per billion.
The ability to measure and record tropospheric ozone levels has many diverse applications, and the results of such tests can have significant implications for human populations.
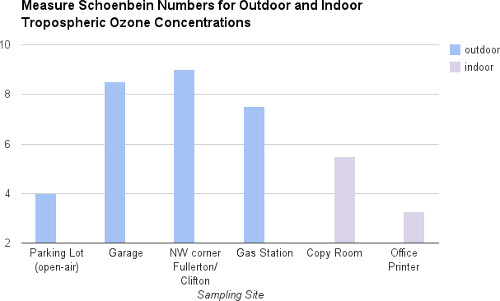
In heavily populated urban centers, the convergence of high automobile traffic and dense human population can be a concern for ozone related health problems. Current US thresholds for ozone set by the Occupational Safety and Health Administration are at 0.1 ppm. Health risks of exposure above this level including headaches; eye, nose, and throat irritation; lung damage and hemorrhage, amongst others. In urban Chicagoland, test strips placed for 8 h on a July day in Evanston, Cicero, and Northbrook recorded ozone levels of 71 ppb, 60 ppb, 71 ppb, respectively.
Indoors, safe thresholds for ozone levels are the same as outdoors, and carry the same potential health risks. To ensure the safety of workers or building residents, any premises with large amounts of high-voltage equipment should be tested for ozone levels. Strips placed in the copy machine room for 8 h recorded an indoor ozone level of 5 ppb, which is well below the United States Office of Safety guidelines.
Because of the action of sunlight transforming nitrous oxide and volatile organic compounds into ozone, heatwaves or exceptionally sunny periods can be of concern for urban residents. Monitoring ozone levels over time can build up a picture of potential risk, and allow authorities to issue warnings or ask residents to reduce automobile use at times of high ozone.
You’ve just watched JoVE’s introduction to measuring tropospheric ozone. You should now understand how tropospheric ozone is formed and why it is a concern, how to make Schönbein paper to test for ozone, and how to interpret test results. Thanks for watching!