Espectroscopía de Raman para el análisis químico
English
分享
概述
Fuente: Laboratorio de Dr. Ryoichi Ishihara: Delft University of Technology
Espectroscopia de Raman es una técnica de análisis vibracional y de otros modos de baja frecuencia en un sistema. En química se utiliza para identificar las moléculas por su huella de Raman. En física de estado sólido se utiliza para caracterizar los materiales y más específicamente para investigar su estructura cristalina o cristalinidad. En comparación con otras técnicas para la investigación de la estructura cristalina (microscopio electrónico de transmisión y difracción de rayos x) micro-Espectroscopía Raman es no destructivo, generalmente no requiere ninguna preparación de la muestra y puede realizarse en volúmenes de muestra pequeños.
Para la realización de Raman espectroscopia láser monocromática se brilla en una muestra. Si requiere la muestra puede ser recubierta por una capa transparente que no es Raman activo (por ejemplo, SiO2) o colocado en agua desionizada. Se recoge la radiación electromágnetica (típicamente en el infrarrojo cercano, visible, o cerca de ULTRAVIOLETA gama) emitida por la muestra, la longitud de onda del láser se filtra (por ejemplo, por un filtro de muesca o paso de banda), y la luz resultante se envía a través de un monocromador (por ejemplo, una rejilla) para un detector CCD. Con esto, la inelástica dispersos, procedentes de Raman dispersión, puede ser capturado y utilizado para construir el espectro de Raman de la muestra.
En el caso de Raman micro-espectroscopía la luz pasa a través del microscopio antes de llegar a la muestra, lo que le permite centrarse en un área tan pequeño como 1 μm2. Esto permite asignación precisa de una muestra, o la microscopia confocal para investigar las pilas de capas. Cuidado tiene que ser tomado, sin embargo, que la pequeña e intensa láser punto no dañar la muestra.
En este video explicaremos brevemente el procedimiento para la obtención de un Raman spectra, y se dará un ejemplo de un espectro de Raman de nanotubos de carbono.
Principles
Procedure
Results
The Raman spectrum taken from multi-walled carbon nanotubes using a 514 nm laser is shown in Figure 1. The linear baseline has been removed and the data has been normalized to the most intense feature around 1,582 cm-1.
Several peaks can be observed, which originate from different crystalline features of the sample. The D-peak at 1,350 cm-1 originates form double resonance elastic phonon scattering with a defect in the crystal lattice. The G-peak (1,582 cm-1) is related to the sp2 hybridized C-C bond and can be found in any graphitic material. This strong peak actually has a shoulder on the right side of the spectrum, which is the D' peak around 1,620 cm-1. This peak is again defect related.
At higher wavenumbers several other peaks can be observed. The G' (or 2D) peak around 2,700 cm-1 is the overtone of the D band, and is caused by two inelastic phonon scattering processes. Because of this it does not need defects and can be found in high crystalline samples. The same is true for the 2D' band around 3,240 cm-1, which is the overtone of the D' band. Finally the D+G around 2,930 cm-1 is the combined overtone of the D and G band.
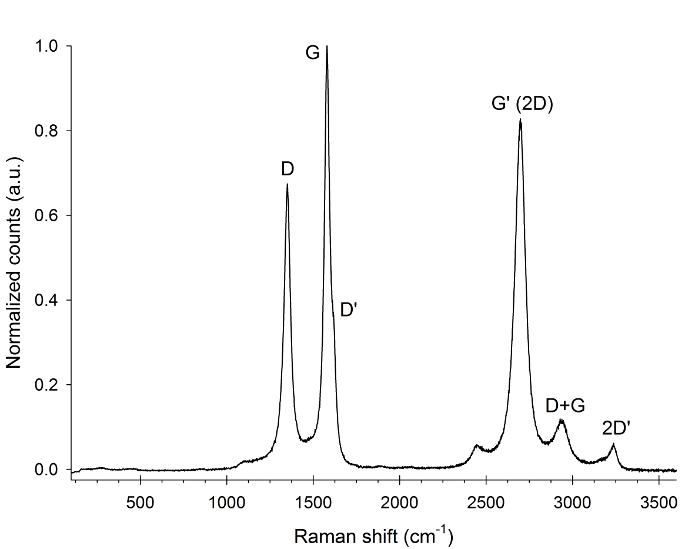
Figure 1. Raman spectrum of multi-walled carbon nanotubes. The spectrum was obtained using a 514 nm laser, the linear baseline was removed by fitting to the flat areas of the spectrum and the spectrum is normalized to the G-peak.
Applications and Summary
Raman spectroscopy can be applied in a wide range of fields, ranging from (bio)chemistry to solid-state physics. In chemistry, Raman spectroscopy can be used to investigate changes in chemical bonds and identify specific (organic or inorganic) molecules by using their Raman fingerprint. This can be done in either the gas, liquid, or solid-state phase of the material. It has been, for instance, used in medicine to investigate the active components of drugs, and Raman gas analyzers are used for real-time monitoring of respiratory gases during surgery.
In solid-state physics Raman spectroscopy is used to characterize materials and determine their crystal orientation, composition, stress, temperature, and crystallinity. It has been used to identify mineral compositions, and can be used in forensic trace evidence analyses. It is also possible to observe plasmons, and other low frequency excitations of the solid using Raman spectroscopy. Specifically for graphitic materials it has been used to investigate the crystallinity, the diameter of single and double-walled nanotubes, and their chirality. For graphene it can also be used to identify the number of graphene layers.
A big advantage of Raman spectroscopy over other spectroscopic methods is that it typically requires no sample preparation if you can focus on the sample with a microscope, can analyze µm-size samples, requires no contact, and is non-destructive.
成績單
Raman spectroscopy exploits the scattering of light to gather molecular information unique to the material under investigation.
When light strikes a molecule, most of the energy is not absorbed, but scatters at the same energy as the incident light. However, a small fraction of scattered radiation appears at energies differing from the incident radiation.
These shifts in energy correspond to vibrational states of molecules and can be used to identify, quantify, and examine the molecular composition of the sample under analysis.
This video will introduce the theory behind this technique, demonstrate a procedure to perform the same in the laboratory, and present some of the ways in which this method is being applied in industries today.
The interaction of radiation with a sample can be thought of as collisions between photons and molecules.
An incoming photon excites the molecule to a short-lived virtual excited state from which it will quickly decay back to its ground state and emit a scattered photon. When there is no exchange in energy taking place, a scattered photon has the same wavelength as the incident photon, and this is called elastic Rayleigh scattering.
Raman scattering represents molecules undergoing vibrational excitation or relaxation as a result of inelastic interaction with photons. If the molecule is raised from a ground state to a virtual excited state and drops back to a higher energy vibrational state, then it has gained energy from the photon. This is also called Stokes scattering.
If a molecule in a higher vibrational energy, gains energy and drops back down to a lower ground state, then the molecule has lost energy to the photon, giving rise to anti-Stokes scattering. At room temperature, the number of molecules in the ground state is higher than those in a higher energy state causing Stokes scattering to be more intense and more commonly examined, than anti-Stokes scattering.
Molecular vibrations and rotations arising from these interactions with incident photons include symmetrical and asymmetrical stretching, scissoring, rocking, wagging, and twisting.
These molecular vibrations are used not only in Raman spectroscopy, but also along side it with other techniques, like infrared spectroscopy. A vibration is “Raman-active”, or detectable by Raman spectroscopy, when it causes a change in the polarizability, or the amount of distortion, of its electron cloud. A vibration is infrared-active when it induces a change in its dipole moment.
For example, symmetrical stretches, like expansion in carbon dioxide, cause electrons to move away from nuclei and become easily polarizable but do not change the dipole moment. An asymmetric stretch, on the other hand, results in change in dipole moment, but no change in polarizability. For these reasons, Raman and infrared spectroscopy are treated as complementary methods of chemical analysis.
Raman spectroscopy is performed by shining an intense monochromatic laser on a sample. Radiation emitted from the sample is collected, and the laser wavelength is filtered out. Scattered light is sent through a monochromator to a CCD detector. In Raman micro-spectroscopy, the laser passes through a microscope before reaching the sample, allowing spatial resolution at the micron level.
The Raman spectrum of a sample is a plot of intensity of scattered radiation as a function of shift in wavenumbers from that of incident radiation. Peak shapes and intensities can indicate molecular structure, symmetry, crystal quality, and concentration of material.
Now that you understand the theory behind this method, let’s explore a protocol to perform Raman microspectroscopy on a sample.
To begin the procedure, turn on the required laser and select the correct optics for the wavelength used. Give the laser 15 min to warm up before beginning the experiment. In the meantime, turn on the computer and load the instrument software.
Choose the correct wavelength for the laser used. Perform the required calibration of the Raman spectroscope. This can be done using a silicon wafer placed on the microscope stage, but here an internal silicon reference sample is used. The Raman spectrum is obtained using an appropriate exposure energy and time. The silicon should give a strong peak at around 520 wavenumbers.
Once calibrated, place the sample underneath the microscope and focus on the layer of interest. A dark enclosure is used to remove stray light. Make sure the path of the laser is not obstructed by light absorbing or Raman-active layers so as to obtain a clean spectrum.
Select the range of wavenumbers that should be scanned by the monochromator. Select a laser intensity that produces sufficient signal, but doesn’t damage the material under investigation. This can be checked by imaging the same spot twice. If the spectrum changes, damage may have occurred.
If the sample is in a completely dark enclosure, a background scan is not needed. Acquire the spectrum of the sample.
Investigate the data using appropriate software and by comparing with available literature. Cosmic rays appear as sharp and intense peaks that must be removed. Laser interference with certain substrates or contaminants can result in a baseline, which is removed by fitting an appropriate curve to the regions of the spectrum that are not expected to contain Raman peaks originating from the sample. For some materials, the different Raman peaks overlap to a degree that peak deconvolution might be necessary.
After these steps are competed, resulting spectra will represent qualitative and quantitative data on species present in the sample.
Here, we’ll examine the Raman spectrum of carbon nanotubes, which are very small, hollow single or multi-layered rolls of graphene sheets. The Raman spectrum taken from multi-walled carbon nanotubes using a 514 nm laser is shown here.
Because carbon nanotubes are represented by crystal lattices, their vibrations are represented by collective vibration “modes”. The G-mode peak at 1,582 wavenumbers is related to the sp2 hybridized carbon-carbon bond that can be found in any graphitic material. There is also a prominent D peak 1,350 wavenumbers represents scattering, caused by a disorder in the crystal lattice. The ratio of the intensity of the G and D modes quantifies the structural quality of the nanotube.
Developments in lasers and computer technologies have made the once tedious Raman spectroscopy one of the most widely used techniques for chemical analysis.
Solid Oxide fuel cells, or SOFCs, have the potential to become a major source of low emissions energy in the coming decades. These cells work by electrochemically converting the energy of a fuel and an oxidant, in this case solid oxides, to electricity. There is still some difficulty in characterizing the electrochemical mechanism of the fuel cell materials in situ. However, Raman Spectroscopy is now increasingly being used to map intricate chemical reaction mechanisms at the anode.
Art objects are spectroscopically examined to reveal their age, composition, and to optimize conditions for conservation. The non-destructive nature of Raman microspectroscopy makes it well suited for this purpose. By focusing a laser on the art sample and plotting the intensity of inelastically scattered light, spectra of artists’ pigments, binding media, or varnishes can be obtained. Raman spectroscopy is even used to identify falsification of art works.
You’ve just watched JoVE’s introduction to Raman Spectroscopy for Chemical Analysis. You should now understand the principles behind the Raman effect and how it applies to Raman spectroscopy, how to perform your own Raman analysis in the lab, and some of the exciting ways in which it is being applied in industries today.
Thanks for watching!