1. Fabrication of the Sensor and Acquisition of the Data
- Preparation of the nickel mold
- Coat a 220 nm-thick layer of negative electron beam resist onto a 600 µm-thick 4-in silicon wafer. Write the designed nanohole array on this wafer using an electron beam lithography system.
- To accelerate the e-beam writing, write the patterns with a low dotmap (N) of 20k for each 300 µm field size (A) (i.e., there are 0.4 billion dots mapped on each 300 µm2 area, and each dot will either be exposed by the e-beam or not, depending on the pattern design). Set the e-beam resist exposure dose for the resist to 110 µC cm−2 and write at a current (I) of 800 pA.
NOTE: In e-beam writing, the exposure dose (D) is controlled by the exposure time for each dot (Tdot), calculated by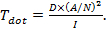 . For the exposure dose at 110 µC cm−2, the e-beam dwelling time on each exposed dot is 0.5 µs12. Since the array captures an area of 1.8 mm2, there are a total of 36 patches of 300-µm2 field areas stitched together to form one large, gold nanohole array.
- To accelerate the e-beam writing, write the patterns with a low dotmap (N) of 20k for each 300 µm field size (A) (i.e., there are 0.4 billion dots mapped on each 300 µm2 area, and each dot will either be exposed by the e-beam or not, depending on the pattern design). Set the e-beam resist exposure dose for the resist to 110 µC cm−2 and write at a current (I) of 800 pA.
- Develop the resist by immersing the 4 inch silicon wafer in the developer solution for 10 s and letting the wafer dry in air.
- Deposit a seed layer of a metal, such as nickel, copper, or aluminum, on the silicon wafer.
- Electroplate the wafer in a plating system in a nickel sulfamate bath. Carry out the electroplating in two steps. In the first step, lasting 95 min, use a current density of 0.7 A dm−2; this completely fills the nanopatterns with nickel. In the second step, lasting 125 min, use 12 A dm−2 to reach 300 µm as the final nickel mold thickness (20 nm). Ensure that the pH value is at 3.5 – 3.8 and that the temperature is at 52 – 54 °C.
- Separate the nickel mold from the silicon substrate by applying gentle mechanical force. Soak the nickel mold in about 100 mL of positive photoresist removal reagent overnight to wash away the residue from the e-beam resist.
- Feed the nickel mold into an oven and dry it at 100 °C for 3 h. Clean it in a plasma etching system with O2 gas at 10 sccm and 100 W for 3 min.
- Coat a 220 nm-thick layer of negative electron beam resist onto a 600 µm-thick 4-in silicon wafer. Write the designed nanohole array on this wafer using an electron beam lithography system.
- Fabrication of the gold nanostructure
- Coat 150 µL of heptadecafluoro-1,1,2,2-tetrahydrodecyl trichlorosilane (FDTS) on the nickel mold in a self-assembly monolayer (SAM) coating machine at 80 °C.
NOTE: This will form an anti-adhesive layer, which will enable the separation of the mold from the photoresist ("demolding") after the completion of the nanoimprinting step. The vaporizing time should be 180 s, and the reaction time should be 900 s. - Imprint the nanopatterns on a 4-in glass wafer that has been coated with a 300 nm-thick layer of photo-curable NIL resist using a nano-imprinter at a pressure of 10 bar and a temperature of 40 °C for 10 min.
- Transfer the mold, the photoresist, and the glass wafer to a UV light curing system and photocure with 75 mW cm-2 of UV exposure for 30 s.
NOTE: If all steps have been followed correctly, the nickel mold should easily be demolded from the photoresist. - In a reactive ion etching (RIE) system, perform a blank etch of the photoresist on the glass substrate, with an O2 gas flow of 10 sccm, at 50 W for 2 s to expose the glass on the indented areas.
- Deposit a 5 nm-thick layer of chromium (Cr) for metal adhesion and a 100-nm layer of gold (Au) for the plasmonic sensor on the glass wafer in an electron-beam deposition machine. Use a deposition rate of 1 Å s−1 for Cr and 2 Å s−1 for Au.
- Perform lift-off of the photoresist by O2 plasma etching for 3 min followed by a 15-s sonification step in acetone.
- Dice the sample into 5 mm × 5 mm chips. The nanohole array will occupy the central 2 mm × 2 mm of the chip.
- Coat 150 µL of heptadecafluoro-1,1,2,2-tetrahydrodecyl trichlorosilane (FDTS) on the nickel mold in a self-assembly monolayer (SAM) coating machine at 80 °C.
- Acquisition of the data
- Set up the apparatus to make the optical measurements such that a beam of white light exiting through the end of the transmitter optical fiber is collimated and is incident on the sensor surface (nanohole array) at 90°.
NOTE: Light is transmitted through the whole nanohole array. - Collect the transmitted signal with the receiver optical fiber and record it with a UV-visible spectrometer operating within the range of 300 to 1,000 nm.
- Set the acquisition time for each frame to 20 ms. Average 100 frames to obtain the final spectrum to lower the noise in the measurements.
- Use plotting software to analyze the data based on the previously identified transmission peaks (using a Lorentz-based method).
- Set up the apparatus to make the optical measurements such that a beam of white light exiting through the end of the transmitter optical fiber is collimated and is incident on the sensor surface (nanohole array) at 90°.
2. Sensor Bulk Sensitivity Test
- Deposit the standard RI liquid into the liquid cell, with the RI varying from 1.31 to 1.39.
- Immerse the sensor chip in the standard RI liquid and align it with the beam of white light. Obtain the transmission spectrum.
- Clean the sensor chip after each measurement with a surface-active cleaning reagent and dry it with nitrogen gas.
3. Sensor Surface Modification
- Prior to any chemical modifications, clean the sensor chips by sequential immersion in isopropanol, acetone, and deionized water. Dry at room temperature in a stream of dry nitrogen gas.
- Incubate the sensor chips in an ethanolic solution of 0.4 mM 10-carboxy-1-decanethiol and 1.6 mM 1-octanethiol for 12 h at room temperature.
NOTE: This will form an amine-reactive self-assembly monolayer (SAM). - Use ethanol to rinse thoroughly and dry at room temperature.
- Make a mixture of 75 mM sulfo-N-hydroxysuccinimide (sulfo-NHS) and 15 mM 1-ethyl-3-(3-dimethylaminopropyl) carbodiimide (EDC). Immerse the chips in this mixture for 15 min.
NOTE: This will activate the carboxylic group of the SAM. - Spot 50 µL of 200 µg/mL anti-troponin antibody solution made in a pH 4.5 acetate buffer on the sensor surface and incubate for 30 min.
- Deactivate the unreacted esters by immersing the sensor chip in 1 M ethanolamine-HCl solution for 15 min.
- Rinse the chip with deionized water and dry it in a stream of dry nitrogen gas at room temperature.
4. cTnI Assay
- Block any non-specific binding by spotting 100 µL of 1% bovine serum albumin (BSA) solution onto the surface. Incubate for 15 min.
- Rinse the sensor chips three times in phosphate-buffered saline (PBS) solution. Insert the chip into the measurement cell to record the transmission spectrum.
NOTE: This is the reference spectrum. - Spot 50 µL of cTnI standard onto the chip surface and incubate in a moist environment for 30 min.
- Rinse the sensor chips three times in PBS solution and insert it into the measurement cell to record the transmission spectrum.
NOTE: This is the after-binding spectrum. - Submerge the chips in 50 mM glycine-HCl (pH 2) for 1 min and then rinse in PBS solution three times to regenerate the chip surface. Measure the transmission spectrum in PBS to verify the success of the regeneration step.
5. Surface Plasmon Resonance (SPR) Measurement
- Run the multiplexed SPR sensor chip on the SPR system with PBS-T buffer.
NOTE: The composition of PBS-T buffer is 20 mM Na-phosphate, 150 mM NaCl, and 0.05% Tween 20. The pH is 7.4. - Use cTnI standard and the antibody, as described in step 4.
- Activate 3 out of the 6 available channels with a mixture of EDC (0.2 M) and sulfo-NHS (0.05 M) for 5 min. Perform a 5 min injection of 50 µg/mL antibody 560 and a 5-min injection of 1 M ethanolamine-HCl solution.
- Rotate the sensor chip by 90° and inject the cTnI standards at different concentrations (75, 30, 7.5, and 2.5 ng/mL).
- Observe the conjugation to the antibody at spots of interaction on the chip in real time through the SPR readout.
- Regenerate the chip by injecting 50 mM glycine-HCl (pH 2) for 1 min.
The optical setup for taking measurements is shown in Figure 1A. An image of the actual nanohole array is given in Figure 1B. To understand the physics driving the sensing process, the COMSOL simulation software was used to simulate the distribution of the plasmonic field in an aqueous environment. The results from the simulation were then related to the actual measurement. A previously published study contains details of the assumptions made and the parameters used in the simulation11,13. The physical dimensions used for simulating the plasmonic field for the nanohole array was as follows: p = 400 nm, D = 150 nm, and T = 100 nm. Absorption and scattering effects are also taken into account14 when calculating the transmission spectrum. The simulated spectrum is compared to the experimentally measured spectrum in Figure 1C. Both the simulated and the measured spectra convey the existence of four bands from 450 to 850 nm. The band at 495 nm corresponds to the interband transition of gold. The three subsequent bands, henceforth called bands I-III in increasing order of wavelength, are located at 560 nm, 645 nm, and 712 nm, respectively. Bands I-III were observed to have acceptable alignment to the experimentally measured bands, located at 558 nm, 638 nm, and 724 nm. As the fabricated nanoholes are nearly circular in shape, these bands should not be sensitive to polarization of incident light. Additionally, the COMSOL simulation enables the direct visualization of the near-field distribution of these bands as they would occur in a unit cell of the periodic structure (Figure 1D). The unit on the color bar is the optical field distribution (V/m) expressed in a log scale. The highest intensity observed was around 4.7 (50,119 V/m). Compared to the intensity of the incidence used in the simulation (4,340 V/m), this magnitude represents a 11.5-fold field enhancement. The electromagnetic fields for bands I and III were localized on the surface of the glass substrate. In contrast, band II was predominantly localized at the top rim of the nanohole and was chosen for the detection of the bioanalyte. Figure 1E illustrates the transmission spectra of the nanohole array in liquids of known refractive indexes, which varied from 1.31 to 1.39. Three transmission bands, corresponding to bands I, II, and III, were observed in the spectrum range of 400 – 900 nm. A red shift was observed with a change in RI. The magnitude of the shift followed the sequence band II > band I > band III. Figure 1F is a consolidation of the observed red shifts of bands I, II, and III. The bulk sensitivity calculated for band I was 322 nm/RIU, for band II was 345 nm/RIU, and for band II was 202 nm/RIU.
Figure 2A contains the schematic of the sensing phenomenon in action. Figure 2B shows the change in the transmission spectra after the cardiac troponin molecules bind to the functionalized chip surface. At low concentrations, there is a linear shift in the band with the troponin level. The shift in the band position can be fitted well to a binding isotherm with an R2 value of 0.995. Upon closer observation, 30 ng/mL seems to be the concentration at which the isotherm indicates the onset of saturation (Figure 2C).
Figure 3A shows the sensorgram from the interaction of serum with the chip surface of a modified GLC chip in an XPR36 setup. The capture of cTnI is shown by the rise in the signal. Thereafter, the dissociation of cTnI in a PBST medium (1x PBS, 0.05% tween 20) can be observed as the signal decreases from 120 – 660 s. Injecting glycine (the regeneration solution) for 1 min reduced the signal to 0, indicating the regeneration of the sensing surface through the complete disengagement of cTnI. The sensorgram for the subsequent association of cTnI to the regenerated chip surface is shown in the inset of Figure 3A. The same protocol (i.e., immersing in glycine solution for 1 min) was used to regenerate the nanohole array surface. Figure 3B shows that the position of band 2 shifts back to its original position, thereby confirming the success of the regeneration step.
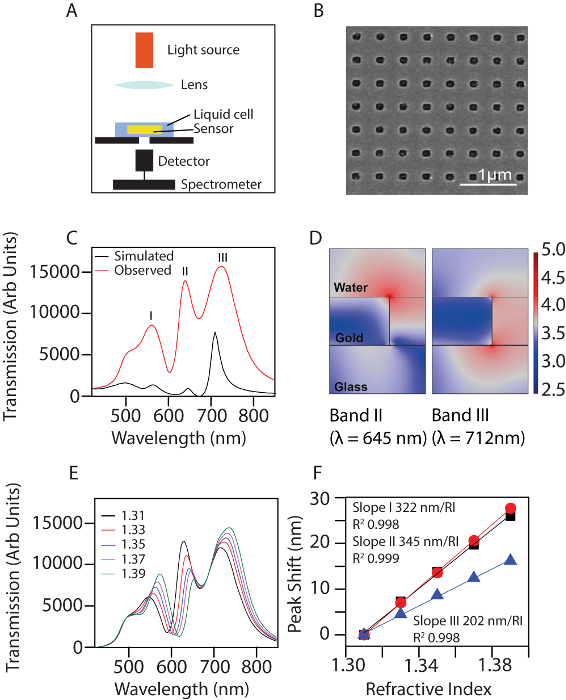
Figure 1: Characterization of the nanohole array. (A) Simplified schematic of the experimental setup. (B) Scanning electron microscope image of the nanohole array. (C) Comparison between the simulated spectrum and the experimentally measured transmission spectrum in an aqueous environment. (D) The near field distribution as simulated in COMSOL for bands I and III, seen in a cross-sectional view. Red represents stronger near-field distribution. The unit shown in the color bar is |E|, the distribution of the optical field, taken in log scale. (E) Experimentally measured transmission spectra of the nanohole array in environments with standard refractive index liquids (1.31 to 1.39). (F) Bulk sensitivities of the three transmission bands (I-III) to changes in RI measured in the visible to NIR range. Black square: band I, red circle: band II, blue triangle: band III. The figure has been modified from Ding et al.14 under a CC BY license. Please click here to view a larger version of this figure.
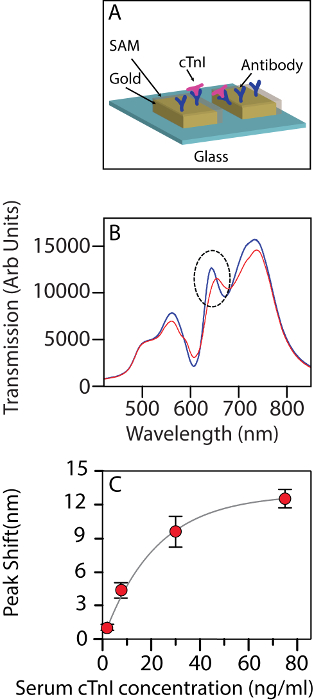
Figure 2: The nanohole array used as a biosensor. (A) Schematic of the nanohole array being used as a biosensor for detecting cTnI. (B) The change in the transmission spectrum of the biosensor upon interacting with human cTnI at a 30 ng/mL concentration in a background of serum. Blue: before interaction, red: after interaction. The dotted circle indicates the band being tracked. (C) The shift in wavelength for band II at different concentrations of troponin (2.5 ng/mL, 7.5 ng/mL, 30 ng/mL, and 75 ng/mL). The error bars show the standard deviation amongst the n = 3 chips used for each measurement. The figure has been modified from Ding et al.14 under a CC BY license. Please click here to view a larger version of this figure.
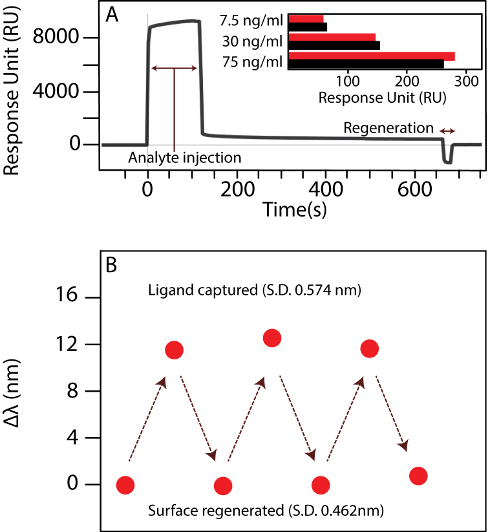
Figure 3: Regeneration of the sensor surface. (A) An SPR sensorgram from XPR36 showing the injection of analyte (cTnI) followed by the injection of glycine to regenerate the sensor surface. Subsequent detection measurements of different concentrations of cTnI against the serum background are shown in the inset. The red bar represents the initial value, while the black bar shows the measurement after the regeneration of the surface with the protocol described in the text. (B) The shift in the band wavelengths observed after regeneration of a nanohole biosensor chip. σ: standard deviation of shifts in the wavelength of the band position. The figure has been modified from Ding et al.14 under a CC BY license. Please click here to view a larger version of this figure.
