结合 SPECT 和 CT 成像,使心脏功能可视化
English
Compartir
Descripción
资料来源:阿莉西亚·伯曼、詹姆斯·沙伯和克雷格·戈尔根,珀杜大学韦尔登生物医学工程学院,西拉斐特,印第安纳州
在这里,我们将演示使用小鼠的单光子发射计算机断层扫描/计算机断层扫描 (SPECT/CT) 成像的基本原理。该技术包括将放射性核素注入鼠标,在动物分布在全身后成像,然后重建生成的图像以创建体积数据集。这可以提供有关解剖学、生理学和新陈代谢的信息,以改善疾病诊断并监测其进展。
在收集的数据方面,SPECT/CT 提供与正电子发射断层扫描 (PET)/CT 类似的信息。然而,这两种技术的基本原理根本不同,因为PET需要检测两个伽马光子,它们以相反的方向发射。相比之下,SPECT成像通过伽马相机直接测量辐射。因此,SPECT 成像的空间分辨率低于 PET。然而,它的成本也较低,因为SPECT放射性同位素更容易获得。SPECT/CT 成像提供非侵入性代谢和解剖信息,可用于各种应用。
Principios
Procedimiento
Resultados
Representative results using a 99mTc-based tracer in a rat are demonstrated in Figure 2. Acquisition of SPECT/CT should display the SPECT data (shown as shades of yellow/orange in the figure) overlaid on CT data (shown as shades of gray). Within the SPECT model, the degree of physiological activity is demonstrated by the intensity of color. Thus, the areas of yellow show greater activity than areas of orange. The SPECT data in the figure was acquired by collecting 30 one-min images. The resulting resolution is 0.8 mm.
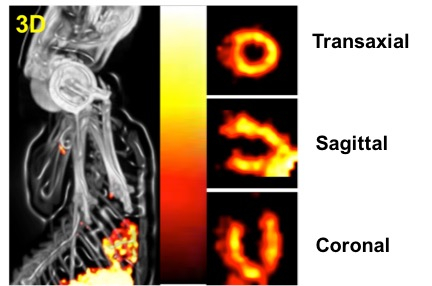
Figure 2: Representative images demonstrating cardiac functionality. The view on the left is the overall SPECT/CT model while the three views on the right show magnified images of the coronal, sagittal, and transaxial planes of the heart. Gray shades are that of the CT and indicate the skeletal structure, while the orange/yellow shades are that of SPECT. Degree of activity is indicated by the intensity of the color with white being greater than black. Images courtesy of Dr. Shuang Liu.
Applications and Summary
SPECT/CT was used to provide anatomical and functional information. The general procedure involved injection of a radionuclide, imaging, and then reconstruction of the data. This procedure, discussed within the context of small animal imaging, is similar to what is performed clinically. However, the use of small animals adds some additional technical nuances that should not be overlooked. Small animal models, as might be surmised, necessitate the use of higher resolution in imaging. In addition, small animals have increased heart rates and respiration rates, which require more rapid imaging. Respiration and heart beat can cause movement of the animal during imaging, which makes it difficult to acquire accurate data. To compensate for these potential issues, cardiac and respiration gating can be implemented. The gating allows the machine to acquire images at specific times relative to the animal's cardiac and respiration cycles. For example, imaging occurs in between the animal's breaths and at a specific part of its cardiac cycle. These modifications enable improved imaging of small animal models.
The general procedure for SPECT/CT imaging of small animal model was demonstrated. The resulting data show areas of increased metabolism within the context of anatomy, thus enabling better diagnosis and disease characterization.
SPECT/CT imaging is a widely applicable technique, spanning a variety of areas including cardiology, oncology, and inflammation. In the realm of cardiology, myocardial perfusion studies employ SPECT/CT to diagnose blockages of coronary arteries by demonstrating how well blood flows through the heart muscle. Patients undergoing a myocardial perfusion study will exercise to induce cardiac stress. The patient will then be injected with a radioactive tracer that mixes with the blood moves throughout the body. If the blood is unable to reach a certain area of the heart due to a blockage in a coronary artery, then neither will the tracer. SPECT/CT images will be taken after exercise, and then later, after the patient has rested. During SPECT/CT imaging, areas that blood cannot reach will show up as dark, indicating potential coronary blockages or infarction.
In other applications, such as in oncology and in inflammation, the radioactive tracer can be chosen to selectively target a biological molecule. In the case of oncology, the radioactive tracer targets a specific cell-surface receptor that is found in tumors. Then, uptake of the radioactive tracer during SPECT/CT imaging is suggestive of the presence of a tumor. Finally, in the case of inflammation, the radioactive tracer can target the infection or inflammation while also providing precise anatomical location. This is valuable when diagnosing the extent of osteomyelitis, which is an infection of the bone. In summary, SPECT/CT is a versatile imaging approach that combines two techniques to noninvasively provide anatomical and functional information.
Transcripción
Combined SPECT-CT scan can be used to simultaneously provide anatomical and functional information about a particular organ of interest.
Single photon emission computed tomography, or SPECT imaging, directly measures the radiation from an intravenously injected radioactive species via a gamma camera. This enables noninvasive imaging of biological activity rather than just a snapshot of the organ.
When combined with computed tomography or CT, SPECT-CT imaging provides both metabolic data and anatomical information that can be useful for a wide variety of applications.
This video will illustrate the basic principles of combined SPECT-CT imaging and provide a brief overview of how SPECT-CT images are acquired, reconstructed, and analyzed.
SPECT-CT imaging utilizes two separate imaging modalities, SPECT and CT, to combine both functional assessment and anatomical information to improve the overall diagnostic ability.
In CT, multiple 2D X-ray images are collected to create a 3D model of the patient’s or animal’s anatomy. During CT imaging, X-rays are emitted from a source. As X-rays move through the patient, some of the X-rays are absorbed, and the remaining pass through the patient. In general, higher density materials, like bone, absorb more X-rays than lower density materials like soft tissue.
The remaining, non-absorbed X-rays are collected by a detector placed on the other side of the patient that determines the intensity of the non-absorbed X-rays in Hounsfield Units. This produces a 2D image called a slice. The X-ray source and detector are then rotated around the patient to acquire a collection of 2D slices. The slices are then reconstructed to create a 3D model.
Analogous to CT imaging, SPECT is a nuclear imaging technique that acquires emission of radiation from a radioactive tracer that is injected into the patient. The injected tracer decays over time, emitting gamma rays which is imaged by a gamma camera to create a 2D image. Similar to CT, the gamma camera collects 2D images at various locations to generate a slice, which can be reconstructed into a 3D model.
In this study, we show the SPECT-CT imaging of a mouse. The reconstructed mouse CT and SPECT images are overlaid to create an image that displays both anatomical and functional assessments, as shown by the colored SPECTRACE and the grayscale CT scan.
Now that we have reviewed the basic principles of SPECT-CT imaging, let us now look at the protocol.
First, open the system software. Then, set up the CT portion of the scan to allow the X-ray tube to warm up by selecting the option on the software. The system will begin heating up the tube.
Place the mouse in an anesthesia induction chamber and anesthetize the animal using isoflurane. Then, transfer the mouse to a bench top equipped with a nose cone. Next, verify that the mouse is unconscious using the toe-pinch technique. Then inject the anesthetized mouse with the radionuclide technetium-99m. Wait until the radionuclide is distributed in the blood stream and starts decaying. Scans can be started almost immediately for cardiology applications, whereas the wait time to image tumors may be several hours to days.
Next, place the mouse on the SPECT-CT stage bed that is equipped with ECG and respiration monitoring sensors. Secure the nose cone and start the flow of the anesthetic. Turn on the mouse bed heater and monitor the mouse’s physiological parameters using the sensors and the device’s internal camera.
Next, slide the mouse bed inside the collimator. Then, acquire a single axial image of the mouse as a reference to determine animal placement as it resides during SPECT scanning. Using this as a reference image, set a region of interest for a pilot SPECT scan. This pilot scan will help the user define the settings for the experimental SPECT scan including the number of images collected, the time per image, the scan mode or detector rotation path, and the step mode for improved image accuracy or increased imaging speed.
Next, define the parameters for the CT scan such as the tube current and voltage, the angle of rotation, the speed of the scan, and the number of images taken at each rotation angle. Finally, begin data acquisition by pressing the start acquisition button. The duration of the scan depends on scan parameters but is typically 30 to 60 minutes in length.
Once the scan is complete, remove the bed from the collimator and remove the mouse from the bed. Monitor the mouse until it is conscious and can move around normally. The SPECT and CT images gathered can now be individually reconstructed and later combined using built-in software.
Let us now review the results of the SPECT-CT imaging.
This figure shows a representative combined SPECT-CT scan obtained using a technetium-99m base tracer in a mouse. The combined SPECT-CT scan displays the SPECT data in shades of yellow to orange in the figure overlaid on the CT data displayed in shades of gray.
Within the SPECT data, the degree of physiological activity is demonstrated by the intensity of color. Thus, the areas of yellow show greater activity then the areas of orange.
Now let us look at how nuclear medicine techniques are used to obtain more precise imaging data for improved medical diagnostics.
In cancer screening, a radioactive tracer is used to selectively target a specific cell surface receptor found in tumors. Uptake of the radioactive tracer in a SPECT-CT image indicates the presence of a tumor.
Integrated PET-MRI is another hybrid imaging technique used to diagnose disease and monitor treatment because it provides both high contrast of soft tissues and metabolic information. Regions of high contrast indicate uptake of the radiolabeled tracer and can suggest metastasis in cancer screening. These merged PET and MRI images show multiple hypermetabolic pulmonary metastases and a metastasis in the right ventricular outflow tract of the heart.
To measure the efficacy of new treatment strategies for myocardial infarction, the assessment of the acute stage as well as long-term outcome is required. Intravenous contrast agents are delivered for the sequential PET-MRI imaging of the mouse heart. The MRI procedure typically takes 30 minutes, and the PET scan lasts for 45 minutes. This is significant in evaluating novel therapeutics because the time course may not be known. The enhanced areas on the MRI represent nonviable tissue and correspond to areas of reduced FDG uptake which suggest potential coronary blockages or infarction.
You’ve just watched JoVE’s Introduction to Combined Single Photon Emission Computed Tomography and Computed Tomography Imaging. You should now know how to set up SPECT and CT parameters, perform the combined scan and analyze the image. You should also know how nuclear imaging is used in biomedical applications. Thanks for watching!