Ultrasound is a commonly used noninvasive imaging technology in clinical imaging and diagnostics.
Ultrasound emits sound waves and measures their reflection to generate live images of anatomical structures and organs. It has advantages over other imaging modalities such as CT, MRI, and NIRF scans because it is relatively inexpensive, portable, and versatile and does not require contrast agents. However, it has limitations in resolution and penetration depth.
This video will illustrate the key principles behind ultrasound technology, demonstrate the utility of a high-frequency ultrasound system for imaging blood vessels in rodents, and provide examples of ultrasound imaging applications.
Ultrasound images are produced by emitting a beam of acoustic waves from the transducer and recording the echoes created as the waves reflect at the boundary between dissimilar tissues in the body. The waves can also be refracted, absorbed, or even scattered by smaller objects like blood cells.
The quantity of reflected waves is proportional to the difference in acoustic impedance between tissues. Acoustic impedance, Z, depends on the tissue density and the speed of the sound wave. If the difference is high, such as with bone, then the sound waves are completely reflected. If the difference is lower, as with an organ, then the sound waves are only partly reflected.
The intensity of the reflected waves received at the transducer along with the distance from the transducer to the tissue boundary is used to create an anatomical image. These distances are determined using the average propagation speed for sound through body tissue, which is approximately 1540 meters per second, and the time it takes for the wave to propagate to the tissue and back.
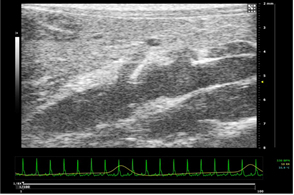
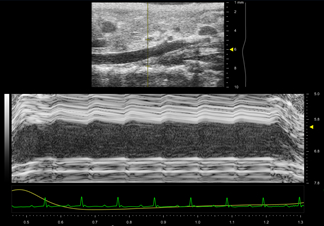
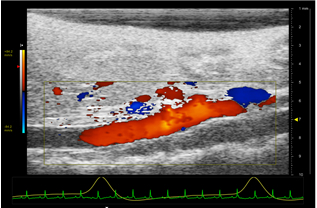
Ultrasound can be used to gather different types of images by utilizing special modes that cater to unique applications. The most common mode is brightness or B-mode, which displays the acoustic impedance of a two-dimensional slice of tissue. Alternatively, motion or M-mode imaging provides a look at the rapid movement in tissue like with cardiac function. Finally, Doppler mode is used to evaluate blood flow.
Now that we’ve discussed how ultrasound works let’s take a look at how to capture images using the different ultrasound imaging modes with a small animal.
First, turn the ultrasound system on using the switch on the back. Then, turn on the monitor and computer using the switch on the left side of the system. Next, plug the transducer into the dedicated active port of the system. Then, run the transducer cable through the plastic holders above the probe mount.
Note the raised line on one side of the transducer. Use this as a point of reference when referring to the image displayed on the monitor. Above the grayscale bar for the image is a small circle representing the image subject and a vertical line representing the raised line on the transducer. To begin, the transducer should be secured into the clamp and placed at 90 degrees to the animal.
Ensure the physiological monitoring unit is plugged in and press the heart rate and temperature buttons to turn these monitors on. Next, turn on the gel warmer and ensure its indicator light is on.
For animal anesthetization, first check the isoflurane level in the vaporizer and refill if the level is below the empty line. Next, turn on the oxygen tank and adjust the airflow on the flowmeter to approximately one liter per minute.
Now, attach the animal stage and plug in the VGA cord to collect ECG and respiration signals. Secure the animal nose cone into place and check that the black isoflurane tube and blue waste gas tube are properly connected to the nose cone. The animal can now be anesthetized and prepared for imaging. Turn the vaporizer dial to two to three percent once the animal is in a secured anesthesia chamber.
Once the animal appears deeply anesthetized, move it to the nose cone on the stage, making sure to switch the flow of isoflurane. Perform a toe pinch to confirm that the animal does not immediately wake up, then apply ophthalmic ointment to the eyes. Next, secure the paws to the stage electrodes using adhesive and remove the abdominal hair using a depilatory cream. Apply lubricant to the rectal probe and insert it in the rectum of the animal for body temperature measurements. The abdomen is then covered with warmed ultrasonic transducing gel.
To begin, open the software and select “New Study”. Once in a new series, select a user from the menu and name your series appropriately. Once your series has been created, select B-mode, which stands for brightness mode, from the keyboard. All imaging modality keys are on the bottom row of the black keyboard.
You are now ready to start imaging. Roll the transducer down the abdomen of the animal. Watch the screen to monitor the respiratory rate. A drop in the rate will be observed if the transducer is applying too much pressure on the animal. Gently turn the X and Y axis knobs on the stage to adjust the placement of the transducer. Do so until a clear image of the abdominal aorta is found. Once the desired images on the screen, wait for the white bar at the bottom of the image to fill before pressing the image label button to save the image. The modality will be automatically saved with the image label and does not need to be included in the saved name.
To capture M-mode or motion mode images, select M-mode using the keyboard. Adjust SV gait to narrow or widen the yellow bars and the cursor to align the bars over a section of the abdominal aorta. Once placed correctly, push M-mode again. The placement of the bars may be adjusted while in M-mode. As with B-mode, wait for the white bar at the bottom of the image to fill before pressing the image label button.
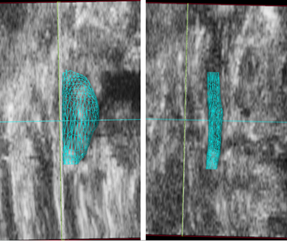
To perform EKV or ECG-gated kilohertz visualization imaging, first select B-mode on the keyboard, position the transducer over a section of the abdominal aorta and ensure that there is a clean ECG signal. Then press EKV, choose the desired acquisition type, line density, and frame rate and start the scan. After acquisition, the image data will be displayed.
To use color Doppler, first select B-mode, check that the transducer is over the abdominal aorta, and select Color. Press Update, move the trackball to adjust the box size to the area to be scanned, and press Update again to lock the size. Next, use the cursor to move the box. Turn the velocity knob up to increase the velocity threshold and decrease the background signal.
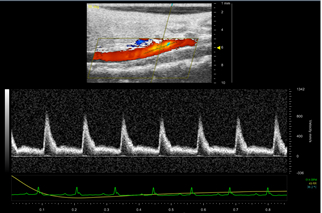
To quantify blood flow velocity, pulsed wave Doppler mode is used. Start in color Doppler mode and then press PW. Two yellow angled lines will appear on the screen. Adjust the beam angle and turn the PW angle knob to bring the shorter dotted line parallel to the anterior and posterior vessel wall. The dotted yellow line will turn blue if the angle is turned too far. Once there is alignment, press PW and then adjust the baseline, velocity, and Doppler game controls to center and brighten the waveforms. You may view the previously acquired images at any time during imaging by pressing study management and selecting the desired images.
After acquiring all the images needed for a series, select Close Series from the study management screen. To transfer data for further analysis on a different computer, go to the study management screen and click the check boxes for the studies or individual series. Click Copy To and select the desired file location and press OK. Finally, turn the vaporizer dial to zero, remove the animal from the stage, and allow it to recover from anesthesia.
After each procedure, clean the ultrasound set-up, and wipe off the animal stage and rectal probe. Never spray the disinfectant directly on the stage. The transducer should be wiped off with 70% ethanol on a paper towel before being placed back in the holder. Remember to turn off the oxygen tank and let the airflow reduce to zero on the flowmeter.
Once all of the imaging and export is complete clicok the power button on the study management screen and wait for the monitor and computer to shut down. After the monitor is completely off, switch the on-off button on the back of the system to “off”. You should hear the fans stop once it has been properly shut down.
After the imaging session is complete and the system has been shut down, the results can be analyzed.
With this procedure, anatomical and functional imaging of the abdominal aorta was performed. Some data such as B mode scans, are readily analyzed during or immediately after data collection, while scans in other modes are best analyzed after the data is copied for analysis with the software.
The two-dimensional B-mode scans can provide aortic diameter or cross-sectional area measurements. Diameter can be measured using the length over distance measurement tool, and area using the area measurement tool. M-mode can be used to determine circumferential cyclic strain on the vessel. Looking at an M-mode scan of the aorta, a user can see where the bright lines are corresponding to the anterior and posterior vessel wall. The anterior wall exhibits more motion than the posterior wall.
Circumferential cyclic strain is determined from the inner aortic diameter values during peak systole, DS, and end diastole, DD. Peak systole occurs when the aorta is extended to its largest size, and end diastole when it is at its smallest size. Circumferential cyclic strain is therefore calculated using this formula.
Color Doppler can be used to determine the blood flow direction and velocity. Color Doppler images provide the user a qualitative assessment of blood dynamics. The red and blue color scale indicates the direction and magnitude of the velocity of detected blood flow. Red indicates flow toward the transducer and blue flow away. The darker color represents low velocity flow and the lighter color higher velocity flow.
Now that the general principles and procedure for ultrasound imaging have been reviewed, let’s take a look at some applications where this imaging modality is used.
The human placenta is highly inaccessible for research while still in utero. High-frequency ultrasound can be used to visualize the umbilical vein and uterine artery. This is performed to measure the vessel diameter and the maximum velocity of blood flow on both sides of the placenta. This is combined with data from blood samples collected from the maternal and fetal sides of the placenta to calculate the arteriovenous concentrations of nutrients and substances released to circulation. This study provides insight into human placental function.
Cranial ultrasound is a reliable tool for neonates with congenital anomalies or brain lesions. The method is noninvasive and can be done at the bedside in the neonatal intensive care units. Ultrasound images are collected in both the coronal and sagittal planes to aid in the visualization of the neonatal brain. These images can help visualize any lesions present in the brain. Color Doppler mode is usually used for visualization of the intracerebral vessels. The transverse sinuses are imaged and any clots can be detected.
You’ve just watched JoVE’s Introduction to Ultrasound Imaging. You should now understand the principles of ultrasound imaging, the general methods for image collection and analysis, and several applications. Thanks for watching!