JoVE Educación científica
Materials Engineering
Se requiere una suscripción a JoVE para ver este contenido.  Inicie sesión o comience su prueba gratuita.
JoVE Educación científica Materials Engineering
Thermal Diffusivity and the Laser Flash Method
  • 00:07Descripción
  • 01:35Principles of the Laser Flash Method
  • 03:35Laser Flash Measurement
  • 07:31Analysis of the Data
  • 08:41Applications
  • 10:01Summary

Diffusivité thermique et méthode du flash laser

English

Compartir

Descripción

Source : Elise S.D. Buki, Danielle N. Beatty, et Taylor D. Sparks, Department of Materials Science and Engineering, The University of Utah, Salt Lake City, UT

La méthode laser flash (LFA) est une technique utilisée pour mesurer la diffusion thermique, une propriété spécifique au matériau. La diffusion thermique est le rapport entre la quantité de chaleur et la quantité de chaleur stockée dans un matériau. Il est lié àEquation 1la conductivité thermique ( ), combien de chaleur est transférée à travers un matériau en raison d’un gradient de température, par la relation suivante:

Equation 2(Équation 1)

où est la densité du matériau et Cp est la capacité thermique spécifique du matériau à la température d’intérêt donnée. La diffusion thermique et la conductivité thermique sont des propriétés matérielles importantes utilisées pour évaluer comment les matériaux transfèrent la chaleur (énergie thermique) et réagissent aux changements de température. Les mesures thermiques de diffusion sont obtenues le plus souvent par la méthode thermique ou laser flash. Dans cette technique, un échantillon est chauffé en le pulsant avec un flash laser ou xénon d’un côté mais pas de l’autre, induisant ainsi un gradient de température. Ce gradient de température entraîne la propagation de la chaleur à travers l’échantillon vers le côté opposé, chauffant l’échantillon au fur et à mesure. De l’autre côté, un détecteur infrarouge lit et signale le changement de température par rapport au temps sous la forme d’un thermogramme. Une estimation de la diffusion thermique est obtenue après que ces résultats sont comparés et adaptés aux prédictions théoriques en utilisant un modèle de moindre carré.

La méthode flash laser est la seule méthode qui est soutenue par plusieurs normes (ASTM, BS, JIS R) et est la méthode la plus largement utilisée pour déterminer la diffusion thermique.

Principios

Procedimiento

Allumez la machine et attendez la fin du processus d’échauffement (environ 2 heures). Remplissez le compartiment détecteur d’azote liquide à l’aide d’un petit entonnoir jusqu’à ce que la vapeur d’azote puisse être vue provenant du détecteur. Laissez le liquide se déposer jusqu’à ce qu’il n’y ait plus de vapeur sortant et fermez le détecteur. Mesurez l’épaisseur de votre échantillon à l’utilisation d’un micromètre sur plusieurs taches et calculez l’épaisseur moyenne et l’écart type. Les bords de l’écha…

Resultados

Figures 1, 2, and 3 show the data from an LFA run of an iron standard sample. Figures 1 and 2 show laser pulse vs time plots for two temperatures (48.2°C and 600°C); the blue trace shows the collected laser pulse from the iron sample and the thin red line shows the calculated pulse from the Cowan model. Both temperature pulses fit well to the model because this is a well-defined standard material. Generally, experimentally calculated values match the Cowan model best at high temperatures, as shown by the greater deviation from the model trace for the laser pulses at low temperatures (Figure 1) vs high temperatures (Figure 2). Low temperatures fit relatively well to the model for this standard material but deviate more than high temperature results because the lower set temperatures may not be reached in the time allowed for equilibration between each pulse. Each data point (red circle) in Figure 2 represents one laser pulse; the closer the data points fit the Cowan model, the better and more accurate the resulting thermal diffusivity values.

Figure 2
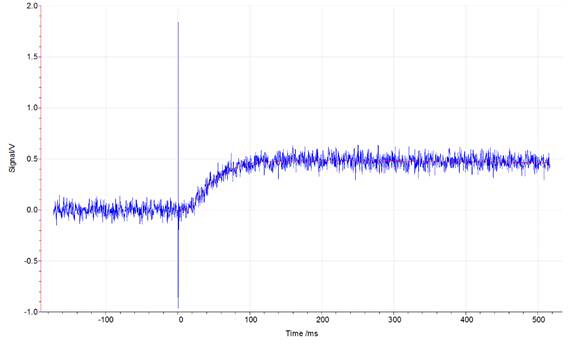
Figure 1: Laser signal vs time plot at 48.2 °C for an iron standard run in the LFA 457. The blue trace represents the signal from the laser hitting the sample. The thin red line represents the calculated pulse for the Cowan model.

Figure 3
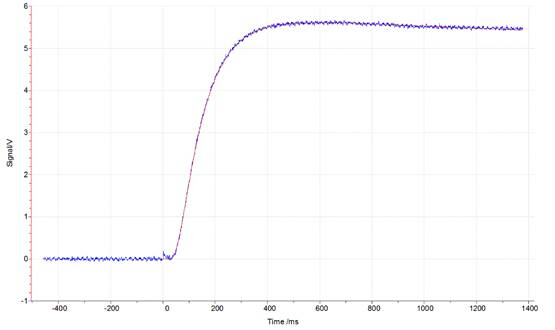
Figure 2: Laser signal vs time plot at 600.6 °C for an iron standard run in the LFA 457. The blue trace represents the signal from the laser hitting the sample. The thin red line represents the calculated pulse for the Cowan model.

Figure 4
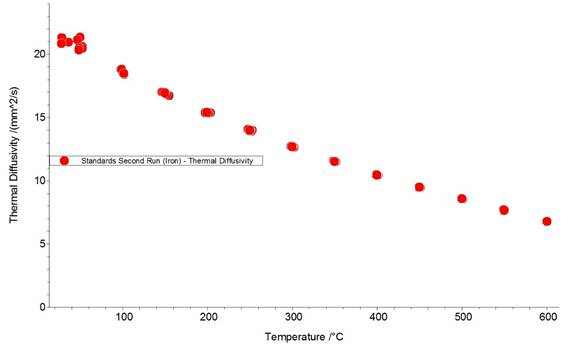
Figure 3: Thermal diffusivity (α) vs temperature plot for an iron standard disk, run in the LFA 457. Each red circle represents one laser pulse.

Applications and Summary

The laser flash method is a widely used technique for determination of thermal diffusivity which consists of radiating one side of a sample with thermal energy (from a laser source) and placing an IR detector on the other side to pick up the pulse. The wide range in temperature of different models enables measurement on various types of samples. The LFA requires relatively small samples. Other tools that measure thermal conductivity directly, rather than thermal diffusivity, include the Guarded Hot Plate, Heat Flow Meter and others. The Guarded Hot Plate system can hold relatively large square samples (300mm x 300mm) and requires careful calibration in order to calculate thermal flux necessary for thermal conductivity calculation. Neither of these tools can measure thermal diffusivity to high temperatures and typically operate below 250oC.

Thermal diffusivity is an important property that needs to be known when choosing the appropriate material for any applications involving heat flow or that are sensitive to heat fluctuations. For example, thermal conductivity, aong with diffusivity, also play an important role in insulation. When selecting a material to use for insulation, it is important to be able to measure and compare the thermal properties of different materials. These thermal properties are even more critical in aerospace. Thermal protection tiles play an important role in a spacecraft's successful atmospheric re-entry. When entering the atmosphere, a spacecraft is exposed to extremely high temperatures and would melt, oxidize, or burn without a protective layer. Thermal protection tiles are typically made of pure silica glass fibers with tiny air-filled pores. These two components have low thermal conductivity and therefore minimize heat flux across the tiles. The thermal conductivity of materials with a high porosity (Equation 3) can be calculated with the following Maxwell's relation :
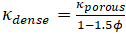
 Equation 4   (Equation 2)

Transcripción

Thermal diffusivity is an important property used to assess how a material transfers heat and reacts to changes in temperature. Thermal diffusivity, alpha, is the ratio of how much heat is conducted in a material relative to how much heat is stored. Similarly thermal conductivity, kappa, describes how much heat is transferred through a material due to a temperature gradient. Thermal diffusivity and thermal conductivity are related by the following equation where Roe is density and Cp is the specific heat capacity of the material. A material with a high thermal diffusivity, like a metal, is able to conduct thermal energy rapidly while a material with low thermal diffusivity, like plastic, is much slower. A material’s thermal diffusivity is often measured using laser flash analysis or LFA. In this technique a sample is heated on one side by pulsing it with a laser inducing a temperature gradient which is then measured with respect to time. This video will introduce basics of how the laser flash method is used to measure thermal diffusivity. And then we’ll demonstrate the technique in the laboratory using a standard sample.

First the laser flash method requires a sample with flat and parallel top and bottom surfaces and usually takes the shape of a thin disk. While a solid disk sample is the most straightforward sample the technique can be used on a powder, liquid, or even layered or porous samples. Once the sample is prepared it is suspended inside of a sealed furnace with a controlled atmosphere. A laser with power around 15 joules per pulse provides an instantaneous energy pulse to the bottom face of the sample. An infrared detector above the top face of the sample registers the change in temperature with time after each laser pulse. Between each pulse the sample is allowed to equilibrate. Laser pulses and the resulting temperature change data are recorded for set temperature measurement points.

The resulting data, called a thermogram, is a plot of the temperature change or measured signal with respect to time. An estimate of the thermal diffusivity is obtained after fitting to theoretical predictions using heat transport models which are usually incorporated into the system software. The most common model used is the Parks Ideal Model. This model involves solving a differential equation with boundary conditions that assume constant temperatures and that no heat escapes from the system during measurement. Both of these assumptions are false for nonideal measurements so this model is corrected using the Cowan Model which takes heat loss into consideration. Now that we’ve introduced the laser flash method let’s take a look at how to run the measurement using a standard iron sample.

To begin turn on the laser flash instrument and allow it to warm up for about two hours. After the instrument has warmed up fill the detector compartment with liquid nitrogen using a small funnel. Let the liquid settle until there is no more vapor coming out. Then close the compartment. Now obtain your sample. Here we are using an iron standard disk. Measure the dimensions of the sample with calipers. It should be between six and 25.4 millimeters wide. The thickness should be uniform and between one and four millimeters. Calculate the average thickness of the sample as well as the standard deviation. To ensure uniform heating of the sample spray a thin coating of colloidal graphite on the surface. Repeat three times allowing the sample to dry between sprays then flip the sample over and spray the other side the same way.

Once dry place the sample in the bottom half of the small sample support, then cover it with the top half of the support. Open the furnace by simultaneously pressing the safety button on the right side of the machine and the button on the front side labeled furnace. Rotate the detector clockwise in order to have more mobility around the furnace. The sample stage within the furnace has three locations designed to hold the samples. Put the sample support containing the sample in one of the three locations taking note of which one it is. Then realign the detector and close the furnace by pressing the safety button simultaneously with the furnace button. Now evacuate the chamber before purging it with inert gas. First make sure that the vent valve is closed. Then turn on the vacuum pump and slowly open the vacuum valve to evacuate the chamber until the pressure indicator is stabilized. Next open the regulator on the Argon cylinder and set the pressure between five and 10 PSI. Then close the vacuum valve and open the backfill valve to fill the compartment with argon.

Close the backfill valve then slowly open the vacuum valve to evacuate the chamber again and allow the pressure to stabilize. Then close the vacuum valve and open the backfill valve again to refill with argon. Then close the backfill valve once again after the pressure stabilizes. Do this several more times to make sure that there is no air left in the chamber. This is to eliminate the chance of oxygen or nitrogen reacting with the compounds present on the surface of the sample at high temperature. Then turn on the purge and open the vent valve before turning on the controller. Now the furnace should be left with a very slight positive pressure from the purge gas in order to ensure that air does not flow into the furnace. Then launch the machine’s software. The sample will be heated from 25 to 600 degree Celsius then will cool back to 25 degrees. Three pulses will be made at each temperature with measurements made every 50 degrees. Now adjust the purge flow rate on the flow gauge until the flow stabilizes, then launch the experiment. Periodically check the liquid nitrogen level in the detector and refill it as needed. Once the test is finished remove the sample from the furnace and sample holder.

Now let’s take a look at the data. First we see two plots of measured signal versus time for a laser pulse on our iron standard sample. The one on the left is the response to a laser pulse at 48.2 degrees and the one on the right is the response to a laser pulse at 600 degrees. The blue trace shows the collected temperature data from the sample and the thin red line shows the calculated data from the Cowan Model. Both sets of data fit well to the model because it is a well-defined standard material. Generally experimentally calculated values match the Cowan Model best at high temperatures as shown by the greater deviation from the model trace for the laser pulses at low temperature versus high temperature. If we take a look at the calculated thermal diffusivity as compared to the temperature where each dot represents one laser pulse we can see that there is more noise at lower temperature but a better fit at higher temperature as expected.

It is essential to understand the thermal properties of a material when selecting an appropriate material for any application involving heat flow or temperature fluctuations. When looking at spacecraft for example, thermal protection tiles play an important role in successful atmospheric reentry. When entering the atmosphere a spacecraft is exposed to high temperatures and would melt, oxidize, or burn without a protective layer. Thermal tiles are typically made of pure silica glass fibers with tiny air-filled pores. These two components have low thermal conductivity and therefore minimize heat flux across the tiles. As electronic components are miniaturized the issue of heat dissipation in integrated circuits has become a key problem. Heating is generally caused by joule heating where the passage of electric current through a material produces heat like in the coils of this electric heater. These circuit components can generate hot spots thus materials must be selected that are able to dissipate heat and is why copper and silver have been traditionally selected. You have just watched JoVE’s,

Introduction to Study in Thermal Diffusivity Via the Laser Flash Method. You should now understand why analyzing thermal diffusivity is essential to a wide range of engineering applications and how to measure the thermal diffusivity of a sample using the laser flash method. Thanks for watching.

Tags

Cite This
JoVE Science Education Database. JoVE Science Education. Thermal Diffusivity and the Laser Flash Method. JoVE, Cambridge, MA, (2023).