1. Seeding of HeLa Cells
- Prepare 2 mL of 5 μg/mL fibronectin solution in phosphate buffered saline (PBS) and add 450 μL of it into each well of a 4 well chambered coverslip (#1.5). Incubate the slide for 15 min at 37 °C and 5% CO2.
- Rinse asynchronously growing HeLa cells with Dulbecco’s Phosphate Buffered Saline (DPBS) and incubate with trypsin-EDTA (0.05%: 0.02%; w:v) for 5 min at 37 °C. Stop the enzymatic reaction by the addition of Roswell Park Memorial Institute (RPMI) 1640 medium supplemented with 10% heat-inactivated fetal calf serum (FCS) at 3:1 (v:v) ratio of added trypsin-EDTA.
NOTE: HeLa cells were maintained in RPMI 1640 medium supplemented with 10% heat-inactivated FCS at 37 °C and 5% CO2 and were routinely passaged once they reached 80–90% confluency as described above. - Determine the cell concentration using a Neubauer chamber. Mix a 50 μL aliquot of the cell suspension with trypan blue at 1:1 (v:v) ratio, resuspend, and transfer 10 μL of the suspension into the chamber. Count only the trypan blue-negative cells inside of the four large squares (for details see Phelan et al.47). Derive the cell concentration from the counted cell number using the following formula:

- Pellet the cells by centrifugation at 300 x g for 2 min. Resuspend with fresh RPMI 1640 in order to obtain 1 x 10⁶ cells/mL.
- Remove the fibronectin from the chambered coverslip, wash the wells twice with DPBS, and seed 50,000 cells per well.
- Return the chambered coverslip with the cells to the incubator and grow them for 24 h at 37 °C and 5% CO2.
2. Expression of pEB3-tdTomato in HeLa Cells
- Prepare a 1.5 mL microcentrifuge tube. For each tube, dilute 2 μg of pEB3-tdTomato48 with transfection buffer (synthetic product in aqueous solution) to a final volume of 396 μL.
- Add 4 μL of transfection reagent (non-lipidic, containing polyethylenimine) to the first tube, and vortex the mixture immediately for exactly 10 s.
- Briefly spin down the tube with a microcentrifuge and incubate at room temperature (RT) for 10 min.
- Remove the HeLa cells from the incubator. Dropwise, add 100 μL of the transfection mixture to each well of a 4 well chambered coverslip, and return the cells to the incubator.
- After 4 h of incubation at 37 °C and 5% CO2, supplement the cells with fresh growth medium and incubate for at least 24 h at 37 °C and 5% CO2.
NOTE: It is necessary to optimize transfection conditions for each cell type. The expression levels need to be low enough to allow the identification of single MT growing ends. Alternatively, a cell line stably expressing EB3-tdTomato can be used in the experiments; this would reduce variability in expression levels of EB3-tdTomato between preparations and between cells from the same preparation49.
3. Synchronization and Live-cell Imaging of pEB3-tdTomato–expressing HeLa Cells
- Prepare a 2.5 μM solution of dimethylenastron (DME) in phenol-red free Dulbecco's Modified Eagle Medium (DMEM) supplemented with 10% FCS and 2 mM L-glutamine or an alternative glutamine supply.
- Replace the growth medium in the chambered coverslip with 500 μL of the growth medium containing 2.5 μM DME and incubate the cells at 37 °C and 5% CO2.
- After 3.5 h of incubation with DME, transfer the cells to the microscope, mount the chambered coverslip into an environmental chamber with dark panels for imaging at 37 °C and 5% CO2, and further incubate until the total incubation time is 4 h.
NOTE: The maintenance of temperature at 37 °C without fluctuation is crucial for the experiment. - Perform the time-lapse imaging on an inverted microscope equipped with a 100x 1.49 N.A. oil immersion objective, a dual spinning disk confocal system, and a reliable autofocus system for continuous maintenance of the focal plane. Define the imaging parameters as follows.
NOTE: We use an Electron Multiplying Charge-Coupled Device camera (EM-CCD).- For EB3-tdTomato excitation, use a 561 nm laser line with 200 ms exposure time. Collect the emitted light through a quadruple bandpass (405, 488, 561, 640 nm) dichroic mirror and a 600/52 nm emission filter.
NOTE: Laser power can be adjusted for each imaged cell to prevent image saturation. In all time-lapse movies given here the laser power was set to 5.3 mW. - Find a cell in prophase and focus in the Z-plane corresponding to the center of the monopolar mitotic spindle. Acquire images every 0.5 s over a total of 1 min with no binning and no illumination between the exposures.
- For EB3-tdTomato excitation, use a 561 nm laser line with 200 ms exposure time. Collect the emitted light through a quadruple bandpass (405, 488, 561, 640 nm) dichroic mirror and a 600/52 nm emission filter.
4. Analysis of the MT Dynamics Using U-Track v2.2.0
- To analyze the MT dynamics a numerical computing environment software is required (e.g., MATLAB).
NOTE: Basic understanding of the software is sufficient for the analysis. Comprehensive help material and tutorials are available on the developer’s website (https://uk.mathworks.com/products/matlab/getting-started.html). - Download (https://github.com/DanuserLab/u-track) and install the open-source U-Track v2.2.0 software following the detailed instructions given in the "Readme_u-track.pdf" file50,51,52.
- Launch the numerical-analysis software and add U-Track v2.2.0 folder with subfolders into the software search path.
- From the command window call "movieSelectorGUI". This opens a dialogue window from which the raw files generated by the image acquisition software at the microscope can be imported (Supplementary Figure 1, Figure 2, Figure 3, Figure 4).
NOTE: The U-Track software is compatible with other image data formats. It uses Bio-Formats, which recognizes different life science data formats53. - The size of each image is read from the metadata automatically. Manually enter the numerical aperture of the objective (in this case 1.49) and the time interval (0.5 s) used for imaging (Supplementary Figure 1B). Additionally, information on the excitation wavelength, the fluorophore, and the exposure time can also be provided, but they are not critical for further analysis.
- Once all the images are loaded, save the entered time-lapse series as a movie list by selecting the "Save As Movie List". On the right side of the dialogue window select the "U-Track" option and press "Continuer" (Supplementary Figure 1C).
NOTE: The values are optimized for HeLa cells. If switching to a different cell line, the values should be defined again. Alternatively, use the settings recommended by the software developers. The detailed explanation of each of the parameters and how they should be defined can be found in the technical report provided with the previous version of the software, plusTipTracker50. - From the pop-up window select "Microtubule Plus-Ends" and press "Ok" (Supplementary Figure 1C). The new dialogue window allows determining the parameters for the three steps of the analysis (Supplementary Figure 1D), which are detection, tracking, and track analysis.
- In step 1 choose "Settings" and from a drop-down menu select "Comet Detection" as a detection method (Supplementary Figure 2B).
- From the new dialogue window define the parameters for the difference of Gaussians filter and the watershed segmentation as follows (Supplementary Figure 2C): Mask process to be used for the detection = None; Low-pass Gaussian standard deviation = 1 pixel; High-pass Gaussian standard deviation = 3 pixels; Minimum threshold = 3 standard deviations; Threshold step size = 0.25 standard deviations. Select "Apply Settings to All Movies" and "Apply".
- In step 2, the parameters for linking, gap closing, merging and splitting, and Kalman filter functions are defined in three steps as highlighted in pink, green, and blue, accordingly (Supplementary Figure 3B). For these steps, select the "Microtubule Plus-end Dynamics" and from the "Setting" option define the values as indicated in Supplementary Figure 3C–E, respectively.
- For problems with dimensionality, choose "2" from the drop-down menu. Use Maximum Gap to Close = 5 frames; Minimum Length of Track Segments from First Step = 3 frames. As before, select "Apply Settings to All Movies" and click on "Apply".
- In step 3 of the analysis, the detected MT tracks are classified (Supplementary Figure 4). As a track analysis method, choose "Microtubule Dynamics Classification" and define the parameters through the "Setting" button as indicated in Supplementary Figure 4B,C. After that, choose the "Apply Settings to All Movies" box and click on "Apply".
- Once all the parameters are defined, from the "Control Panel–U-Track" window (Supplementary Figure 1D) select the "Apply Check/Uncheck to All Movies" and "Run All Movies" boxes and press "Run". This will initiate the MT analysis of the time-lapse series.
- Once the movie processing is completed, a message "Your movie(s) have been processed successfully" is displayed. Press "Ok", then "Save".
- Now it is safe to quit the numerical-analysis software. The results from the movie processing are stored in subfolder structures as m-files in the folder where the raw files are stored.
5. Statistical Analysis of the MT Dynamics
- Import the m-files into a preferred statistic analysis program.
NOTE: In our case, we first import the files in a standard spreadsheet to make them readable. The m-files contain statistical information (median, mean, and standard deviation) on different parameters (e.g., growth speed, MT dynamicity). The detailed list of the parameters is given in the technical report provided with the previous version of the software, plusTipTracker50,52. The generated m-files can also be imported into other data processing software. - Choose the "growth speed mean" parameter and import it into a table for statistics and display. Enter the information on other parameters, (e.g., "dynamicity") either in a new table or in a new column of the same grouped table and plot.
Following the given protocol outlined in Figure 1A, the pEB3-tdTomato plasmid was transiently expressed in asynchronously growing HeLa cells. The cells were synchronized 48 h after the transfection at prometaphase through DME treatment (Figure 1B). This step ensured that the measurement of MT dynamics was always done at the same phase of the cell cycle. The time-lapse movies were further processed and analyzed with U-Track v2.2.0 as described in its supplementary documentation50,51,52. Although the plus-end binding proteins trace only MT growth phases, the U-Track v2.2.0 extrapolates the information on the pause and shrinkage events by linking sequential growth phases and reconstructing the full trajectories26,50. The algorithm is based on the spatially and temporally global tracking framework described by Jaqaman et al.51.
It is important to note that the sensitivity and accuracy of the analysis are strongly dependent on several analysis parameters. As an example, the time-lapse movies were analyzed as described in the protocol (Figure 1C, Video 1 "Before", and Video 2 "After" the analysis), and the resulting growth speed and dynamicity (collective displacement of gap-containing tracks over their entire lifetime) are plotted in Figure 1E,F, respectively (black circles). Then the parameters described to greatly affect the analysis50, such as "Maximum Gap Length" and "Maximum Shrinkage Factor" were modified for the same set of time-lapse movies (Videos 3 and 4, respectively). The corresponding values of growth speed and dynamicity are given in Figure 1E,F as red squares and blue triangles, respectively. The resulting growth speed was not deeply affected. However, the values obtained for dynamicity were significantly different when "Maximum Gap Length" was modified, while it remained unchanged upon altering the "Maximum Shrinkage Factor". As shown in Figure 1D, in all three cases the detection of the MT subtracks was similarly robust. Yet, the reconstruction of the full MT trajectories was mostly affected when "Maximum Gap Length" was set to 15 (Figure 1D, inset images). Further, in order to assess whether the imaging conditions interfered with the MT behavior, the first (1–61 frames) and the second (61–121 frames) halves of the time-lapse series were analyzed separately and the corresponding growth speed and dynamicity values were compared (Figure 1G,H, respectively). As expected, no significant differences were detected between the two parts of the time-lapse series. In videos 1–8 time-lapse images of a mitotic cell synchronized in prophase and expressing EB3-tdTomato are given (duration = 1 min; interval = 0.5 s).
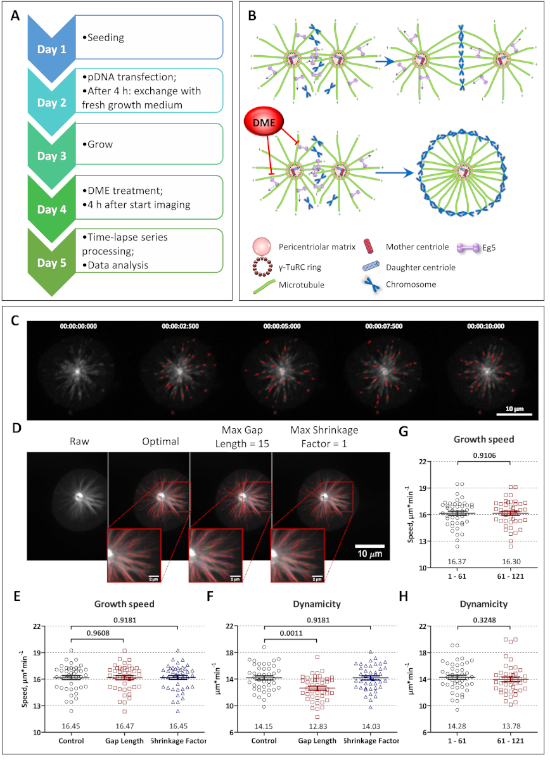
Figure 1: Analysis of the MT dynamics in HeLa cells synchronized in prometaphase. (A) An outline of the steps of the protocol. (B) The schematic representation of the mechanism of DME mediated formation of a monopolar mitotic spindle. (C) A montage of the first 10 frames of the time-lapse movie processed with U-Track software with every second frame shown. The detected trajectories of the MT growth are marked with red. (D) The time series projection of the raw image file and after MT tracking using the settings described in the protocol ("optimal"), and when changing either "Maximum Gap Length" or "Maximum Shrinkage Factor" are given. The insets represent the full MT trajectories, which consist of the growth (red), pause (light blue), shrinkage (yellow), fgap reclassified as growth (green) and bgap reclassified as pause (dark blue) events. The growth speed means (E) and the dynamicity (F) values are shown, and the results using either of the suggested optimal criteria (black circles), maximal gap length set to 15 (red squares), or the maximal shrinkage factor set to 1.0 (blue triangles) are plotted (n = 45 cells; mean ± SEM; one-way ANOVA analysis with Tukey post hoc test for multiple comparison). The growth speed means (G) and the dynamicity (H) values are shown for the first (1–61 frames) and second (61–121 frames) halves of the time-lapse movies (n = 45 cells; mean ± SEM; unpaired t-test with Welch's correction). Please click here to view a larger version of this figure.
Video 1: A representative time-lapse raw image of a prometaphase cell before the analysis. Please click here to view this video. (Right-click to download.)
Video 2: Detection and tracking of the MTs in a cell in Video 1 using the suggested settings for U-Track software. The same time-lapse image in Video 1 processed with U-Track v2.2.0 software using the described settings, and the detected growth tracks are marked in red. Please click here to view this video. (Right-click to download.)
Video 3: Detection and tracking of the MTs in a cell in Video 1 using a nonoptimal value for the "Maximum Gap Length". The same time-lapse image in Video 1 processed with U-Track v2.2.0 software using the same settings as before, but with the "Maximum Gap Length" set to 15. The rest of the parameters were not altered. Please click here to view this video. (Right-click to download.)
Video 4: Detection and tracking of the MTs in a cell in Video 1 using a nonoptimal value for the "Maximum Shrinkage Factor". The same time-lapse image in Video 1 processed with U-Track v2.2.0 software using the same settings as before, but with the "Maximum Shrinkage Factor" set to 1. The rest of the parameters were not altered. Please click here to view this video. (Right-click to download.)
Video 5: An example of a time-lapse series of a cell with cell debris. After the analysis, some cell debris was also detected by the software during MT tracking. Please click here to view this video. (Right-click to download.)
Video 6: Raw data corresponding to Video 5. Please click here to view this video. (Right-click to download.)
Video 7: An example of a time-lapse series of a cell with a high expression of EB3-tdTomato resulting in poor definition of growing tips. Please click here to view this video. (Right-click to download.)
Video 8: Raw data corresponding to Video 7. Please click here to view this video. (Right-click to download.)
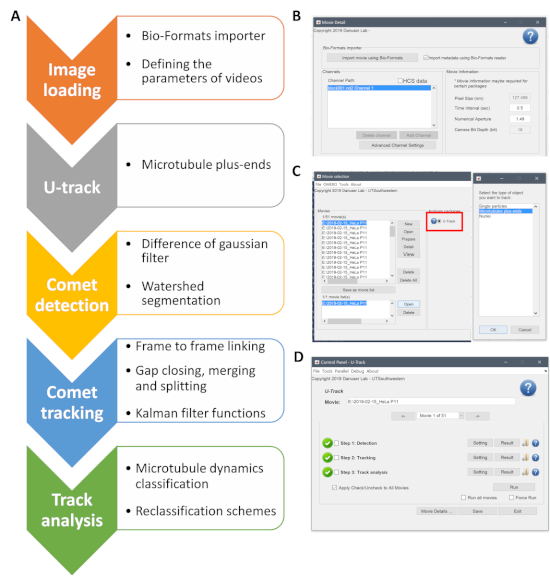
Supplementary Figure 1: The workflow of the analysis using U-Track software. (A) A schematic of the steps employed by the software. (B) A screenshot of the Bio-Formats importer showing how to import the time-lapse files. (C) After uploading the files, U-Track with the MT plus-ends module is selected. (D) A screenshot of the control panel of U-Track where the settings for comet detection, tracking, and track analysis are defined. Please click here to view a larger version of this figure.
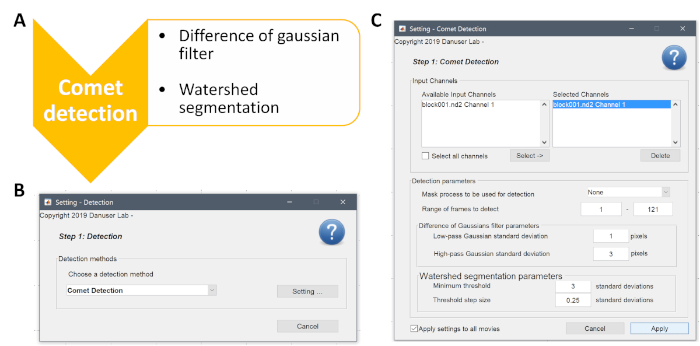
Supplementary Figure 2: Description of the first step of the analysis, the comet detection. (A) An outline of the major events performed by the algorithm. (B, C) Screenshots from the software are given with the optimal values indicated. Please click here to view a larger version of this figure.
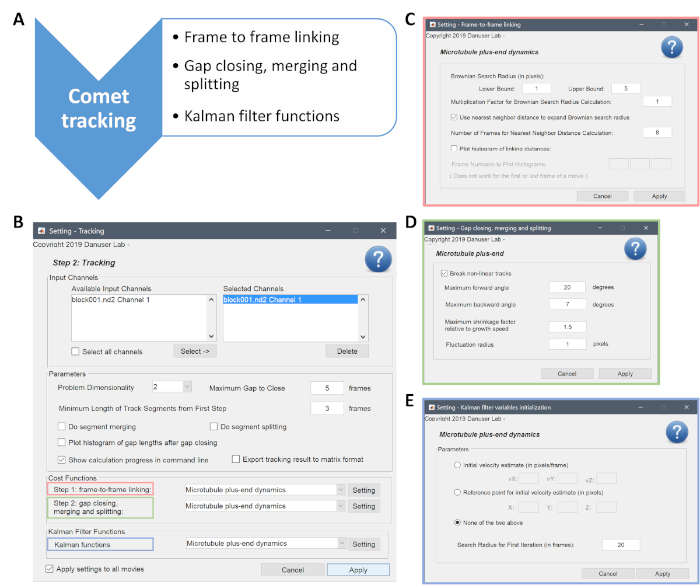
Supplementary Figure 3: Description of the second step of the analysis, the comet tracking. (A) The main steps performed by the algorithm are outlined. (B) A screenshot of the "Tracking" panel is given. The Maximum Gap Close corresponds to the Maximum Gap Length and is set to 5. The tracking of three substeps highlighted with red, green, and blue rectangles. (C,D,E) The numerical values necessary for each substep are entered here. The Maximum Shrinkage Factor is set to 1.5 as indicated in (D). Please click here to view a larger version of this figure.
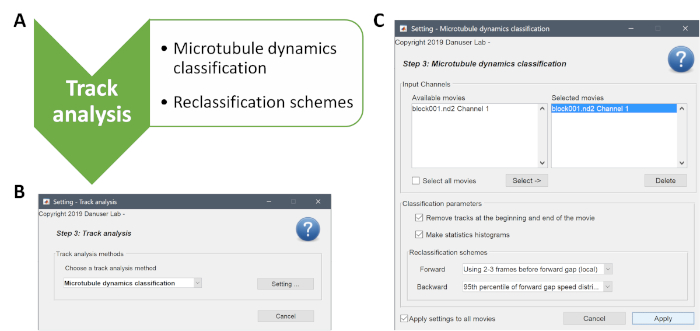
Supplementary Figure 4: Description of the last step of the analysis, track analysis. (A) The MT dynamics classification and reclassification of the compound tracks is performed during this step. (B,C) Screenshots of the track analysis and the corresponding settings are shown. Please click here to view a larger version of this figure.
