NOTE: A schematic diagram of the protocol is shown in Figure 1. A step-by-step description is given is as follows (see Supplementary File 1 for details about the control panels used at every step of the protocol).
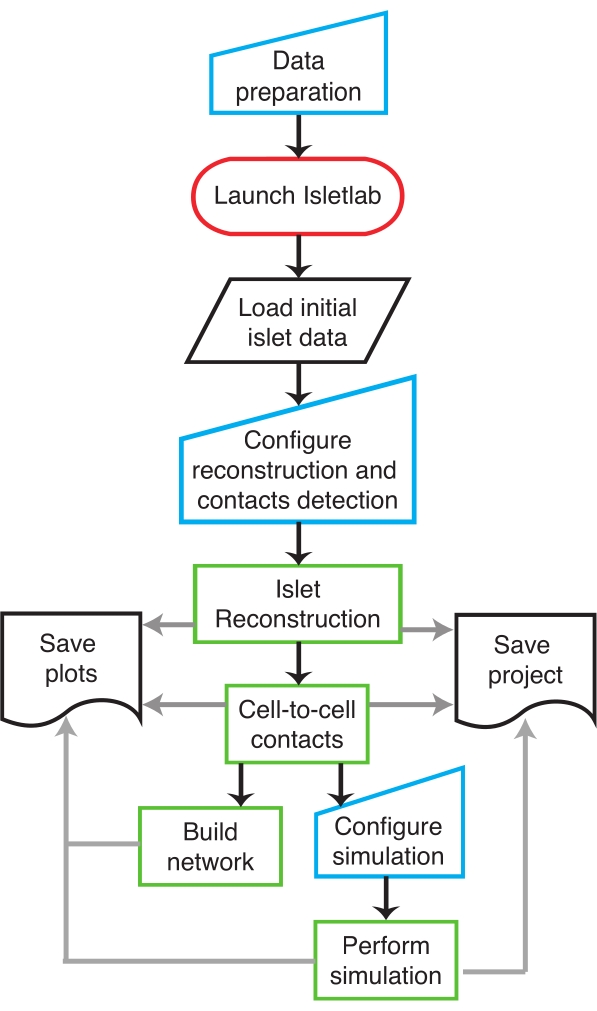
Figure 1: Flow diagram. A flow diagram describing the sequential order of the protocol as implemented in IsletLab. Please click here to view a larger version of this figure.
1. Installing IsletLab in Linux
NOTE: Follow the instructions given in sections 2 and 3 of the Supplementary File 2 to install IsletLab in windows or macOS.
- Open an internet browser and go to https://github.com/gjfelix/IsletLab. Download and extract the IsletLab repository files.
NOTE: The Supplementary File 3 includes a copy of the version of IsletLab used in this protocol. - Verify that the gcc and nvcc compilers are installed. Open a terminal and type the following commands:
gcc –version
nvcc –version
Follow the instructions listed in section 1 of the Supplementary File 2 if any of these commands is not recognized by the system. - Download and install the data science platform (see Table of Materials). Open a terminal and go to the IsletLab folder.
- Create a new environment by typing the following command in the terminal:
conda env create -f isletlabgui_v1.0.yml - Activate the new environment by typing:
conda activate isletlab_v1.0 - Launch the IsletLab application by typing the following command in the terminal (see Figure 2 for a description of the main window):
python isletlabgui_v1.0.py
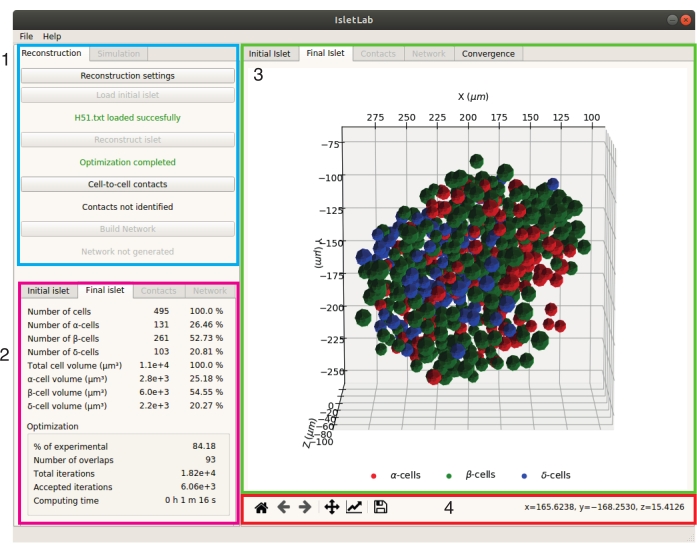
Figure 2: The user interface of IsletLab. The interface is composed of three main panels: configuration (1), statistics (2), and graphics (3) panels. The graphics toolbar (4) is located at the bottom of the graphics panel. Please click here to view a larger version of this figure.
2. Islet reconstruction
- Prepare the input data. Organize the input islet data (i.e., cell types and three-dimension (3D) coordinates) in a four-column file in which column 1 contains the cell type (coded as 11: ɑ-cell, 12: β-cell, 13: δ-cell) and columns 2 to 4 contain the x, y, and z coordinates, respectively (see an excerpt of an input file in section 5 of the Supplementary File 2 or the input test file included in the IsletLab repository).
- Ensure that the input file does not include column headers. Use the example input file included in the IsletLab repository to follow the protocol if needed (Input_Islet_test.txt).
NOTE: Input data used to develop the algorithms implemented in IsletLab was obtained experimentally as described in detail by Hoang et al.11,12 using DAPI staining to determine the nuclear positions and immunofluorescence to identify the cellular types. - Click the Load Initial Islet button and select the file containing input data to generate an initial islet, the 3D representation, and the corresponding statistics. In case of error, the following message will be displayed: 'Error loading islet file'. To correct this, repeat step 2.1.
- Configure the reconstruction process. Click the Reconstruction Settings button and modify the optimization parameters (see sections 4 and 5 of Supplementary File 2 for a brief description of the algorithm and the parameters shown in the reconstruction settings window).
- Set the initial temperature = 1, iterations factor = 1, and acceptance factor = 1. Click the OK button to save the parameter values.
NOTE: As a rule of thumb, an increase in the temperature parameter, as well as in the iterations and acceptance factors, will yield better reconstruction results in terms of the experimental cells included in the reconstructed islet at the expense of an increase in the computing time. - Click the Reconstruct Islet button to open the reconstruction log window (see section 6 of Supplementary File 2 for a description of the information provided in the reconstruction log).
- Click the Run button to start the reconstruction process. Monitor the optimization process until the message: 'Please close this window to continue' is displayed. Close the reconstruction log window to generate the visual representation of the reconstructed islet and to calculate the related statistics (see the left column in Figure 3A-C).
- Evaluate the results of the reconstruction process by analyzing the optimization statistics shown in the final islet tab of the statistics panel. Particularly, focus on maximizing the percentage of experimental cells included in the reconstructed islets (% of experimental) or equivalently, on minimizing the number of overlaps (also shown graphically in the convergence plot, right column in Figure 3A-C).
- If the % of experimental statistic is considered low according to the user objectives, restart IsletLab as described in step 9.1, and increase the initial temperature, iterations factor and acceptance factor in the reconstruction settings and repeat steps 2.1-2.4 until satisfactory results are obtained (> 95% of experimental cells). See sections 5-7 of the Supplementary File 2 for further description of the reconstruction process and the related results.
3. Identifying cell-to-cell contacts
- Click the Reconstruction Settings button and set the Contact Tolerance parameter to define the cell-to-cell contact tolerance and click OK to save the parameter values.
NOTE: The contact tolerance parameter represents the maximal distance between cells in order to be considered as in contact. - Click the Cell-to-Cell Contacts button to identify the cells in close contact. In the contacts tab, check for cells in contact shown graphically (black lines) in the graphics panel and the corresponding statistics (i.e., total, homotypic and heterotypic contacts and ɑ-ɑ, β-β, δ-δ, ɑ-β, ɑ-δ, β-δ contacts) shown in the statistics panel (see the left column of Figure 4A-C).
- Increase (decrease) the contact tolerance parameter to increase (decrease) the number of cell-to-cell contacts. See section 8 of Supplementary File 2 for details about the identification of cell-to-cell contacts and the associated results.
4. Building the islet network
- Click the Build Network button to generate the islet network and to calculate the associated network metrics (see the right column in Figure 4A-C).
NOTE: A further description of the results related to the islet network generated is given in section 9 of Supplementary File 2.
5. Functional simulation of the reconstructed islet
- Switch to the Simulation Tab of the configuration panel of the interface (Figure 5).
- Select the desired mode of intrinsic frequency – Constant or Random – and click the Configure Intrinsic Frequency button to define the oscillators frequency (in Hz). If a random intrinsic frequency is selected, define the mean and deviation (in Hz) to generate normally distributed random frequencies (see section 11 of the Supplementary File 2 for a description of the simulation parameters).
- Select the desired mode of the initial phase – Constant or Random. If a Constant initial phase is selected, click the Configure Initial Phase button to define the phase of the oscillators (in radians). If random initial phase is selected, system will assign random phases between 0 and 2π to all the oscillators.
NOTE: If a constant initial phase is selected, all the oscillators will be initialized in phase. - Click the Configure Interactions button to define the cell-to-cell interaction parameters in the interaction strength window. For a description of the interaction parameters, see section 11 of Supplementary File 2.
- Configure the simulation by defining the total simulation time (in s), time step (in s), and save factor (numbers of steps between saved data points). In the simulation shown in Figure 5 the total time was 20000 s, with a time step of 0.1 s and a save factor of 500.
- Define the number of blocks, threads, and computing platform capability available to perform the simulation. Define these parameters in accordance with the specific characteristics of the graphics processing unit (GPU) available.
NOTE: In the example shown in Figure 5, 36 blocks and 64 threads per block were used (2304 computing platform cores) since a GPU with 36 multiprocessors and 64 computing platform cores per multiprocessors was used. The value of the computing platform capability parameter used was 75 since the hardware computing platform capability was 7.5 (see section 10 of Supplementary File 2 for details about these parameters). - Click the Run Simulation button to open the simulation log window. Click the Run button to start the simulation and monitor the process until the legend: 'Please close the window to continue' is displayed. See section 12 of Supplementary File 2 for details about the simulation log.
- Close the simulation log window to observe the simulation results (see Figure 5). Details about the simulation results are given in section 13 of Supplementary File 2.
6. Save the project (optional)
- Click File > Export Project in the menu bar. Select the directory in which the project file will be saved and click the OK button.
NOTE: The name of the project file is determined automatically based on the name of the initial data file. If the project is not saved, all the results and related files will be deleted automatically. - Load an exported project by clicking File > Load Project.
7. Save figures (optional)
- Click the Save Plot Icon located in the plot toolbar to save the current visualization to an image file. Repeat this step for all the figures created throughout the protocol.
NOTE: Plots and islet visualizations can be modified using the icons available at the plot toolbar of the graphics panel.
8. Load project (optional)
- Click File > Load Project in the main menu and select a project file saved previously as described in steps 6.1-6.2.
NOTE: A project will not be loaded correctly if the project file has been modified externally. If a project is loaded successfully, only the simulation capabilities will be available.
9. Restart the reconstruction process and analysis (optional)
- At any time the user can select File > Restart to discard all the results and start a new reconstruction and analysis.
The reconstruction of pancreatic islets using the methodology proposed by Félix-Martínez et al.19 is highly dependent on the parameters given to the optimization algorithm (defined in the reconstruction settings). An example of this is shown visually in Figure 3 where reconstructed islets obtained using different sets of parameters are shown. First, in Figure 3A, a reconstruction that included 86.6% of the cells included in the initial data is shown (509 out of 588 cells, initial temperature = 1, iterations factor = 1, acceptance factor = 1). When the initial temperature and the iteration and acceptance factors are increased (initial temperature = 10, iterations factor = 5, and acceptance factor = 5, Figure 3B), a higher percentage (93.37%) of initial cells were included in the reconstructed islets (i.e., 549 out of 588 cells). Even better results can be obtained if much higher values are used, particularly for the iteration and acceptance factors, as illustrated in Figure 3C (initial temperature = 10, iterations factor = 1000, acceptance factor = 500), where the reconstructed islet is composed of 99.15% of the initial cells (583 out of 588 cells). The convergence plots (right column in Figure 3A-C), showing the evolution of overlapped cells as a function of the temperature, must be evaluated to determine how the parameters affect the optimization process. As a rule of thumb, the interaction and acceptance factors must be increased when the reconstructed islet includes a low percentage of initial cells. Consequently, the computing time will inevitably increase, since these factors directly increase the number of iterations evaluated. For instance, the computing time of the first reconstruction described above was 6 s. In contrast, the computing times of the second and third reconstructions were 21 s and 24 min 6 s, respectively.
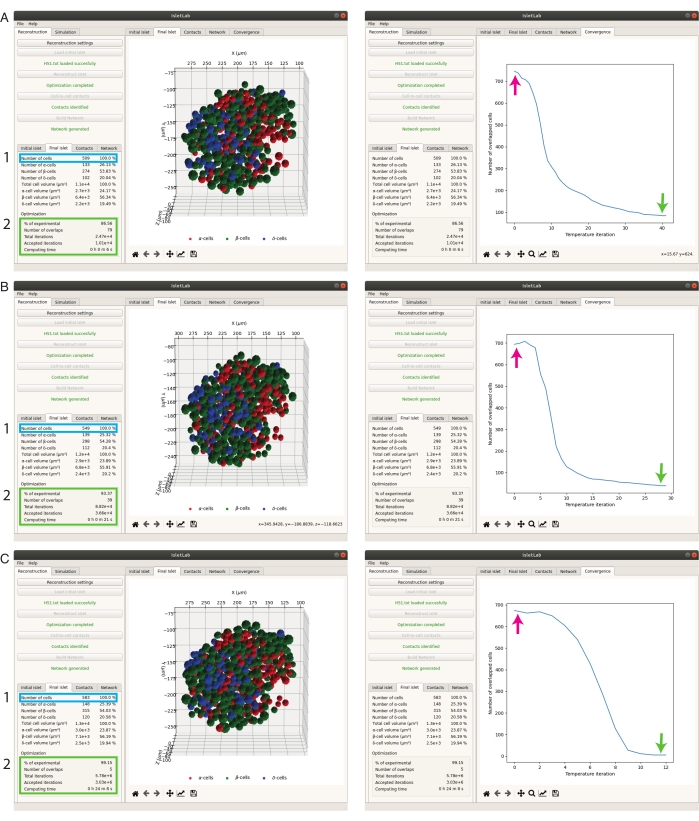
Figure 3: Islet reconstruction using suboptimal sets of parameters in the reconstruction settings Using suboptimal sets of parameters could lead to a low percentage of experimental cells in the reconstructed islets. (A) Left: 86.6% of experimental cells were included in the reconstructed islet (initial temperature = 1, iterations factor = 1, acceptance factor = 1, computing time = 6 s). Right: convergence plot of the reconstruction process. (B) Left: 93.4% of experimental cells were included in the reconstructed islet (initial temperature = 10, iterations factor = 10, acceptance factor = 5, computing time = 21 s). Right: convergence plot of the reconstruction process. (C) Left: 99.15% of experimental cells were included in the reconstructed islet (initial temperature = 10, iterations factor = 1000, acceptance factor = 500, computing time = 24 min, 8 s). Right: convergence plot of the reconstruction process. The arrows in the convergence plots indicate the initial and final number overlapped cells of the reconstruction process (before the postprocessing phase of the reconstruction algorithm). Please click here to view a larger version of this figure.
Identification of cell-to-cell contacts from the reconstructed islet depends on the value of the contact tolerance parameter (defined in the reconstruction settings) as illustrated in Figure 4A–C, where the cell-to-cell contacts (represented by black lines), identified from the reconstructed architectures shown in Figure 3A–C, are presented. For instance, if a contact tolerance of 1 µm is defined, as in Figure 4A, only 290 cell-to-cell contacts are identified. In contrast, if the contact tolerance is increased to 2 µm, as in Figure 4B,C, the total contacts identified increased to 636 and 731, respectively (see the statistics panel in Figure 4A–C). These differences can also be noticed in the visual representation of the cell-to-cell contacts shown in the left column of Figure 4A–C, as the number of contacts between cells clearly increases as a higher value of the contact tolerance is used. It is worth highlighting that the number of contacts also depends on the number of cells included in the reconstructed islets, and therefore, the combination of the temperature parameter, iterations and acceptance factors, and contact tolerance ultimately determine the connectivity of the reconstructed islet, which is reflected on the islet networks formed and the corresponding network metrics, as shown in the right column of Figure 4A–C. The network plot allows the user to visualize how the different cells are connected. Quantitatively, connectivity properties of the islet are described in terms of the following network metrics: average degree, density, average clustering coefficient, efficiency, and diameter (details about these metrics can be consulted in section 9 of the Supplementary File 2).
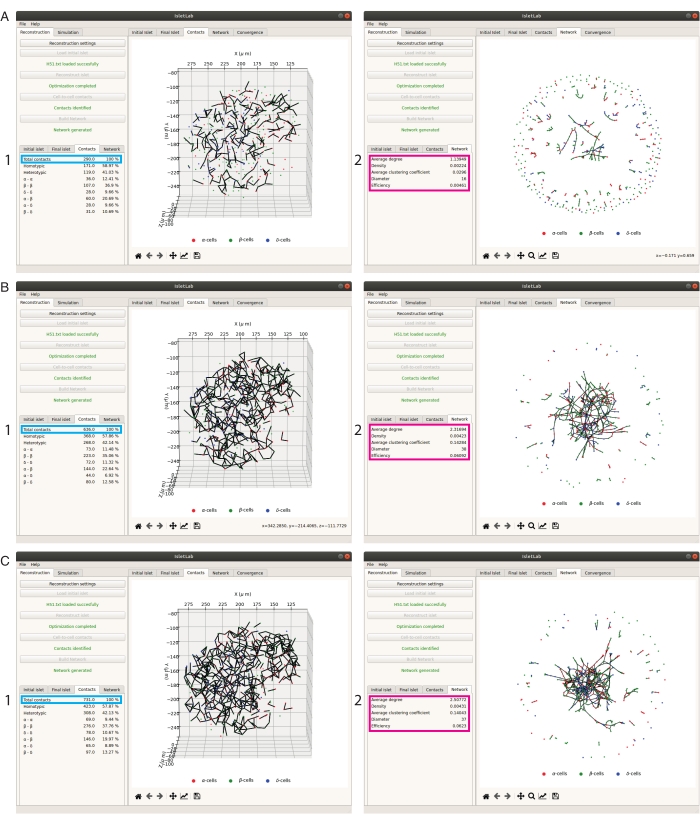
Figure 4: Effect of the contact tolerance parameter in the identification of cell-to-cell contacts. (A-C) Left: cell-to-cell contacts identified from the reconstructed islets shown in Figure 3A–C (290, 636, and 731 total contacts in panels A, B, and C, respectively). Values used for the contact tolerance parameter were 1 µm (A) and 2 µm (B and C). Note that the number of cells included in the reconstructed islets also affects the number of cell-to-cell contacts identified. Right: networks generated from the cell-to-cell contacts are shown in the corresponding left column. Note the impact of the connectivity on the network metrics is highlighted in the statistics panel. Please click here to view a larger version of this figure.
Finally, once the islet has been reconstructed and the cell-to-cell contacts have been identified, a functional simulation can be performed (only when a compatible GPU is available). Typical simulation results are shown in Figure 5, including the summed oscillations of the different cell populations (ɑ, β, and δ-cells) and the whole islet (upper plot of the graphics panel in Figure 5). This figure shows the phase differences over time between the different cell populations as a result of the connectivity and interaction properties and allows the user to determine the contribution of each cell population (red, green, and blue lines) to the oscillatory behavior of the whole islet (black line). For instance, the upper panel of Figure 5 suggests that, at the population level, ɑ and β-cells oscillate completely out of phase, while δ-cells oscillate out of phase with ɑ and β-cells. Moreover, according to the simulation, the oscillatory behavior of the islet is dominated by the oscillations of the ɑ-cells, although the effect of the other cell populations can be also noticed. Note that the oscillatory signals of all the islet cells are saved automatically in a data file (see Table 1 and section 13 in Supplementary File 2), thus allowing the user to perform a detailed analysis of the simulation results. As a complement, the islet synchronization index, which reflects the phase coherence of the oscillations, is also calculated and displayed (bottom plot of the graphics panel in Figure 5). Note that the synchronization index ranges from 0 to 1, where 0 and 1 indicate a null and total synchronization between all the cells in the islet, respectively. The synchronization index plot can be therefore interpreted as a visualization of how the synchronicity between islet cells varies over time as a result of the connectivity and interaction properties of the reconstructed islet. Since the simulation performed is based on the idea of coupled oscillators12 and heavily depends on the connectivity of the reconstructed islet, it is key to reach an acceptable islet reconstruction and cell-to-cell connectivity before performing a functional simulation.
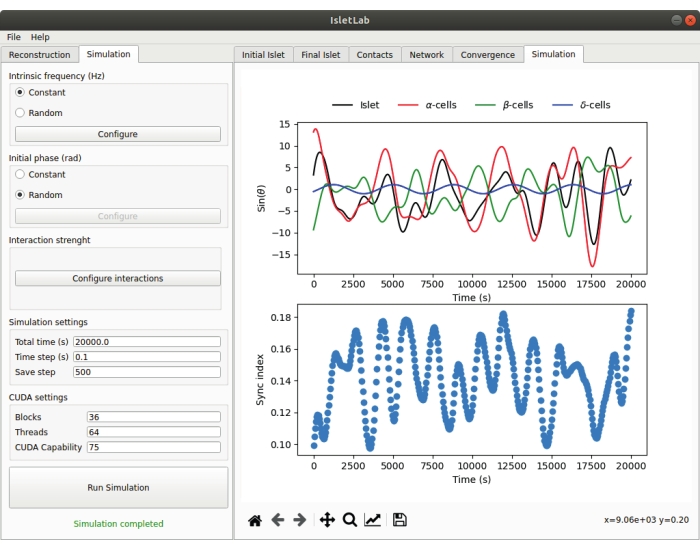
Figure 5: The simulation parameters are defined in the configuration panel of the simulation tab. The results of the simulation are shown in the simulation tab of the graphics panel where the summed oscillatory behavior of the different populations of cells (ɑ, β, and δ) and the whole islet are shown (top). The synchronization index, a measure of phase coherence between the islet cells, is also shown (bottom). Please click here to view a larger version of this figure.
It is worth mentioning that practically at every step of the process, data files are generated. A description of the data files generated can be found in Table 1 and throughout Supplementary File 2.
| File | Description |
| IsletFileName | Input data (given by the user) |
| IsletFileName_initial.txt | Initial islet architecture proposed by the algorithm to as initial step of the reconstruction |
| IsletFileName_reconstructed.txt | Reconstructed islet (not posptrocessed) |
| IsletFileName_postprocessed_islet.txt | Final reconstructed islet and postrocessed islet |
| IsletFileName_processlog.txt | Reconstruction log (optimization algorithm) |
| IsletFileName_overlapped_cells.txt | Overlapped cells at the end of the reconstruction process (postprocessing) |
| IsletFileName_all_contacts.txt | Adjancency matrix of all contacts |
| IsletFileName_aa_contacts.txt | Adjancency matrix of ɑ-ɑ contacts |
| IsletFileName_ab_contacts.txt | Adjancency matrix of ɑ-β contacts |
| IsletFileName_ad_contacts.txt | Adjancency matrix of ɑ-δ contacts |
| IsletFileName_bbbd_contacts.txt | Adjancency matrix of β-β and β-δ contacts |
| IsletFileName_bb_contacts.txt | Adjancency matrix of β-β contacts |
| IsletFileName_bd_contacts.txt | Adjancency matrix of β-δ contacts |
| IsletFileName_dd_contacts.txt | Adjancency matrix of δ-δ contacts |
| IsletFileName_Kmat.txt | Interaction matrix used in the simulation |
| IsletFileName_kuramoto_angles.txt | Results of the Kuramoto simulation |
Table 1: Description of files saved as a part of the project file. Note that the file name used to save the project files are automatically defined by the initial data file selected by the user.
Supplementary File 1: Graphical description of the protocol using the control panels of IsletLab. Please click here to download this File.
Supplementary File 2: IsletLab documentation. Please click here to download this File.
Supplementary File 3: Includes all the files needed to install IsletLab. Please click here to download this File.
