Rapid detection and reliable quantification of RNA editing events at a genomic scale remain challenging and currently rely on direct RNA sequencing methods. The protocol described here uses microtemperature gradient gel electrophoresis (µTGGE) as a simple, quick, and portable method of detecting RNA editing.
RNA editing is a process that leads to posttranscriptional sequence alterations in RNAs. Detection and quantification of RNA editing rely mainly on Sanger sequencing and RNA sequencing techniques. However, these methods can be costly and time-consuming. In this protocol, a portable microtemperature gradient gel electrophoresis (µTGGE) system is used as a nonsequencing approach for the rapid detection of RNA editing. The process is based on the principle of electrophoresis, which uses high temperatures to denature nucleic acid samples as they move across a polyacrylamide gel. Across a range of temperatures, a DNA fragment forms a gradient of fully double-stranded DNA to partially separated strands and then to entirely separated single-stranded DNA. RNA-edited sites with distinct nucleotide bases produce different melting profiles in µTGGE analyses. We used the µTGGE-based approach to characterize the differences between the melting profiles of four edited RNA fragments and their corresponding nonedited (wild-type) fragments. Pattern Similarity Scores (PaSSs) were calculated by comparing the band patterns produced by the edited and nonedited RNAs and were used to assess the reproducibility of the method. Overall, the platform described here enables the detection of even single base mutations in RNAs in a straightforward, simple, and cost-effective manner. It is anticipated that this analysis tool will aid new molecular biology findings.
Single nucleotide variants (SNVs) in genomic RNA, including A-to-I, C-to-U, and U-to-C variants, can indicate RNA editing events. However, the detection of SNVs in RNA remains a technically challenging task. Conventionally, the ratio of edited to nonedited RNA is determined by direct sequencing, allele-specific real-time polymerase chain reaction (PCR), or denaturing high-performance liquid chromatography (HPLC) approaches1,2,3,4,5,6. However, these approaches are not particularly time- or cost-effective, and their low accuracies, caused by high levels of noise, pose technological bottlenecks for RNA-based SNV detection7,8. Here, we describe a protocol based on temperature gradient gel electrophoresis (TGGE) to identify single nucleotide polymorphisms (SNPs) as an alternative method that eliminates the need for direct RNA sequencing approaches to RNA editing analyses.
Electrophoresis is a preferred method for the separation and analysis of biomolecules in life science laboratories. TGGE enables the separation of double-stranded DNA fragments that are the same size but have different sequences. The technique relies on sequence-related differences in the melting temperatures of DNA fragments and subsequent changes in their mobilities in porous gels with a linear temperature gradient9,10. Melting of DNA fragments generates specific melting profiles. Once the domain with the lowest melting temperature reaches the corresponding temperature at a particular position in the gel, the transition from a helical structure to a partially melted structure occurs, and migration of the molecule will practically halt. Therefore, TGGE utilizes both mobility (size information) and temperature-induced structural transitions of DNA fragments (sequence-dependent information), making it a powerful approach to the characterization of DNA fragments. The feature points in a TGGE melting pattern, which correspond to three structural transitions of the DNA molecule, are the strand initial-dissociation point, the strand mid-dissociation point, and the strand end-dissociation point (Figure 1). Sequence variations within domains, even single-base differences, affect the melting temperature, hence, molecules with different sequences will show discrete melting (denaturation) patterns in TGGE analyses. Therefore, TGGE can be used to analyze SNVs in genomic RNA and can be an invaluable high-throughput method of detecting RNA editing. This high-throughput gain is lost when traditional gel electrophoresis-based TGGE is used. However, a miniaturized version of TGGE, named microTGGE (µTGGE), can be used to shorten the gel electrophoretic time and accelerate the analysis with a 100-fold increase in productivity11. The simplicity and compactness of the µTGGE method have been improved by the introduction of PalmPAGE12, a field-applicable, handheld, and affordable gel electrophoresis system.
Here, a new TGGE-based protocol is used to examine three types of RNA editing sites (A-to-I, C-to-U, and U-to-C) in four genes, including two from Arabidopsis thaliana tissues and two expressed in mammalian HEK293 cells (Figure 1A). The protocol integrates the use of PalmPAGE (hardware), a portable system for the rapid detection of RNA editing, and uMelt (software)13. With an average run-time of 15-30 min, this protocol enables rapid, reliable, and easy identification of RNA editing without the need for direct RNA sequencing approaches.
1. Optimization of the target fragment
NOTE: Four edited genes were used in the development of this protocol, including two nuclear genes (AT2G16586 and AT5G02670) from A. thaliana, and the genes encoding blue fluorescent protein (BFP) and enhanced green fluorescent protein (EGFP) expressed in HEK293 cells.
2. RNA extraction and RT-PCR amplification of the target fragment
3. µTGGE analysis
NOTE: The µTGGE analysis is performed using a miniaturized and economic system. An overview of the complete system, including the gel cassettes, gel cassette holder, horizontal gel electrophoresis platform, power supply, and gel imaging system, is shown in Figure 2.
4. PaSS calculations
NOTE: The calculations are performed using µTGGE Analyzer software.
Use of µTGGE to identify single nucleotide base changes in RNA editing events
Four edited genes were used for this protocol (Table 1), including the BFP gene produced in HEK293 cells (with C-to-U RNA editing by the deaminase enzymes of apolipoprotein B mRNA editing enzyme complex; APOBEC115), the EGFP gene containing the ochre stop codon (TAA) produced in HEK293 cells (with A-to-I RNA editing by adenosine deaminase acting on RNA 1; ADAR116), and the AT2G16586 and AT5G02670 nuclear genes in A. thaliana17,18 (with U-to-C RNA editing). Single nucleotide differences between the edited and corresponding nonedited samples were confirmed by DNA sequencing. Then a µTGGE analysis was performed to examine the differences between the melting curves of the samples (Figure 3).
For the C-to-U RNA editing type, the nonedited sample with the original C base showed a longer melting pattern at the strand end-melting point than the edited sample with the modified U base (Figure 3A). For the A-to-I(G) RNA editing type, the edited sample with the modified I(G) base displayed a longer melting pattern at the strand end-melting point than the nonedited sample with the original A base (Figure 3B). For the "reverse" U-to-C RNA editing type, two genes were analyzed. For the AT2G16586 gene, the edited sample with the modified C base showed a longer melting pattern between the strand initial-melting and strand end-melting points than the nonedited sample with the original U base (Figure 3C). However, a similar pattern was not observed for the other AT5G02670 gene (Figure 3D). Nonetheless, there was a distinct difference between the nonedited and edited types at the end-melting point. This shows that observing melting profiles clearly is an important step in distinguishing between nonedited and edited types.
Quantitative analysis of µTGGE melting patterns representing RNA editing events
Next, we calculated PaSS values11 to evaluate the reproducibility of the µTGGE-based melting profiles representing the four RNA editing events described above. The PaSS value provides a measure of how closely two melting patterns can be superposed, generating a higher value (maximum: 1) for highly similar melting patterns. Thus, PaSS values for comparisons of nonedited and edited samples are expected to be less than one. As shown in Figure 1B, the feature points of the melting patterns that corresponded to structural transitions from double-stranded to single-stranded DNA were used to calculate PaSS values. To eliminate experimental variables, computer-aided normalization was performed using two internal reference points: reference point #1, representing the position of the sample in double-stranded form (the leftmost lane), and reference point #2, representing the position of the sample in single-stranded form (the rightmost lane). The coordinates of the feature points were normalized to those of the internal reference points and were then used to calculate the PaSS values. Each experiment was repeated three times, and the average value was determined. As expected, the PaSS values of the four edited samples were lower than one (Figure 4). The PaSS values of the C-to-U and A-to-I RNA editing types were lower than those of the two U-to-C RNA editing types. This difference is likely related to the respective locations of the editing sites. Specifically, the C-to-U and A-to-I edited sites were located relatively close to the 5'-terminal ends (at positions 48 and 59 of the ~300 bp fragments, respectively), whereas the U-to-C edited sites were located near the middle of the fragments (at positions 152 and 169). These findings suggest that edited sites located at terminal positions can be detected using µTGGE more easily than those located toward the center of fragments.
Optimization of TGGE melting patterns to identify RNA editing events
As our previous results suggested that the PaSS value may vary depending on the specific position of the RNA editing site, we examined the differences between the melting patterns of a 300 bp fragment of the BFP gene (expressed in HEK293T cells) in which a C-to-U edited site was located close to the 5'-terminal end, close to the 3'-terminal end, or in the center of the fragment (Figure 5A). Prior to µTGGE analysis, the melting patterns of the nonedited fragment and three edited fragments were predicted using the uMelt HETS web-based tool. This analysis showed that the C-to-U modification would be expected to shift the melting curve to the left along the temperature axis (Figure 5B). The PaSS values calculated from µTGGE analyses of the nonedited and the three edited fragments were ordered as follows: 5'-terminal end RNA edit < 3'-terminal end RNA edit < center of 5'- and 3'-terminal ends RNA edit (Figure 5C). Notably, these PaSS values were consistent with the results predicted using uMelt. These findings indicate that nucleotide base differences located at the 5'- or 3'-terminal end result in larger variations between the PaSS values of edited and nonedited genes than nucleotide base differences located more centrally. In addition, these results suggest that prior knowledge of the differences between the melting profiles of edited and nonedited genes can be used as a guide to optimize gene fragments for RNA editing.
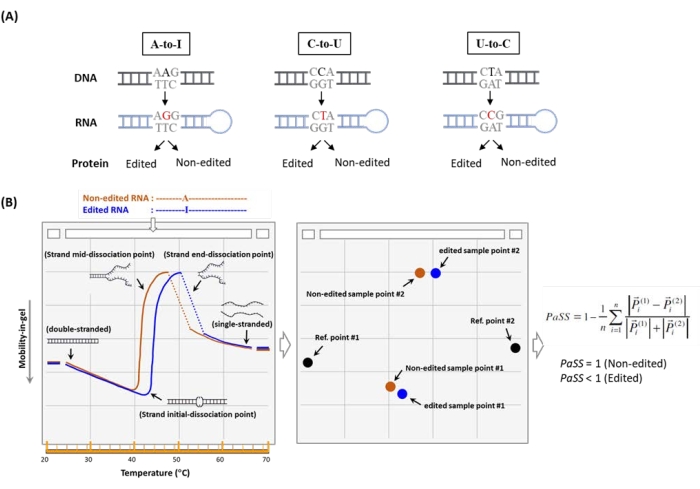
Figure 1: The procedure used to identify RNA editing by µTGGE. (A) The types of RNA editing events examined. (B) A schematic illustration of the typical melting profiles of edited and nonedited genes. In µTGGE, a sample migrates through a temperature gradient gel, producing a characteristic curvature. The feature points of the melting pattern are assigned and then processed to calculate a Pattern Similarity Score (PaSS) value. The PaSS calculation is performed as shown in the equation, where the vector P of each feature point is in its corresponding position and the function of temperature and mobility (i.e., vector P = P (T, m)). The superscripts (1) and (2) represent the edited and nonedited genes, respectively. Please click here to view a larger version of this figure.
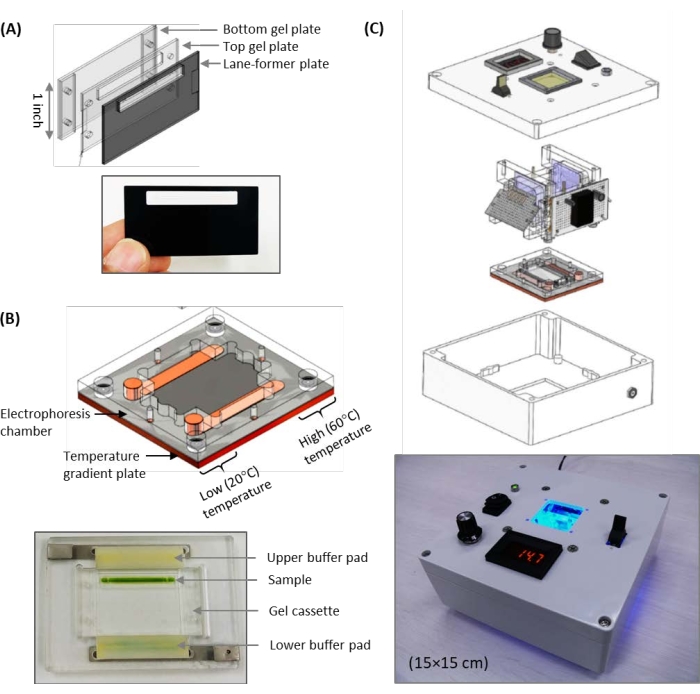
Figure 2: Illustrations and photographs of the palm-sized gel electrophoresis device. (A) Assembly of the three 1 in gel cassettes. (B) Illustration of the gel cassette holder with the temperature gradient plate. The photograph shows the positions of the upper and lower buffer pads, as well as that of the sample after initial loading. (C) Overview of the complete system, including the power supply, horizontal gel electrophoresis platform, and gel imaging system. Thissystem provides a viable solution for rapid, onsite polyacrylamide gel electrophoresis-based analyses. Please click here to view a larger version of this figure.
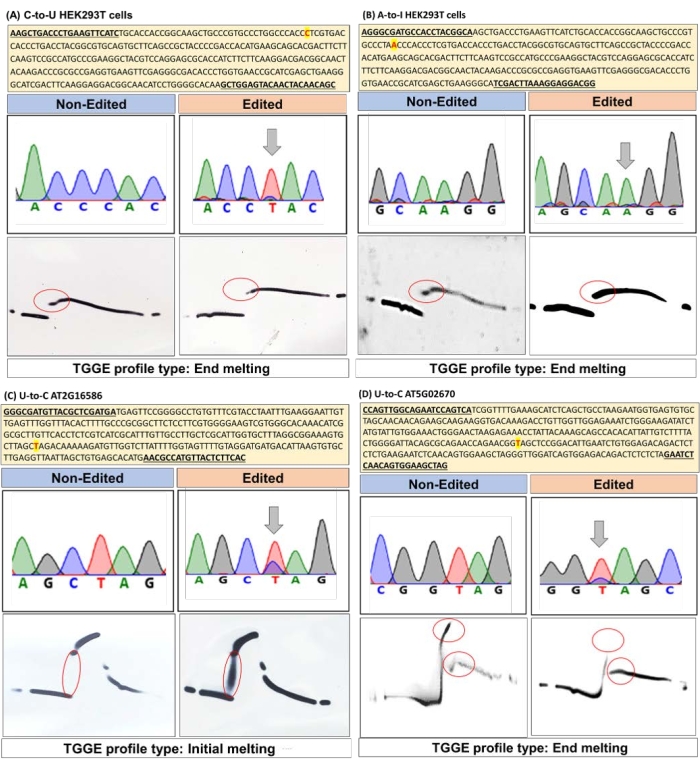
Figure 3: TGGE analyses of single nucleotide changes in RNA editing events. Melting profiles for three different RNA editing types were examined using four genes. (A) C-to-U RNA editing in BFP expressed in HEK293T cells. (B) A-to-I(G) RNA editing in EGFP expressed in HEK293T cells. (C) U-to-C RNA editing in the AT2G16586 gene from A. thaliana. (D) U-to-C RNA editing in the AT5G02670 gene from A. thaliana. The locations of the edited sites are highlighted in yellow (with red font), and the primer positions are underlined. The differences between the melting patterns of the edited and nonedited samples are indicated by red circles. Please click here to view a larger version of this figure.
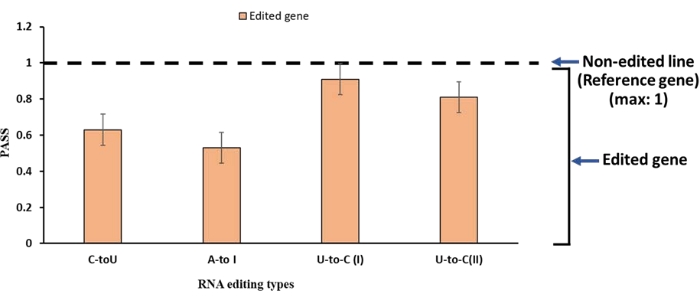
Figure 4: The average PaSS values for the four edited genes examined here. Error bars represent the standard deviation of three replicates. Please click here to view a larger version of this figure.
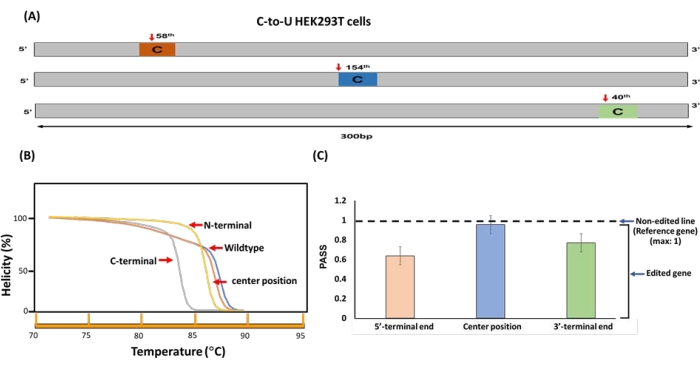
Figure 5: Position-specific PaSS analysis. (A) The C-to-U type RNA editing site in the BFP gene expressed in HEK293T cells was shifted to the 5'-terminal end, 3'-terminal end, or center of the gene fragment. (B) Theoretical prediction of the melting patterns of the nonedited and three edited fragments shown in (A). The predictions were performed using uMelt. (C) The average PaSSvalues of the edited genes shown in (A). Error bars represent the standard deviation of three replicates. Please click here to view a larger version of this figure.
S.No | RNA editing | Source | Poste | Gene ID | Forward Primer | Reverse Primer | Sequence length | ||
1 | C-to-U | HEK293T cells | 48th | EGFP | AAGCTGACCC TGAAGTTCATC |
GCTGTTGTAGT TGTACTCCAGC |
324 | ||
2 | A-to-I | HEK293T cells | 59th | EGFP | AGGGCGATGC CACCTACGGCA |
CCGTCCTCCT TTAAGTCGA |
300 | ||
3 | U-to-C | Arabidopsis | 152th | AT2G16586 | GGGCGATGTT ACGCTCGATGA |
GTGAAGAGTAA CATGGCGTT |
301 | ||
4 | U-to-C | Arabidopsis | 169th | AT5G02670 | CCAGTTGGCAG AATCCAGTCA |
CTAGCTTCCAC TGTTGAGATTC |
300 |
Table 1: List of genes used in the current protocol
RNA editing plays an important role in biology; however, current methods of detecting RNA editing, such as chromatography and sequencing, present several challenges due to their high cost, excessive time requirements, and complexity. The protocol described here is a simple, rapid, and cost-effective method of detecting RNA editing that uses a portable, microsized, TGGE-based system. This system can be used to differentiate between edited and nonedited genes prior to Sanger sequencing. Specifically, edited and nonedited genes with single-base nucleotide modifications can be differentiated based on changes in the TGGE melting profiles. As it incorporates 1 in gels, the system requires very small amounts of samples and enables rapid detection of differences between sequences. In addition, the protocol described here is very easy to follow for both experts and newcomers to the field. Optimization of the target gene fragment is critical for clear differentiation between edited and nonedited regions, and this process is simplified in the current protocol.
This protocol is compatible with multiplex analyses using fluorescently tagged primers. For quantitative analyses, unknown RNA samples (edited or nonedited) can be tagged with green fluorescence and comigrated with a red fluorescence-tagged reference standard (edited or nonedited) during TGGE analysis.
In addition to demonstrating the ability of the µTGGE method to detect single nucleotide RNA editing events, we also validated the similarity between the experimental result obtained using µTGGE and a theoretical result obtained for the same gene fragment using uMELT. Furthermore, we found that nucleotide base differences located at the 5′- and 3′-terminals of gene fragments produce larger differences in µTGGE melting profiles (i.e., smaller PaSS values) than those located toward the center of the fragments. Although promising, the current protocol may be limited to the analysis and detection of specific types of nucleotide modifications during RNA editing. Further optimization and development of this protocol to analyze other types and/or locations of RNA editing will be performed in our upcoming research.
The authors have nothing to disclose.
This work was supported by a Grant-in-Aid for Scientific Research from the Japan Society for the Promotion of Science (17H02204 and 18K19288). Ruchika was financially supported by the Japanese government (MEXT scholarship). We thank Ms. Radhika Biyani (Takagi Laboratory, JAIST) and Dr. Kirti Sharma (BioSeeds Corporation) for help with electrophoresis-related experiments.
2U ExoI | Takara | 2650A | Exonuclease I |
40(w/v)%-acrylamide/bis (19:1) | Thermo fisher | AM9022 | |
Ammonium persulfate (APS) | Thermo Fisher | 17874 | |
Centrifuge Mini spin | eppendorf | 5452000034 | |
Digital dry bath/ block heater | Thermo fisher | NA | |
Gold Taq Polymerase Master mixture | Promega | M7122 | |
LATaq DNA polymerase | TAKARA | RR002A | Taq Polymerase |
micro-TGGE cassette holder | BioSeeds Corp. | BS-GE-CH | |
micro-TGGE apparatus | Lifetech Corp. | TG | |
micro-TGGE gel cassette | BioSeeds Corp. | BS-TGGE-C | |
NanoDrop 1000 | Thermo fisher | ND-1000 | Spectrophotometer |
Plant Rneasy Mini kit | Qiagen | 74904 | |
ReverTra Ace Master Mix | TOYOBO | TRT101 | M-MLV (Moloney Murine Leukemia Virus) reverse transcriptase |
Rneasy Mini kit | Qiagen | 74104 | |
Shrimp Alkaline Phosphatase | Takara | 2660B | |
SYBR Gold nucleic acid gel stain | Thermo fisher | S11494 | |
TBE buffer | Thermo fisher | B52 | |
Tetramethylethylenediamine (TEMED) | Nacalai tesque | 33401-72 | |
Urea, Nuclease and protease tested | Nacalai tesque | 35940-65 |