For all procedures involving human tissue, approval by the Ethics Committee Research UZ/KU Leuven (EC research) was acquired. All research was performed with informed consent and/or assent from parents, representatives, and/or patients.
NOTE: All procedures involving rectal biopsies and organoids should be performed in a laminar flow to protect the researcher from any biological hazard and to minimize the risk of contamination of the cultures. As for any lab procedure, researchers should at all times wear lab coats, gloves, and safety goggles to manipulate samples.
1. Rectal biopsy, isolation of adult stem cells from crypts, and organoid culture
- For this initial part of the protocol, including media production and usage, organoid culture, splitting, expansion, and freezing for biobanking, follow the two previously published protocols8,12.
- In short, the following steps have to be taken:
- Take three to four rectal biopsies with a forceps or suction device and collect in a sterile container (e.g., 1.5 mL microcentrifuge tube) with the Ad-DF+++ medium as described in the protocol mentioned above.
- Transport biopsies to a central lab on ice or at 4 °C. Transport to other centers is possible, and quality is not significantly affected even when transport takes up to 48 h. If transport is expected to take over 6 h, use a 15 mL conical tube with 6 mL of Ad-DF+++ medium instead of a 1.5 mL microcentrifuge tube.
- Wash the biopsies in cold PBS until the supernatant is clear to remove the debris and non-epithelial tissues such as fat tissue.
- Incubate the biopsies with EDTA (final concentration 10 mM) to detach the crypts. Plate the crypts in a basement membrane matrix. Add broad-spectrum antibiotics (gentamicin 50 µg/mL and vancomycin 50 µg/mL) to the medium in the first week of culturing to prevent bacterial contamination.
- When the crypts have budded and are closed and proliferated, perform mechanical splitting, usually after 7 days.
- Split the resulting organoids approximately every 7 days. This way, expand the culture, freeze backup samples in a biobank, or use the organoids for assays.
2. Organoid plating for ROMA (day 1)
- Mechanically split the organoids for plating
- Collect organoids from three well-grown wells from a 24-well plate by washing twice with cold Ad-DF+++ medium, collect them in a 1.5 mL microcentrifuge tube, and assess them under the microscope12.
- Ensure that organoids are viable and of high quality, which can usually be achieved after 5-7 days of growth after being split previously (Figure 1).
- Mechanically split the organoids according to the aforementioned protocol8,12. Repeat until the majority of the organoids, as assessed using the brightfield microscope, are small enough compared to the initial observation.
- Collect the smaller organoids, usually corresponding to the collection of about the top 4/5 of the organoid-medium solution in a new microcentrifuge tube, as big organoids sink to the bottom of the tube due to gravity and small organoids stay suspended in the upper part of the medium column.
- Centrifuge the sample of smaller organoids at 0.3 x 1000 g for 2 min and discard the medium.
- Dilute the pellet of smaller organoids in 130 µL of 40%-50% basement membrane matrix (diluted with Ad-DF+++ medium12).
- Resuspend well using a 200 µL micropipette.
- Plate the organoids in a 96-well plate
- Using a 20 µL pipette, plate organoids in 32 wells of a pre-warmed 96-well plate. Ensure that each well contains one 4 µL drop of the organoid-matrix solution produced in the previous step.
- The organoids in the solution tend to form a pellet at the bottom of the tube due to gravity-dependent downwards displacement. To prevent this and ensure uniform plating, regularly resuspend the organoid-matrix solution using a 200 µL micropipette (e.g., every time after plating four to eight wells).
- Plate each drop in the center of the well to prevent the drop from running toward the edges of the well, which would reduce image quality later.
- Aim for around 30 organoids per well (minimum 15, maximum 90) without overlapping organoids.
- Keep in mind that these organoids will have to be incubated overnight and will grow slightly during this time, and might start overlapping if the plating density is too high.
- Check plating density using a brightfield microscope with a 5x magnification objective after plating the first one or two wells.
- If the plating density is too high, dilute the organoid-matrix solution stepwise with the addition of the basement membrane matrix until the desired plating density is reached (Figure 2).
- After plating, gently tap the plate on a flat surface to ensure that the majority of organoids are in the same focal plane.
- Incubate the plate
- Incubate the 96-well plate at 37 °C and 5% CO2 during 8-10 min to allow gelation of the basement membrane matrix.
- Add 50 µL of human colon organoid medium +/+12 in each well and incubate overnight for 16-24 h.
- Add no forskolin nor CFTR modulators, so the organoids grow under basal conditions.
3. Organoid imaging using confocal microscopy (day 2)
- Stain the organoids with calcein green
- Prepare a 1 mM stock solution of calcein green by adding 50 µL of dimethylsulfoxide (DMSO) to one vial containing 50 µg of calcein green.
- Prepare a working solution of calcein green by adding 1.2 µL of the stock solution to 200 µL of Ad-DF+++ (concentration 6 µM).
- Add 5 µL of this calcein mixture to each well of the 96-well plate in which organoids were plated (final calcein concentration 0.6 µM). Do not touch and dislocate the matrix drop inside the well when performing this step.
- Rotate and slightly tilt the plate with the lid on a few times to ensure homogenous distribution of the calcein green in the whole well.
- Incubate the plate again for 15-30 min at 37 °C and 5% CO2 to ensure staining of all organoids in the wells.
- Transfer the plate to the confocal microscope
- Transfer the plate to the confocal microscope with an automated stage and integrated incubator. Ensure that the plate is well fixed in the plate holder.
- Incubation at 37 °C and 5% CO2 is optional but not necessary, given the short duration (about 10 min) of the imaging process.
- Focus on the organoids (Figure 3)
- Using the confocal microscope, determine the optimal x/y position and focus (z position) of the organoids in each well manually, and save these positions in the imaging software.
- The best focus implies the sharpest possible delineation of the organoids and visualization of the largest possible part of the organoid drop. If the distribution of the stain is not adequate, repeat steps 3.1.4 and 3.1.5 (incubate, for example, for an extra 5-10 min).
- Use live-cell imaging settings with emission at 488 nm and excitation at 515 nm (specific for visualization of calcein fluorescence) and a 5x LD magnification objective.
- Acquire organoid pictures of the 32 wells with the confocal microscope (Figure 3 and Figure 4).
- Take images in a unidirectional way with a resolution of 1024 pixels x 1024 pixels (pixel size 2.5 µm x 2.5 µm) and depth of 16 bits.
- Choose the laser intensity and master gain for optimal visualization of morphological differences between CF and non-CF organoids (e.g., discrimination between a non-stained water-filled central lumen (if present) and a stained cellular border).
NOTE: Organoids will not be delineated correctly when the master gain and thus the fluorescence signal are too low; setting the master gain too high will result in images with organoids with homogenous very high signal intensity, preventing imaging of more subtle morphological differences (Figure 2). - Save one picture per well for all 32 wells in the microscope format and export them as TIFF files.
4. Image analysis (Figure 5)
- Load the TIFF files in the image analysis software.
- Perform the first quality check based on exclusion criteria determined by the operator (Figure 2): many differentiated or dead structures or debris, inadequate plating density, too many (e.g., overlapping) or too few organoids, and inadequate fluorescence distribution (organoids not clearly delineated, background signal too high).
NOTE: This step can also be performed before exporting images as TIFF files in step 3.4. - Prepare images for analysis
- Recalibrate images, so 1 pixel corresponds to 2.5 µm x 2.5 µm.
- Create and open one Network Data (.ND) file of all 32 pictures for each organoid culture, enabling simultaneous analysis of all 32 pictures per subject.
- Delineate the organoids
- Delineate structures using a lower intensity threshold of 4,500 and an upper threshold of 65,535 (Smooth and Clean functions off; Fill Holes function on; Separate function at x3).
NOTE: This delineates fluorescent structures, with Fill Holes including the lumen in the delineated structure if present.
- Delineate structures using a lower intensity threshold of 4,500 and an upper threshold of 65,535 (Smooth and Clean functions off; Fill Holes function on; Separate function at x3).
- Count the organoids
- Select all structures ≥40 µm.
- Click the Update ND Measurement button (every time a measurement is needed); the counted organoids will be numbered.
NOTE: This equals the total number of organoids in the 32 wells, while small debris, such as dead cells, is excluded.
- Measure intensity and circularity for calculation of the indexes
- Select all structures ≥60 µm and count.
NOTE: This counts the organoids large enough to show morphology typical to either CF or non-CF. Organoids >40 µm and <60 µm are small and dense, both in non-CF and in CF. - Remove all structures touching the borders of the picture. Do this to remove organoids that are not completely visible, as their morphology cannot be accurately quantified.
- Erode 1 pixel (= 2.5 µm) from the border of each ≥60 µm structure. This removes the halo of diffused calcein fluorescence surrounding the organoids.
- Measure the mean intensity of each structure. This way, the mean fluorescence of the organoids is measured.
- Select all structures ≥60 µm again and remove all structures touching the borders.
- Erode 10 pixels (= 25 µm) from the border of each ≥60 µm structure.
NOTE: In non-CF organoids, this erodes the cellular border and leaves only the lumen. In CF organoids, this erodes the outer part of the organoid, which has roughly the same fluorescence as the inner part that remains. - Measure the mean intensity of each eroded structure. This way, the mean fluorescence of the central part of the organoids is measured.
- Measure the circularity of each structure. This corresponds to the mean circularity of the organoids.
- Select all structures ≥60 µm and count.
- Perform the second quality check: exclusion criteria determined by the software. Exclude the set of pictures when less than 50% of organoids (defined as structures ≥40 µm) are ≥60 µm, as enough organoids should be large enough to show morphology typical to either CF or non-CF. Also exclude when <500 or >3,000 organoids (defined as structures ≥40 µm) are present in the 32 wells.
5. Measure the indices in the imaging software (Figure 6)
- Measure the circularity index (CI).
NOTE: This corresponds to the mean circularity measured in step 4.6, which is the mean circularity of all organoids in all 32 wells. CI quantifies the roundness of the organoids, defined as , which is lower in CF than in non-CF organoids
 - Measure the intensity ratio (IR)
- Calculate the IR by dividing the mean of the intensity measurement after eroding 25 µm from the border of each ≥60 µm structure by the mean of the intensity measurement after eroding 2.5 µm from the border of each ≥60 µm structure.
NOTE: IR measures the presence or absence of a central lumen. IR is equal to , and is higher in CF than in non-CF organoids.
- Calculate the IR by dividing the mean of the intensity measurement after eroding 25 µm from the border of each ≥60 µm structure by the mean of the intensity measurement after eroding 2.5 µm from the border of each ≥60 µm structure.
- Simplify the analysis process
- Prepare a standard worksheet using spreadsheet software to automatically calculate these indices upon copying the data (Figure 7).
- To calculate the IR:
- Take the intensity measurement after eroding 2.5 µm from the border of each ≥60 µm structure. Use the mean for the calculation (denominator).
- Take the intensity measurement after eroding 25 µm from the border of each ≥60 µm structure. Use the mean for the calculation (numerator).
- To calculate the CI, take the circularity of all organoids in all wells. The mean corresponds to the CI.
NOTE: When analysis of large batches of images is required, the image analysis process as described in section 4 can be semi-automated, starting from the calibrated ND files and running a macro with all steps combined.
Organoids from 212 subjects were collected during routine clinical visits. No adverse events occurred during or after the rectal biopsy procedure. Organoids were imaged by one researcher blinded to subject characteristics such as genotype and clinical information. Due to low-quality images, 23 subjects were excluded. Examples of successful and failed organoid cultures and image acquisition can be seen in Figure 2.
Organoids of 167 subjects with CF and two disease-causing CFTR mutations (as defined by the CFTR2 database4) and 22 non-CF subjects were analyzed. The mean amount of organoids per culture was 1,519 (about 40-50 organoids per well). The mean amount of organoids per culture included for analysis was 77% (the number of structures ≥60 µm divided by the number of structures ≥40 µm, corresponding to the fraction of organoids large enough to reflect typical CF or non-CF morphology).
The IR and CI discriminated (p < 0.001) between organoids from subjects with and without CF (Table 1). With linear discriminant analysis, perfect discrimination (AUC = 1) was obtained between CF and non-CF, not only when using data from all 32 wells (Figure 8), but also when eight wells were chosen randomly for each culture (Figure 9).
Figure 10 depicts histograms showing the distribution of values for circularity, the intensity of the central part of the organoid, and the intensity of the whole organoid for four illustrative cultures (two CF, two non-CF).
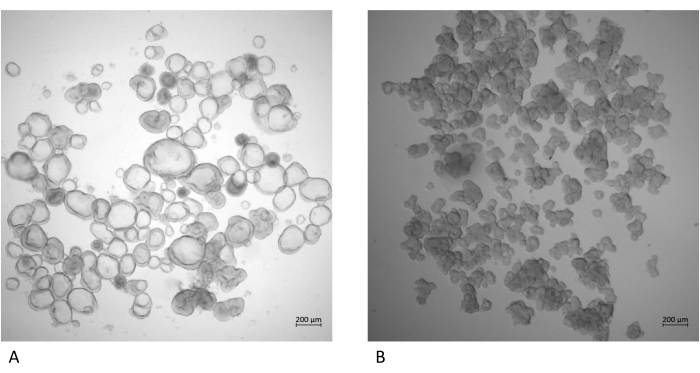
Figure 1: Images of well-grown and viable organoids. (A) Organoids from a person without CF and (B) organoids from a person with CF. Both cultures were grown for 7 days after the previous splitting. Images were made using a brightfield microscope with a 5x objective. Please click here to view a larger version of this figure.
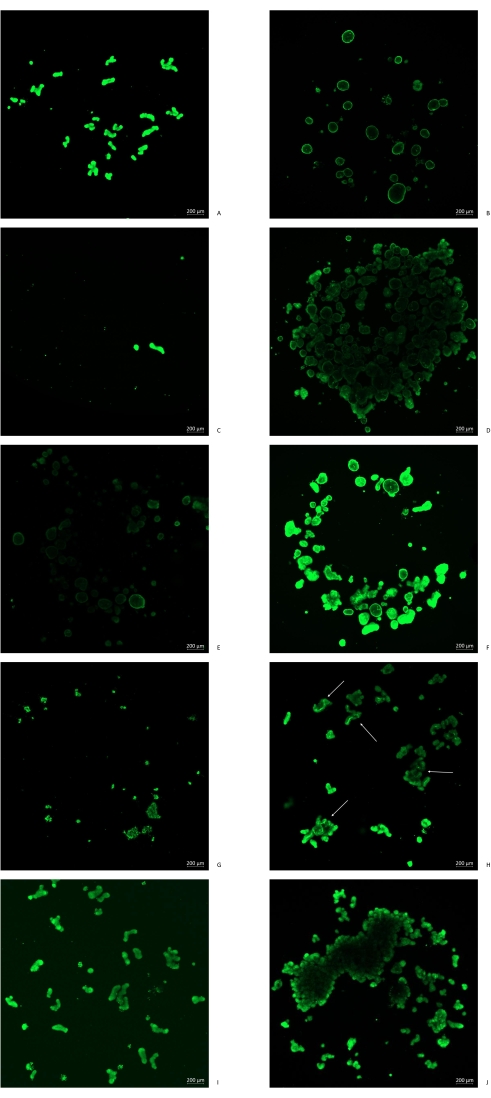
Figure 2: Illustration of organoid imaging in the confocal microscope. (A) Good quality CF organoids; (B) good quality non-CF organoids; (C) density of plating too low: not enough organoids for representative imaging; (D) density of plating too high: overlapping of organoids prevents adequate calcein staining and assessment of morphology; (E) intensity too low due to either a problem with calcein staining or the master gain setting being too low; (F) intensity too high due to the master gain setting being too high: small lumens may be masked by the overexposed fluorescence signal; (G) dead and burst organoids, where separate cells can be seen and morphology cannot be assessed anymore; (H) differentiated organoids where stem cell status is lost, showing up as thick structures often with high fluorescence signals in the middle of the organoid structures, not reflecting typical CF or non-CF morphology; (I) background signal too high, either due to calcein staining having been performed too long ago with diffusion into the background or due to the master gain setting being too high; (J) insufficient mechanical splitting of organoids, leaving them too big for the assay, not staining well, and not adequately reflecting CF or non-CF morphology. Please click here to view a larger version of this figure.
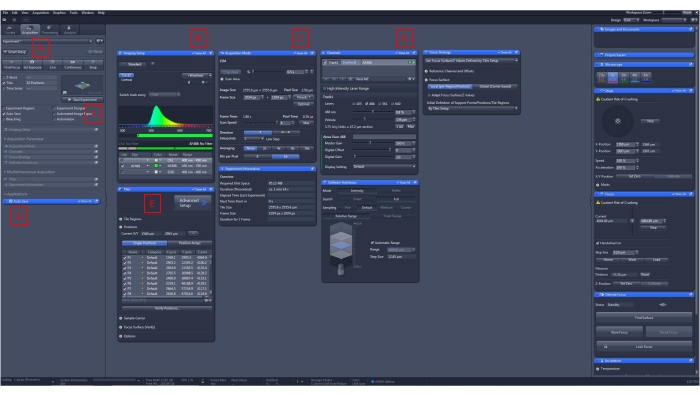
Figure 3: Focusing on organoids and acquiring pictures. (A) Choose the Acquisition tab. Click on the Live button below for real-time imaging. (B) Use live cell imaging settings with emission at 488 nm. (C) Image at a resolution of 1024 pixels x 1024 pixels and a depth of 16 bits per pixel. Choose the unidirectional imaging parameter. (D) Adjust the master gain for the optimal intensity of fluorescence to optimize imaging of organoid characteristics such as shape and presence or absence of a lumen. (E) Save single positions (x, y, and z) for each of the 32 wells per organoid culture. (F) Click on the Start Experiment button to run the pre-defined protocol and acquire images according to the parameters chosen. (G) Images can be saved upon completion, or an autosave can be set up with the Autosave button. Please click here to view a larger version of this figure.
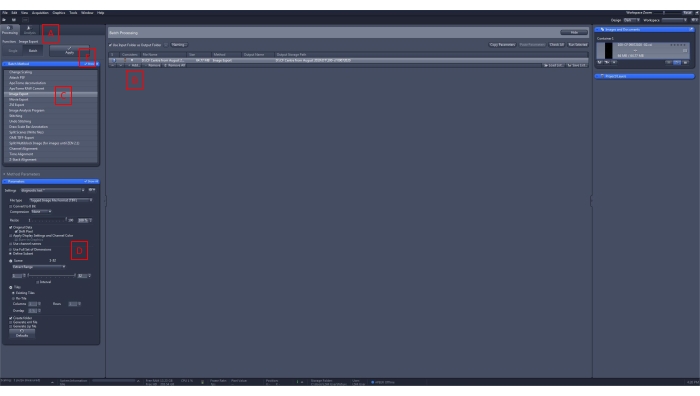
Figure 4: Exporting images for analysis. (A) Choose the Processing tab, and click on the Batch button to export images of multiple organoid cultures in one procedure. (B) Click on the Add button and select the saved images needed for analysis. (C) Select image export as the method. (D) Export images as TIFF files, do not convert to 8 bits, and do not compress or resize. Export original data without burn-in graphics. Select the 32 wells of the 96-well plate with the scene parameter. Do not re-tile. (E) Click on the Apply button to extract using the chosen parameters. Please click here to view a larger version of this figure.
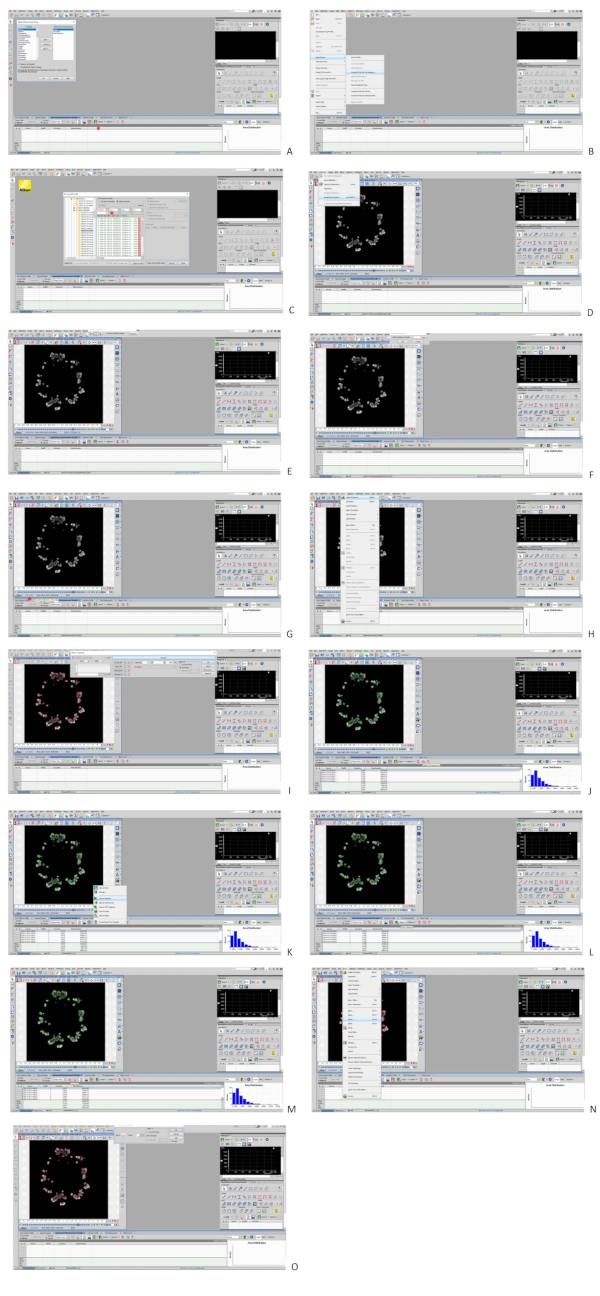
Figure 5: Analysis of organoid images in the imaging software. (A) Right-click the grey bar above the results section (red asterisk) to set up parameters for object measurement. Add circularity and mean intensity. (B) Click on File > Import/Export > Create ND file from file sequence to combine the TIFF files for one culture into one ND file. (C) Select the desired file and confirm; 32 pictures will be combined (red asterisk). (D) Click Recalibration > Recalibrate Document. (E) Click on Pixel Size in the pop-up window. (F) Input 2.5 µm as the size of 1 pixel. (G) The picture will now be recalibrated to micrometers instead of pixels (red asterisk). (H) Click Binary > Define Threshold. (I) Size selection can be performed in the pop-up window. The minimum size is 40 µm for organoid counting and 60 µm for organoid morphology analysis. Always turn off the Smooth and Clean function, turn on the Fill Holes function, and input Separate x3. Apply to all frames. (J) The software will show delineation of the defined structures. Click on the Update ND Measurement button to analyze and get the chosen parameters from step A as output. (K) Click the downward facing arrow next to the export button and select data to the clipboard. (L) Click on the Export button to copy the data output to the clipboard. Data can now be pasted to a spreadsheet. (M) Click on the Reset Data button to empty the results section before a new measurement is performed. (N) When erosion has to be performed for intensity measurement for calculation of the intensity ratio, click Binary > Erode. The Remove Objects Touching Borders function can be found in the same drop-down menu. (O) Select the matrix shown in the figure for erosion, and choose the desired count (1 pixel or 2.5 μm for removal of the halo surrounding organoids, 10 pixels or 25 μm for removal of the cellular border surrounding a lumen if present). Please see the Supplemental File for full-screen panels of this figure. Please click here to view a larger version of this figure.
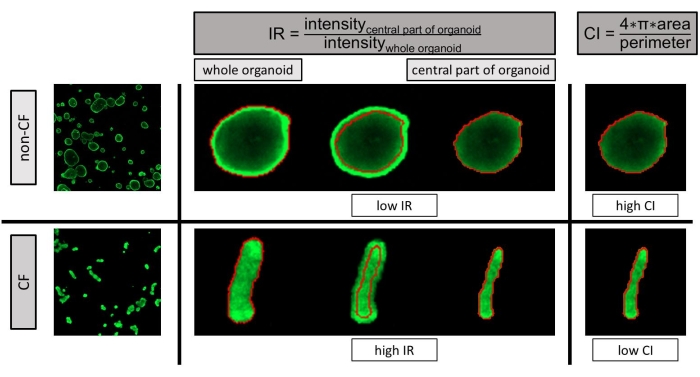
Figure 6: Images of rectal organoids from people without (upper panels) and with CF (lower panels). Illustration of the methods to calculate the two indexes, IR (intensity ratio; central panel) and CI (circularity index; right-hand panel), used to quantify morphological differences between rectal organoids of subjects with and without CF. IR measures the presence or absence of a central lumen, calculated in three steps: (I) calculate the global fluorescence intensity of the organoids: erode 1 pixel (2.5 μm) to remove the surrounding 'halo' around each structure, and measure the mean fluorescence intensity of the remaining whole organoid; (II) calculate the central fluorescence intensity of the organoids: erode 10 pixels (25 µm) around each structure to remove the cellular border from the organoids and measure the mean fluorescence intensity of the remaining structure; (III) IR is equal to , and is higher in CF than in non-CF organoids. CI quantifies the roundness of the organoids, defined as , which is lower in CF than in non-CF organoids. CF: cystic fibrosis; IR: intensity ratio; CI: circularity index. This figure has been reprinted with permission from Cuyx et al.13. Please click here to view a larger version of this figure.
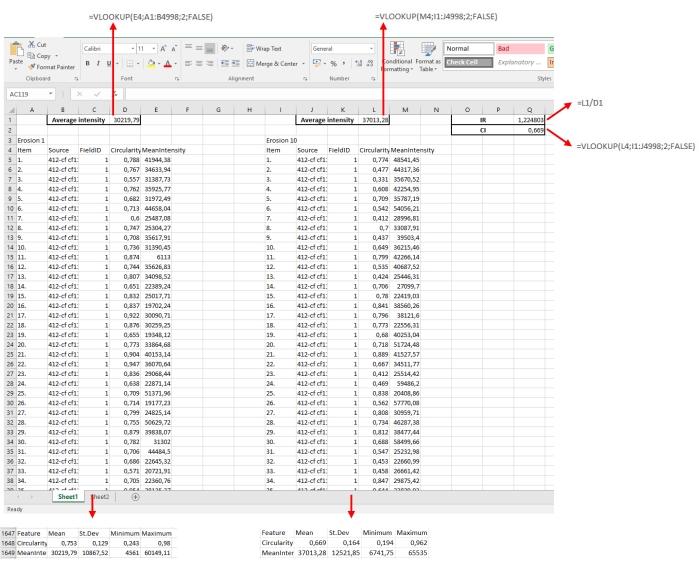
Figure 7: Example of a spreadsheet for calculation of CI and IR. The output (circularity and mean intensity, as defined in Figure 5) is copied into the spreadsheet for both erosion steps. The imaging software automatically adds the mean values for each parameter. These means can be copied into a cell of choice in the spreadsheet and then used for the calculation of CI and IR. Please click here to view a larger version of this figure.
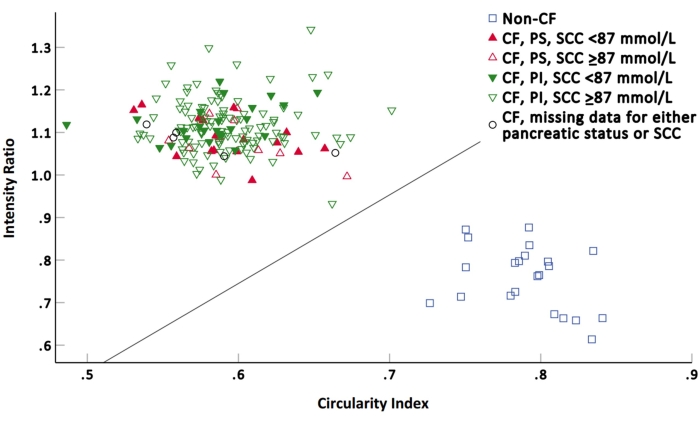
Figure 8: Intensity ratio (IR) and circularity index (CI) values of each subject according to disease status, pancreatic status, and sweat chloride concentration. The line represents the optimal discrimination line obtained by linear discriminant analysis. CF: cystic fibrosis; PS: pancreatic sufficient; PI: pancreatic insufficient; SCC: sweat chloride concentration. This figure has been reprinted with permission from Cuyx et al.13. Please click here to view a larger version of this figure.
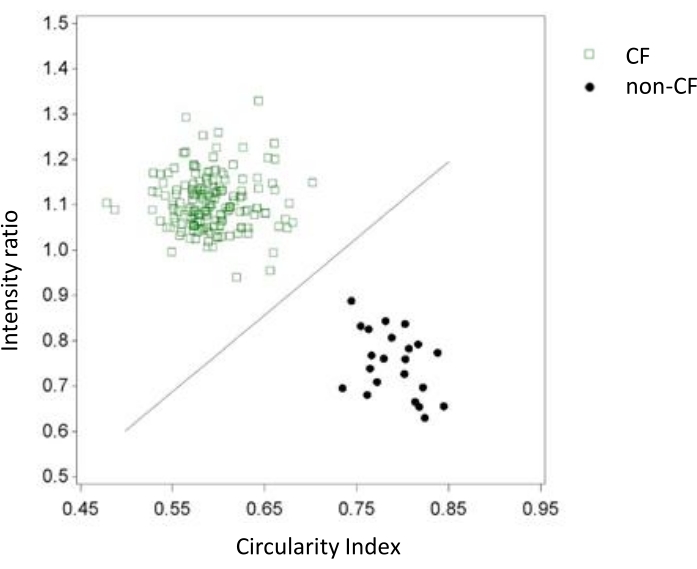
Figure 9: Calculation of ROMA indexes. Calculation of ROMA indexes using eight wells at random per subject and using the same statistical methodology was comparable to the results using 32 wells. Again, perfect discrimination was obtained. CI: circularity index; IR: intensity ratio. This figure has been reprinted with permission from Cuyx et al.13. Please click here to view a larger version of this figure.
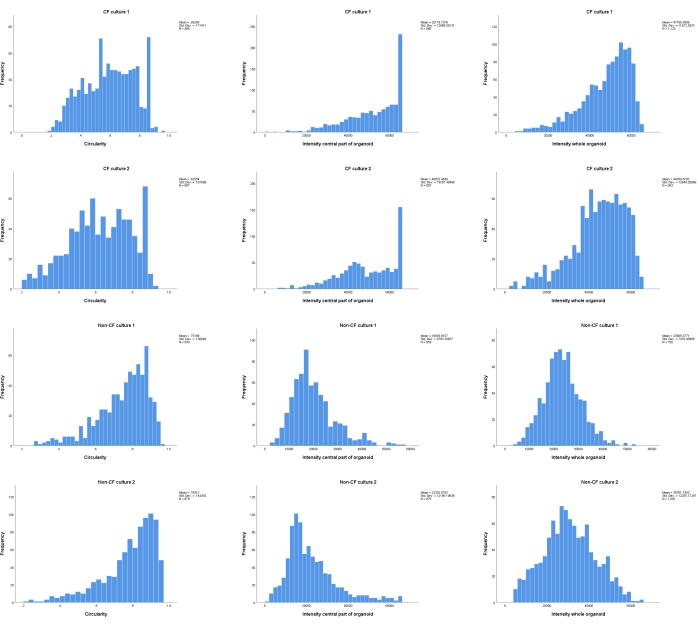
Figure 10: Histograms illustrating the distribution of values measured in each single organoid in a given culture. The circularity parameter, the intensity parameter for the central part of the organoid, and the intensity parameter for the whole organoid are depicted (columns). Results in two CF and two non-CF cultures are shown (rows). Please click here to view a larger version of this figure.
Supplemental File: Full-resolution presentation of Figure 5. Please click here to download.
| CF | Non-CF | p-value | |
| n | 167 | 22* | |
| IR | 1.11 (0.93–1.34) | 0.76 (0.61–0.88) | <0.001 |
| CI | 0.59 (0.49–0.70) | 0.79 (0.73–0.84) | <0.001 |
| Age (years) | 18 (0–60) | 44 (0–77) | <0.001 |
| Gender | 85 male (51%) 82 female (49%) |
11 male (50%) 11 female (50%) |
>0.999 |
| SCC (mmol/l) (n = 164) | 97.61 (36–160) | ||
| SCC low (<87 mmol/L) or high (≥87 mmol/L) | 41 low (25%) 123 high (75%) |
||
| Pancreatic status (n = 165) | 28 PS (17%) 137 PI (83%) |
Table 1: Baseline characteristics of the subjects and indexes calculated using rectal organoid morphology analysis (ROMA). n or mean and range. CF: cystic fibrosis; IR: intensity ratio; CI: circularity index; SCC: sweat chloride concentration; PI: pancreatic insufficient; PS: pancreatic sufficient. *seven carriers, three non-carriers, two autosomal dominant polycystic kidney disease, six ulcerative colitis, one polyp screening, three healthy controls included in a study about inflammatory bowel disease. This table has been reprinted with permission from Cuyx et al.13.
