Dynamic light scattering (DLS) has emerged as a suitable assay for evaluating the particle size and distribution of intravenously administered iron-carbohydrate complexes. However, the protocols lack standardization and need to be modified for each iron-carbohydrate complex analyzed. The present protocol describes the application and special considerations for the analysis of iron sucrose.
Intravenously administered iron-carbohydrate nanoparticle complexes are widely used to treat iron deficiency. This class includes several structurally heterogeneous nanoparticle complexes, which exhibit varying sensitivity to the conditions required for the methodologies available to physicochemically characterize these agents. Currently, the critical quality attributes of iron-carbohydrate complexes have not been fully established. Dynamic light scattering (DLS) has emerged as a fundamental method to determine intact particle size and distribution. However, challenges still remain regarding the standardization of methodologies across laboratories, specific modifications required for individual iron-carbohydrate products, and how the size distribution can be best described. Importantly, the diluent and serial dilutions used must be standardized. The wide variance in approaches for sample preparation and data reporting limit the use of DLS for the comparison of iron-carbohydrate agents. Herein, we detail a robust and easily reproducible protocol to measure the size and size distribution of the iron-carbohydrate complex, iron sucrose, using the Z-average and polydispersity index.
Iron sucrose (IS) is a colloidal solution comprised of nanoparticles consisting of a complex of a polynuclear iron-oxyhydroxide core and sucrose. IS is widely employed to treat iron deficiency among patients with a wide variety of underlying disease states who do not tolerate oral iron supplementation or for whom oral iron is not effective1. IS belongs to the drug class of complex drugs as defined by the Food and Drug Administration (FDA), which is a class of drugs with complex chemistry commensurate with biologicals2. The regulatory evaluation of complex drug products may require additional orthogonal physicochemical methods and/or preclinical or clinical studies to accurately compare follow-on complex drugs3,4. This is important because several studies have reported that the use of IS versus a follow-on IS product does not produce the same clinical outcomes. This underscores the criticality of the use of novel and orthogonal characterization techniques that are suitable for detecting differences in the physicochemical properties between IS products5,6.
The accurate elucidation of the size and size distribution of IS is of clinical importance, as particle size is a major influential factor in the rate and extent of opsonization-the first critical step in the biodistribution of these complex drugs7,8. Even slight variations in the particle size and particle size distribution have been related to changes in the pharmacokinetic profile of iron-oxide nanoparticle complexes9,10. A recent study by Brandis et al. showed that particle size measured by DLS was significantly different (14.9 nm ± 0.1 nm vs. 10.1 nm ± 0.1 nm, p < 0.001) when comparing a reference listed drug and a generic sodium ferric gluconate product, respectively11. The consistent batch-to-batch quality, safety, and efficacy of iron-carbohydrate products are entirely dependent on the manufacturing process scale-up, and potential manufacturing drift must be carefully considered9. The manufacturing process may result in residual sucrose, and this will vary based on the manufacturer12. Any modifications in the manufacturing process variables can lead to significant changes in the final complex drug product with regard to the structure, complex stability, and in vivo disposition9.
To assess drug consistency and predict the drug’s in vivo behavior, contemporary orthogonal analytical methodologies are required to determine the physicochemical properties of complex nanomedicines. However, there is a lack of standardization of methodologies, which can result in a high degree of interlaboratory variation in result reporting13. Despite the recognition of these challenges by global regulatory authorities and the scientific community14, most of the physicochemical characteristics of IS remain poorly defined, and the full complement of critical quality attributes in the context of available regulatory guidance documents have not been defined15. The draft product-specific guidance documents issued by the FDA for iron-carbohydrate complexes suggest DLS as a procedure to evaluate the size and size distribution of follow-on products16,17.
Several publications have detailed established DLS protocols to determine IS nanoparticle dimensions13,18. However, because the sample preparation, procedure conditions, instrumentation, and instrumentation setting parameters are different among the published methods, the DLS results cannot be directly compared in the absence of a standardized method to interpret the results13,18. The diversity in methodologies and data-reporting approaches limit the appropriate evaluation of these characteristics for comparative purposes19. Importantly, many of the DLS protocols previously published to evaluate IS do not account for the effect of the diffusion of sucrose in the suspension due to the presence of free sucrose, which has been shown to spuriously elevate the Z-average-calculated hydrodynamic radii of the nanoparticles in colloidal solutions13,18. The present protocol aims to standardize the methodology for the measurement of the particle size and distribution of IS. The method has been developed and validated for this purpose.
1. Operating the machine
The method described was validated according to ICH Q2(R1)20, which involved the measurement of test solutions under varying conditions. The precision was only 0.5% RSD for the Z-average size, while a maximum of 3.5% RSD was calculated for the PDI. The mean results from different analysts and days only differed by 0.4% for the Z-average size and 1.5% for the PDI. Statistics were calculated from 12 measurements performed by two analysts on varying days. Neither changes in the test concentration in the range of 50%-200% nor the storage of the test solutions for up to 5 days in refrigerated conditions had an impact on the final result.
Analyzed parameters
Z-average size
The hydrodynamic diameter is given as the Z-average particle size, and the method for determining this is defined in ISO 22412:201717. The Z-average size is a parameter also known as the cumulant mean. The Z-average is the preferred DLS size parameter, as the calculation of the Z-average is mathematically stable, and the Z-average result is insensitive to noise. According to the EMA and FDA, the Z-average size together with the PDI are the recommended values for the characterization of nanomedicines15,16,21. The Z-average particle size is only comparable with the size measured by other techniques if the sample is monomodal, spherical, or near-spherical in shape, is monodisperse, and is prepared in a suitable dispersant. This is because the Z-average mean particle size is sensitive to even small changes in the sample preparation. The Z-average particle size is a hydrodynamic parameter and is, therefore, only valid for particles in a dispersion or for molecules in solution.
Polydispersity index
This index is a number calculated from a simple two-parameter fit to the correlation data (the cumulant analysis). The polydispersity Index is dimensionless and scaled such that values smaller than 0.05 are rarely seen, except for in highly monodisperse standards. Values greater than 0.7 indicate that the sample has a very broad particle size distribution and is likely not suitable for the DLS technique. Various size distribution algorithms can function with data that fall between these two extremes. The calculations for these parameters are defined in the ISO standard document 22412:201717.
Size distribution by intensity/volume/number
Typical size distribution plots (intensity, volume, number) are depicted in Figure 1. The result plots show six independently prepared samples of IS batch 605211 at a concentration of 0.4 mg Fe/mL. For the visualization in Figure 1, the raw data taken from the DLS software were plotted with statistical software without further modification9. A size distribution by intensity impacted by a second peak is provided as an example of a bad result in Figure 1A. Figure 2 displays poor-quality data showing an additional signal at 5,000 nm.
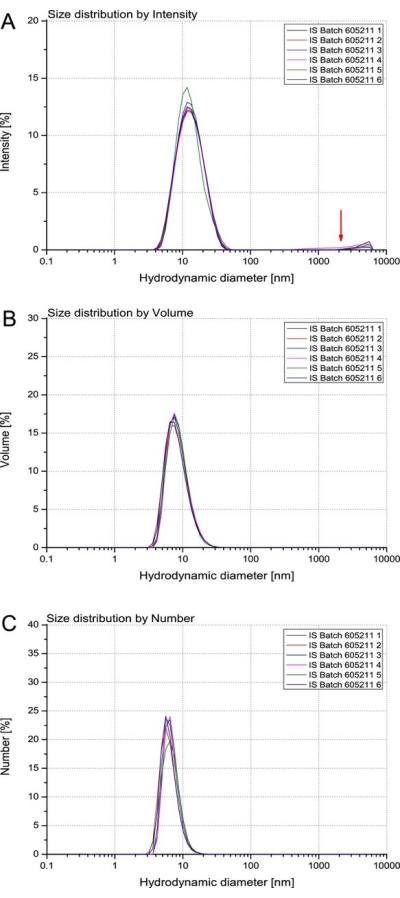
Figure 1: Size distribution. (A) intensity, (B) volume, and (C) number13. Please click here to view a larger version of this figure.
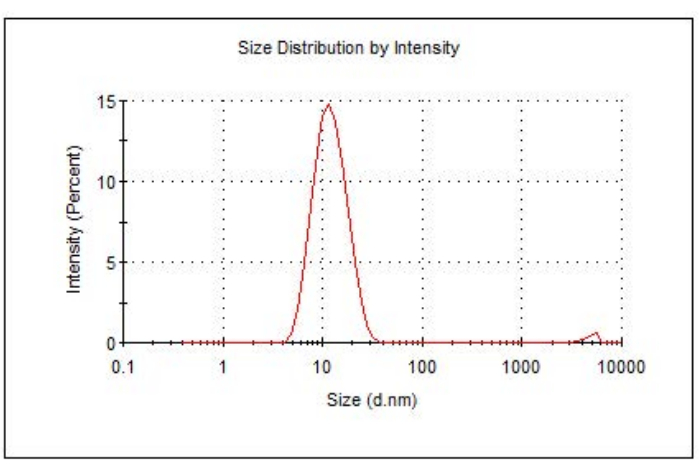
Figure 2: Representative poor-quality data. Please click here to view a larger version of this figure.
The test solution of IS batch 0371022A (0.4 mg Fe/mL), which was stored for 5 days at room temperature, showed an additional signal at ~5,000 nm, which is indicative of some additional particles (e.g., either dust or precipitation). Accordingly, the PDI originally determined at 0.130 was shifted to 0.184, while the Z-average was still close to the original value (i.e., 11.33) at 11.99 nm (unpublished data).
Precision was tested by two lab technicians on separate days. The mean value of 12 replicates was 11.32 nm with an RSD of 0.4% and 0.125 with an RSD of 1.5% for the Z-average and PDI, respectively, for the two technicians. The acceptance criteria were met (NMT 5% for the Z-average, NMT 20% for the PDI) (unpublished data).
Comparison of analyzable parameters
In addition to calculating the basic parameters-the Z-average and polydispersity-the software of the DLS device also allows the calculation of size distributions that can be weighted according to the intensity of the detector signal or the volume (or number) of scattering particles. The relevance of comparing these parameters is obvious in the results outlined in Table 2. While the size distribution by number differed by up to a factor of 2 from the proposed intensity-based Z-average, only slightly lower values were calculated by the size distribution by volume. It should be noted, however, that intensity-based result reporting may be inaccurate if the iron-carbohydrate complex solutions contain larger particles or aggregates13.
Table 1: System parameters for the DLS. Abbreviations: RI = refractive index; DLS = dynamic light scattering13. Please click here to download this Table.
Table 2: Examples of how particle size determination by IS is affected by the data reporting approach. This table is adapted from Di Francesco and Borchard13. Abbreviations: SD = standard deviation; RSD = relative standard deviation; PDI = polydispersity index; IS = iron-sucrose. Please click here to download this Table.
Supplemental Figure S1: System operating steps. Please click here to download this File.
Supplemental Figure S2: Creating a measurement file. Please click here to download this File.
Supplemental Figure S3: System suitability test. Please click here to download this File.
Supplemental Figure S4: Starting a new measurement. Please click here to download this File.
Supplemental Figure S5: Calculation of measurements. Please click here to download this File.
DLS has become a fundamental assay for the determination of the size and size distribution of nanoparticles for applications in drug development and regulatory evaluation. Despite advances in DLS techniques, methodologic challenges still exist regarding the diluent selection and sample preparation, which are especially relevant for iron-carbohydrate complexes in colloidal solutions. Importantly, DLS methods for iron-carbohydrate nanomedicines have not yet been studied extensively in the biological milieu (e.g., the plasma)22. Therefore, there still remains a critical need for the harmonization of best-practice protocols depending on the diluent selection. The selection of the diluent is important, as using purified water versus isotonic saline solutions may affect the colloidal suspension's stability16.
It should also be noted that iron-carbohydrate complexes should not be diluted below the prescribing information recommendations in an effort to mitigate the challenges of having a dark, opaque solution. Excessive dilutions are not biorelevant and can affect the colloidal suspension's stability via changes in ionic shielding, which can lead to potential precipitation and inaccurate result reporting. Various dilutions and diluents (unpublished data) were tested during the development of this method, and the sample preparation described in step 1.6.1 of the protocol was determined and validated as the optimal dilution for IS. Several modifications must be considered for the DLS analysis of iron-carbohydrate complexes. For example, the preparation of test solutions needs to be performed in the absence of any kind of high-speed agitation. The use of vortex mixers should be avoided, as this induces the creation of iron-sucrose aggregates. For the preparation of test solutions, IS solutions are gently mixed in water with an automatic pipette. Additionally, when running the samples for DLS analysis, the automatic calibration feature should be turned off.
There are several inherent limitations of DLS analysis for iron-carbohydrate nanoparticles. Due to the nature of the light scattering angles and the Z-average output, the hydrodynamic diameters reported are biased toward larger particles in the measuring solution. Thus, the particle size may be overestimated, and the true distribution of the particle size may be underestimated13. Reporting result techniques should be considered in the context of how large the iron-carbohydrate complex particles are and the potential for aggregation under the experimental conditions. It should also be taken into account that the results of the intensity-, volume-, and number-weighted size distributions may differ greatly between different DLS units from the same or different manufacturers, as different manufacturers use different algorithms for the calculation. Therefore, ISO22412 only recommends the use of the Z-average and polydispersity, as the algorithm for their calculation is standardized. Regulatory agencies have also recommended Z-average size reporting16. It should also be noted that minor modifications will be required (e.g., the handling of the software, measuring procedure, and data preparation) when this protocol is applied to other instruments.
Even in light of the challenges associated with DLS, this technique represents a significant advancement on previous analytic methodologies and adds compelling data to the characterization of iron-carbohydrate complexes. It has been endorsed by scientist collaboratives and regulatory agencies16,18,19,21. Future efforts in applying DLS analysis to iron-carbohydrate complexes should most importantly focus on the global harmonization of protocols for their application to drug development and regulatory evaluation, including ensuring bioequivalence. Overall, the analytical protocol here described aims to standardize the methodology for the measurement of the particle size and distribution of IS and can be a useful tool for the evaluation of the quality of IS.
The authors have nothing to disclose.
None
Equipment | |||
Zetasizer Nano ZS | Malvern | NA | equipped with Zetasizer software 7.12, Helium Neon laser (633 nm, max. 4 mW) and 173° backscattering geometry |
Materials | |||
Disposable plastic cuvettes | |||
LLG-Disposable plastic cells | LLG labware | LLG-Küvetten, Makro, PS; Order number 9.406011 | |
low-particle water | (The use of freshly deionized and filtered (pore size 0.2 μm) water is recommended). | ||
Microlitre pipette | |||
Venofer 100 mg/5 mL | Vifor Pharma | ||
Volumetric flask 25 mL | |||
Nanosphere | Thermo | 3020A | Particle Standard |
Software | |||
Origin Pro v.8.5 | Origin Lab Corporation |