JoVE Science Education
Chemical Engineering
Un abonnement à JoVE est nécessaire pour voir ce contenu.  Connectez-vous ou commencez votre essai gratuit.
JoVE Science Education Chemical Engineering
The Effect of Reflux Ratio on Tray Distillation Efficiency
  • 00:07Vue d'ensemble
  • 00:58Principles of Distillation
  • 03:35Distillation Column Operation: Adjusting the Reflux
  • 06:20Transitioning to Finite Reflux Mode
  • 08:25Résultats
  • 09:52Applications
  • 10:54Summary

환류비가 트레이 증류 효율에 미치는 영향

English

Diviser

Vue d'ensemble

출처: 케리 M. 둘리와 마이클 G. 벤턴, 화학 공학부, 루이지애나 주립 대학, 배턴 루지, LA

트레이와 포장된 컬럼은 모두 증류, 흡수 및 분리 작업에 일반적으로 사용됩니다. 1,2 이 실험의 목적은 체 트레이 열에 알코올(메탄올, 이소프로판올) 및 물의 혼합물을 증류하고 평형 가정에 근거한 증류의 간단한 이론이 얼마나 밀접하게 뒤따르는지 검사하는 것이다. 체 트레이는 액체와 증기 사이의 최대 얼굴 간 영역을 제공합니다. 체 트레이의 P&ID 회로도(각 트레이에는 지지판에 구멍이 들어 있음) 증류 시스템은 부록 A에서 찾을 수 있습니다.

이 데모에서는 트레이 증류 장치(TDU)가 총 역류 모드에서 시작됩니다. 꾸준한 역류 드럼 레벨이 달성된 후, 역류 드럼및 재보일러에서 일정한 수준을 유지하고, 목표 역류 비율 RD = L/D를 유지하기 위해 필요에 따라 바닥, 증류 및 역류 유량 컨트롤러를 조정하여 유한역 모드로 전환한다. 정상 상태가 달성되면 (최소 90 분 소요), 액체 샘플은 역류 드럼, 재보일러 및 각 트레이에 가져와 가스 크로마토그래프로 분석됩니다. 일반적인 프로토콜은 광범위한 역류 비율의 효과를 조사하는 것입니다. 샘플 분석에서 트레이 효율은 일정한 어금니 오버플로(McCabe-Thiele 메서드)를 가정하는 6개의 트레이 모두에 대한 세 가지 구성 요소에 대해 결정될 수 있습니다. 가능한 경우 평형 공정 시뮬레이터를 사용하여 결과를 시뮬레이션할 수도 있습니다. 이 두 가지 방법을 사용하여 전체 트레이 효율을 결정할 수도 있습니다. 또한 질량 저울의 데이터 조정을 수행하여 총 측정 오류가 있는지 확인할 수 있습니다. 모든 분리 또는 단위 운영 교과서는 역류 비율, 머프리 효율성 및 McCabe-Thiele 방법 및 다이어그램과 같은 기본 개념을 포함하여 증류의 기초를 다룹니다. 2

Principles

Procédure

TDU는 분산 제어 시스템의 컴퓨터 인터페이스에서 작동합니다. 인터페이스는 완전히 그래픽입니다. 열에는 트레이 6개, 총 응축기 및 부분 재보일러(부록 A)가 포함되어 있습니다. 상기 혼합물은 사료 저장소에 함유되어 있으며, 사료는 명목상 메탄올(~50wt.%), 이소프로파놀(~30wt.%), 물(~20wt.%) 으로 구성된다. 1. 총 역류 모드 시작 냉각수를 켭니다. 재보일러 액체 수준이 너…

Résultats

The appropriate response factor (RFi) for each component, which is the ratio of the signal intensity to the quantity of analyte injected and is provided in the software, is used to determine the wt% of each sample.

Equation 3 (3)

Reflux ratio (RD = L/D) has a tremendous effect on both column tray efficiencies (at constant feed and distillate rates) and on the composition of the distillate and bottoms. A lower reflux rate greatly reduces the methanol purity of the distillate. Therefore, a tray distillation apparatus operating at a greater reflux rate but constant distillate and bottoms rates will be more efficient for separation. However, additional reflux increases operating costs by adding additional more heating (reboiler) and cooling (condenser) costs.

Murphree liquid efficiencies were calculated at an intermediate RD from the liquid sample compositions for all six trays using equilibrium data to find xn*. For these computations, the constant molar overflow assumption on the vapor and liquid rates in each section was applied. A representative McCabe-Thiele plot of these calculations is shown in Figure 1. A saturated liquid feed (q = 1) was assumed, as the feed was heated to close to its bubble point. The actual feed, distillate and bottoms mole fractions were 0.53, 0.76 and 0.39, respectively. The predicted number of equilibrium stages is ~4. The actual number of trays is 6+1 = 7, so the overall column efficiency is ~57 %. Referring back to Equation (2), a mass balance block in a process simulator could be used to compute the yn's from the xn's. Then a bubble point or flash block could be used to determine the xn* values from the yn's.

Figure 1
Figure 1: Pseudo-binary McCabe-Thiele construction (methanol mole fractions only) for a distillation at F = 2.12, D = 1.19 and R = 1.45 gmol/min (RD = 1.2), feed to tray 3.

The trends in the Murphree efficiencies can be explained in terms of what is generally known about sieve tray efficiencies, especially about mass transfer rates and entrainment on sieve trays. For a glass column, it is easy to observe where the liquid flow rate is too low (an almost "dry" tray) or too high (entrainment of liquid). Either condition may be attributed to low tray efficiencies.

There is a range of Murphree efficiencies, the lower efficiencies being related to slow mass transfer rates or weeping ("dry" tray) or liquid entrainment in the vapor, or some combination of these (Table 1). Depending on the position of the tray, if it's at the top, there could be entrainment, or weeping at the lower trays. At the conditions of Table 1, Tray 2 was significantly more efficient than its counterparts, and visual observation showed it to be very frothy, so high in interfacial area. Tray 1 was even more frothy, but some entrainment could be observed. This behavior is a consequence of a low surface tension for an alcoholic mixture; on the top two trays, almost all the water had been removed, leaving behind mostly methanol with some isopropanol. The tray below it shows only 18% methanol efficiency; such a poor efficiency is sometimes found when a different compound (here, water) undergoes a profound concentration change on the tray.

Table 1: Liquid-Phase Murphree Tray Efficiencies, Methanol1

Tray Number (from top) XM

mole fraction

YM

mole fraction

XM*

mole fraction

EML
0 (distillate) 0.76
1 0.69 0.76 0.61 43
2 0.58 0.70 0.54 74
3 0.56 0.64 0.48 18
4 0.53 0.63 0.47 33
5 0.51 0.61 0.44 29
6 0.49 0.57 0.40 29
7 (bottoms) 0.39 0.55

1Conditions same as for Figure 1.

The experimental results were also simulated using NRTL thermodynamic (activity coefficient) parameters and an equilibrium simulator with a constant average tray efficiency that roughly reproduces measured compositions (bottoms, distillate, feed). The average column heat loss is ~400 W, and was incorporated into the simulation as a measured variable. As seen in Figure 2, assuming 100% efficiency (perfect equilibrium on all trays) captures the qualitative but not quantitative column behavior with respect to increasing vapor flow rate. The same should be true upon variation of the reflux ratio.

Figure 2
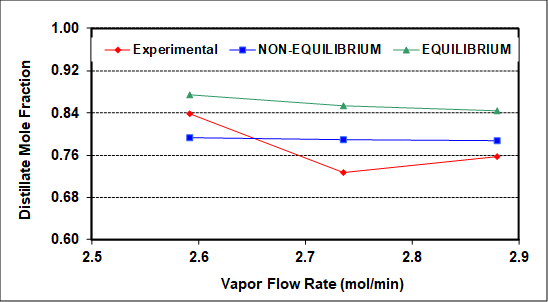
Figure 2: Experimental and simulated distillate compositions as a function of the rectifying section vapor rate (L + D). F = 2.12 gmol/min, RD = 1.2, feed to tray 3.


Figure 2 compares experimental distillate compositions (vs. vapor rate to the condenser) to the predicted results of equilibrium and non-equilibrium simulations of this column. The goal of the simulations was to match both distillate and bottoms compositions as closely as possible. The non-equilibrium simulator gives better predictions because it assumes and then calculates finite rates of mass transfer. Neither simulation can capture the exact behavior, possibly because neither accounts for entrainment, which as mentioned was clearly seen on the top two trays. There may also be slight experimental errors (especially for the middle experimental point), because no theory predicts a minimum at an intermediate vapor rate. Among possible causes of experimental error, it is difficult to measure accurately the low reflux flow rates with the turbine meter on the reflux stream.

Applications and Summary

Tray distillation columns are often of the sieve type, with small holes for the vapor flow and larger downcomers to route the liquid from tray to tray by gravity. More volatile components mostly exit in the distillate, although some of the top vapor is condensed and returned to the column as liquid reflux. It was shown that determining the Murphree tray efficiencies can be important in pinpointing problems on specific trays in distillation columns, such as low mass transfer rates, weeping or flooding. While higher vapor/reflux rates (higher RD) can improve mass transfer rates and eliminate weeping, if they are too high, the tray efficiencies will decrease due to liquid entrainment. In a previous experiment, it was observed (Figure 2) that any benefits of higher vapor rates were offset by the increased entrainment on the upper trays. This is because the experimental distillate mole fraction of the light component methanol actually decreased slightly with respect to vapor rate. Of course, at low RD, even equilibrium calculations, such as the McCabe-Thiele method, predict poorer component separation. Therefore, data taken at varying reflux ratio may show more variation in the distillate composition.

One common application of plate distillation is in oil refining. Many oil refineries use tray distillation to separate crude into multiple products. Typically the first major pieces of equipment in an oil refinery are the crude stills (usually one at atmospheric pressure and one or more operating under vacuum), which separate crude into LPG (liquefied petroleum gas, mostly propane-butanes), naphtha (which can be reformed to gasoline), kerosene (jet fuel), diesel and medium and heavy gas oil. The atmospheric boiling points on these fractions vary from ~30 – 400 °C.3 Other distillations are used to further refine the products.4 Chemical engineers working on these processes focus on obtaining the desired product mix and optimizing tray efficiencies.

Tray distillation columns are also used to distill ethanol.5 Through closely related processes, a variety of products such as fuel-grade ethanol, beer, and liquor can all be distilled (thus the name "distillery").5 While the ethanol/water separation is the most important, heavier fermentation products will also be removed in the bottoms. At atmospheric pressure, the distillate is limited to the azeotropic composition (95.5 wt% ethanol at 78.1°C). Further distillation requires a separate type of distillation known as azeotropic distillation, although further ethanol/water separation is possible using either an extraction agent or a good vacuum.5

The separation of air into N2, O2, Ar etc. requires cryogenic distillation.6 The air must be cooled below the critical temperature of O2 (-119 °C at 5.04 MPa) to obtain a liquid phase. Upon distillation the O2 is mostly in the bottoms and the N2 in the distillate. Either can then be shipped either in gas (pipeline) or liquid (refrigerated tankcar or truck) forms.6 Argon is the only other component of air commonly separated to obtain an almost pure product.

APPENDIX A

Figure 3
Figure 3. P&ID schematic of the Scott distillation system

References

  1. Encyclopedia of Chemical Engineering Equipment. Distillation Columns. http://encyclopedia.che.engin.umich.edu/Pages/SeparationsChemical/DistillationColumns/DistillationColumns.html. Accessed 10/01/16.
  2. W.L. McCabe, J.C. Smith, and P. Harriott, Unit Operations of Chemical Engineering, 7th Ed., McGraw-Hill, New York, 2005, Ch. 21 & 22, C.J. Geankoplis, Transport Processes and Unit Operations, 3rd Ed., 1993, Ch. 12, or J.D.Seader, E.J. Henley, D.K. Roper, Separation Process Principles, 3rd Ed., Wiley, 2010, Ch.6 & 7.
  3. Processing & Refining Crude Oil. Chevron Inc. http://pascagoula.chevron.com/abouttherefinery/whatwedo/processingandrefining.aspx . Accessed 10/01/16.
  4. A Simple Guide to Oil Refining. ExxonMobil Inc. http://www.exxonmobileurope.com/europe-english/files/simple_guide_to_oil_refining.pdf  Accessed 10/14/16.
  5. R. Katzen, P.W. Madson and G.D. Moon Jr, Ethanol distillation: the fundamentals, in The Alcohol Textbook 3rd ed., K. Jacques, T.P. Lyons, and D.R. Kelsall, eds. Nottingham University Press, Nottingham, UK, pp. 269-288 (1999).
  6. History and Technological Progress: cryogenic Air Separation. The Linde Groups. https://www.linde-engineering.com/internet.global.lindeengineering.global/en/images/AS.B1EN%201113%20-%20%26AA_History_.layout19_4353.PDF. Accessed 10/01/16.

Transcription

Tray distillation is a crucial chemical engineering technique used to separate compound mixtures in various industrial settings. Such as chemical plants, oil refineries, and natural gas processing. Distillation is performed in a column with many different levels called trays. A liquid feed stream travels through the column and after exposure to heat is either condensed or vaporized, enabling the mixture to be separated based on the difference in volatilities. In order to design a cost-productive distillation apparatus the separation efficiencies of the trays in the system are studied. Here we will investigate the separation efficiency of a Sieve tray column used to separate a mixture of methanol, isopropanol, and water.

In a distillation column, the liquid feed is introduced and it flows downward while simultaneously contacting a rising vapor stream. When the liquid reaches the bottom it enters a re-boiler and is either vaporized and re-enters the column or remains liquid and exits the system. This exiting stream, called the bottoms, contains the heavier components. The boil up ratio VB, is the ratio of liquid recycled into the column to the amount of liquid leaving in the bottoms. The vapor stream flows upward through the column and is condensed before entering a reflux drum. It is then split into two streams. The distillate containing the more volatile components which exit the system, and the reflux stream which is cycled to the column. The reflux ratio, which is the ratio of reflux rate to distillate rate can influence separation efficiency. In total reflux mode, 100% of the streams are recycled back into the column. However, practical distillations are operated in partial reflux mode to achieve economic separation. Now let’s take a look at the McCabe-Thiele analysis to determine the number of stages needed for a separation using VLE data for the two components. Starting from the distillate composition, draw an operating line with slope equal to RD over RD plus one. Starting from the bottoms composition draw an operating line with slope equal to VB plus one over VB. Step down the plot between the BLE curve and operating lines until the bottom is reached. The number of steps minutes one for the reboiler is equal to the number of trays needed. To evaluate efficiency, the Murphree Method is used. The Murphree efficiency for a single tray, EML, describes the change of the liquid composition over the tray divided by the change off the exiting liquid composition, assuming it was in equilibrium with the exiting vapor. Low efficiencies on a tray are often associated with low interfacial area or low superficial velocities, enabling engineers to pinpoint problems in a column and improve design. Now that we’ve discussed how a distillation column works and how the reflux ratio can affect the separation, let’s test and demonstrate the effects in a laboratory experiment.

Before you start, familiarize yourself with the tray distillation unit. The unit consists of a column containing six sieve trays. The feed reservoir contains the mixture of methanol 50 weight percent, isopropanol 30 weight percent, and water 20 weight percent. Which is directed via a pump to the feed preheater and then to the column. The distillate from the column is collected in the total condenser equipped with a valve to collect the samples. A reflux drum, reflux pump, and preheater are used to provide a continuous reflux of which the ratio is adjusted for a better efficiency. Lastly, the reboiler and bottoms pump provide heating of the mixture and the bottoms valve is used to obtain the samples for analysis. The majority of the trade distillation unit is operated using a graphical interface. To start the experiment for the total reflux mode, turn on the cooling water and check the level of the reboiler liquid. Adjust the level by either adding feed liquid or removing some liquid using the bottom pump. Turn on the main reboiler heater and the strip heater. Then, via the controls, set the reboiler temperature controller to manual and adjust the output to at least 60%. And wait for the overhead vapor to condense, filling the reflux drum. Once the reflux drum has reached a level of 50%, set the reflux flow controller I auto with a set point of 20% and turn on the reflux pump. As soon as you measure the reflux flow on the controller, gradually decrease the set point in 2% increments every 20 to 30 seconds until the reflux flow rate is 12 to 13% of span. When the reboiler heater was activated, the system also started the reflux preheater. Now set the controller in auto and give the reflux preheater a set point of approximately 65 degrees Celsius. Make sure that the reflux drum level is around 50%, and if necessary manually adjust the rate by changing the set point on the reflux flow controller to provide a constant reflux drum level of 25 to 75%. When all flows, levels, temperature, and compositions are close to their set points and aren’t changing significantly for approximately two minutes, one can say that steady state of the total reflux mode has been achieved.

Now that the system has reached a steady state, let’s transition to the finite reflux mode. Set the feed flow controller to auto with a set point of approximately 120 cubic centimeters per minute. Next turn on the feed pump and the feed preheater, set the controller in auto, and give it a set point of approximately 65 degrees Celsius. Once the feed settings are set, put the reflux flow rate controller in auto and set the starting point of the reflux flow to a set point of approximately 80%. Start withdrawing the distillate product to maintain the reflux drum level between 25 and 75%. Put the distillate flow controller in auto and adjust it’s set point above zero flow. Start withdrawing the bottoms product to maintain a constant level of 60 to 80% in the reboiler. Put the bottoms flow controller in auto, turn on the bottom pump, and adjust the set point to a flow rate above zero. Repeat the finite reflux operation at approximately three different reflux ratios while keeping the boil up rate constant. This is carried out to adjust to different steady states in the finite reflux mode. When all flows, levels, temperature, and composition are close to their set points and are not changing significantly, then stead state is reached. Once a stead state is reached, open the sample valves and use sample bottles to collect one set of three to four milliliter samples of the bottoms and distillate products at their respective sample points. Using a pipette, insert it through the top of the feed tank to collect a feed sample. Next, using a curved needle syringe, insert it through the septum port of each tray to acquire tray samples. Secure the samples and analyze them using a gas chromatograph after the experiment is finished.

Now that you have finished the experiment, let’s focus on analyzing the results. The McCabe-Thiele analysis for this system shows that 4.5 stages are needed for the separation. Though the system utilizes six stages plus the reboiler. Next, obtain the mass fraction of the samples using the GC data. Apply the Murphree tray efficiency equation and calculate the efficiency of each tray. Tray two was significantly more efficient than its counterparts and visual observation showed it to be very frothy. So high in interfacial area. Tray one was even more frothy, but some entrainment could be observed. This behavior is a consequence of a low surface tension for an alcoholic mixture. In the top two trays, almost all of the water had been removed, leaving behind mostly methanol with some isopropanol. Tray three had poor methanol efficiency, which is observed when a different compound, water in this case, undergoes a profound concentration change on the tray. Now repeat the calculations for each reflux ratio to determine the effect on the composition of the distillate and bottoms. In general, the lower reflux rate reduces the methanol purity of the distillate. A higher reflux rate improves the separation at high operating costs.

Lastly, let’s take a look at a couple applications of trade distillation and measuring tray efficiencies in the chemical industry. Oil refineries separate crude oils into multiple products. The feed stream is heated crude oil at atmospheric pressure. Fuels, such as fuel oil for ships, diesel, kerosene, naphtha, and gasoline are separated based on their boiling points and thus chain length. Chemical engineers use tray efficiencies to optimize the separation processes of the desired products. To generate distilled spirits such as vodka or whiskey, a mixture of grain fermentation products known as wash, which is 10 to 12% alcohol by volume is boiled in a still and the resulted vapor is separated by simple or trade distillation. This allows the ethanol to be separated from other alcohols like propanol and water, which have higher boiling points.

You’ve just watched Jove’s introduction to distillation. You should now understand the distillation process, how to operate a tray distillation unit, and how to evaluate its efficiency. You have also seen several applications of distillation in industrial settings. Thanks for watching.

Tags

Cite This
JoVE Science Education Database. JoVE Science Education. The Effect of Reflux Ratio on Tray Distillation Efficiency. JoVE, Cambridge, MA, (2023).