1. Ultrasound and MRI Setup
An MRI-compatible three-axis focused ultrasound system was used in this study (FUS Instruments, Inc., Toronto, Ontario, Canada). Two different ultrasound transducers were used: an in-house constructed 551.5 kHz spherically-focused transducer (radius of curvature = 60 mm, external diameter = 75 mm, internal diameter = 20 mm), and a 1.503 MHz, 8-sector array with integrated PZT hydrophone (Imasonic Inc., Voray-sur-L’Orgnon, France) driven as a single element spherically focused transducer (FN = 0.8, aperture = 10 cm). An MRI-compatible PVDF receiver8 was used to record acoustic emissions when the 551.5 kHz transducer was used. If different equipment is used, the following are suggested:
- Select an appropriate, calibrated ultrasound transducer with a center frequency in the range 0.25 MHz -1.5 MHz and an f-number (radius of curvature/aperture) of 1 or less.
- Place a water bath filled with warm, degassed, de-ionized water on the bed of a 1.5 T or 3 T MRI. The water bath should have a top-plate which can hold the animals. Mount the ultrasound transducer in the tank on an MRI compatible three-axis positioning stage or system9, facing the water surface.
- Run the transducer cable to the ultrasound driving equipment through a penetration panel.
- Generate the transducer driving signal using a function generator and power amplifier. Use an external matching circuit to minimize the reflected electrical power.
- Knowing the transducer focal length, place the transducer focus at the water surface and sonicate the water surface to generate a visible water fountain. Steps 1.6 and 1.7 describe how to register the focus using the generated water fountain. A more precise method for locating the focus, which involves sonicating a heat absorbing gel and imaging the resulting temperature elevation at the focus with MRI, can be found in9.
- Mark the location of the focus using a marker that will be visible on the MR images. This can be done using a plate with a center hole that will fill with water when placed over the focus. The water-filled hole will be visible on the MRI and will provide focal coordinates in two planes, while the coordinate in the axial direction of the transducer can be determined from the water surface.
- Using a 3-plane localizer sequence, image the focus marker and record the location of the focus in the MRI coordinate system.
- To monitor acoustic emissions, mount an MR-compatible hydrophone8 that is used as a passive cavitation detector (PCD) in the water bath directed at the transducer focus, or use a transducer with integrated hydrophone.
- Run the PCD cables to a scope card that is sufficiently fast to capture bursts of up to 10 ms at PRFs up to 2 Hz (e.g. ATS460, AlazarTech, Pointe-Claire, Quebec, Canada). Cables must be grounded to the penetration panel or RF shield to minimize noise.
2. Animal Preparation
- Anesthetize the animals using isofluorane gas. Since isofluorane has an effect on BBB disruption10, the animals should be taken off the gas 10 minutes prior to the start of the experiment. Place ocular lubricant ointment in each eye at the start of anesthesia to protect the cornea from desiccation or other injury.
- Using an electric razor shave the fur from the top of the animal’s head and neck, then remove the remaining fur using a depilatory cream (e.g Nair, Church & Dwight Co., Princeton, NJ, USA) and rinse the scalp with mild soap and water.
- Prepare the tail with a betadine skin scrub followed by a bridine wash. Perform a final wipedown with alcohol in order to visualize the tail vein.
- Insert a 22 gauge catheter with 3-way stopcock into the tail vein and flush with a heparin/saline mixture (33 U/mL) to prevent clot formation in the catheter.
- Deliver injectable anesthetics (40-50 mg/kg ketamine, 10 mg/kg xylazine) via intramuscular injection, and remove the animal from the isofluorane.
- Place the anesthetized animal supine on the ultrasound positioning system with the top of the head contacting the waterbath through a hole in the top-plate (Fig.1). A small amount of ultrasound gel maybe applied to the top of the animal’s head to minimize the chance of trapped airbubbles.
- Tape the legs to the positioning system. The head may be held in place using either a bite bar, if available, or tape placed firmly across the chin.
- Cover the animal with a towel and circulating water blanket in order to keep it warm.
3. Target Selection
Acquire baseline axial T2-weighted and T1-weighted MR images of the brain. If using a 1.5 T MRI and dedicated head-sized RF-receive surface coil, suitable scan parameters might be:
T2 weighted: FSE, TE = 60 ms, TR =2000 ms
T1 weighted: FSE, TE=10 ms, TR=500 ms- Select the target from the T2-weighted scans, avoiding the ventricles and the brain midline, and selecting a mid-brain depth.
- Move the transducer focus to the target location.
4. Microbubble Preparation
Definity microbubbles (Lantheus Medical Imaging, MA, USA) are used by several groups for microbubble mediated FUS induced BBBD2,5,7. Appropriate dosages for other microbubble types can be found in the literature11,12.
- Activate the Definity microbubbles and slowly draw up a small volume into a 1 mL syringe using an 18-gauge needle.
- Remove trapped air from the syringe by gently moving the plunger back and forth. Do not tap the syringe as this can break the bubbles.
- Dilute the Definity in normal saline in a ratio of 10:1 saline to Definty by slowly injecting the required volume of Definity into a syringe of saline. If an infusion delivery is used, the Definity can be further diluted, to 50:1 or 100:1.
- Gently invert the syringe to thoroughly mix the Definity and saline until an even appearance is achieved. Gentle inversion of the syringe immediately prior to injection may also be necessary if the bubbles have started to float out of suspension.
- Calculate the required dose volume based on 0.02 mL/kg of Definity, or 0.2 mL/kg of the solution (at 10:1 dilution).
5. Ultrasound Delivery
- Set the sonication parameters, using low duty cycle bursts, not continuous wave sonications. Appropriate sonication parameters at 0.5 MHz are 0.23 MPa in situ pressure, 10 ms bursts at 1 Hz PRF, 2 min. total sonication time. At 1.5 MHz appropriate in situ pressures fall around 0.45-0.5 MPa.
Appropriate pressures at different frequencies can be estimated using a mechanical index of 0.46 13.
- Check that the animal’s head is still coupled to the water.
- Inject the microbubbles slowly into the tail vein catheter and flush with 0.5 mL normal saline. Begin the sonication simultaneously with the start of injection.
6. MRI Evaluation of Treatment Outcome
- Following the sonication, inject an MRI contrast agent (e.g. 0.2 ml/kg Omniscan, GE Healthcare) via the tail vein catheter followed by a 0.5 mL saline flush.
- Perform T1-weighted imaging until the contrast peak has passed. Sonication sites which have been successfully disrupted will show greater enhancement than the surrounding tissue.
- Perform T2-weighted imaging to check for edema. High signal at the sonication sites is indicative of edema.
7. Representative Results
MRI contrast agents can be successfully delivered through the BBB using focused ultrasound and circulating microbubbles. Figure 2 shows typical pre and post-FUS T1-w images. Figure 2B shows a contrast enhanced (CE) T1-w image with distinct focal openings in four sonicated locations. Sonication locations 1 and 2 show particularly bright enhancement. In Fig.3 locations 1 and 2 can also be seen to correspond with T2-w high signal, indicating edema.
The extent of T2-w edema can sometimes be more easily visualized on sagittal slices. Figure 4 shows CE-T1-w and T2-w sagittal slices through sonication locations 1 and 3. Edema is visible at location 1 but not location 3.
Spectral analysis of captured acoustic emissions data (Fig.5) may show harmonic emissions and/or sub/ultra harmonic emissions when stable cavitation is occurring. Harmonics can also arise from tissue non-linearities, while sub and ultraharmonic emissions can only occur as a result of bubble activity14. At higher pressures wideband emissions indicating inertial cavitation may also be detected. However these have been associated with greater amounts of red blood cell extravasations and microdamage than sonications without inertial cavitation11.
The use of higher sonication frequencies results in more localized openings due to the smaller focal spot size. Figure 6 shows that higher frequencies can be used to create smaller regions of opening. This allows investigation of effects mid-brain with fewer near-skull effects.
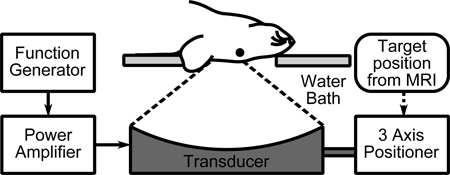
Figure 1. Experimental setup.
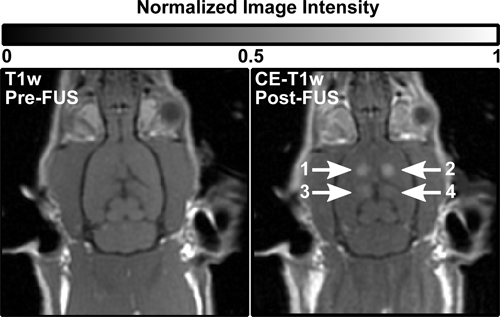
Figure 2. Pre (left) and post (right) treatment T1-w images of a rat brain showing enhancement at four sonication locations.
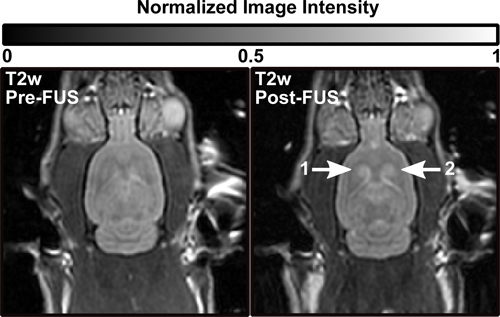
Figure 3. Pre (left) and post (right) treatment T2-w images of a rat brain (same animal as Fig.2) showing T2-w edema at sonication locations 1 and 2.
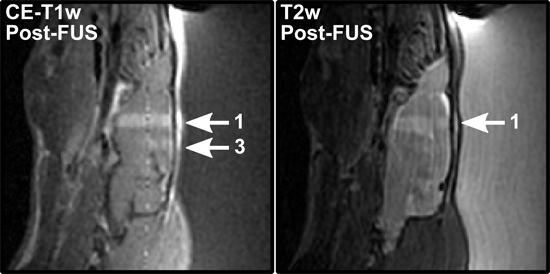
Figure 4. Post treatment sagittal T1-w (left) and T2-w (right) images from the same rat brain as Figs. 2 and 3. The opening at location 1 (left) correlates with T2-w edema (right). Location 3 shows opening (left) but no T2-w edema.
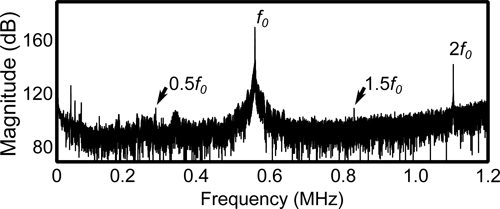
Figure 5. Frequency spectrum from data captured during a single 10 ms burst at 551.5 kHz. The fundamental frequency ( f0) as well as harmonics (2f0) and sub/ultraharmonics (0.5 f0, 1.5f0) are visible.
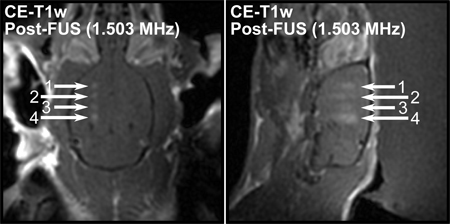
Figure 6. Post treatment CE-T1-w axial (left) and sagittal (right) images from a rat brain sonicated in four locations at 1.503 MHz. BBB openings at this frequency are seen to be more localized.
