LV myocytes are isolated from normal and hypertensive rat hearts. Rod-shaped myocytes with clear striations (representing sarcomeres) and stable contractions in response to field stimulation are considered to be the optimal myocytes and are selected for recordings (Figure 2A). In the example shown in Figure 2A, a Fura 2 AM -loaded LV myocyte is positioned horizontally and the aperture of the camera is adjusted so that the myocyte occupies most of the recording field and minimal background area is included. In the recording field, adjust the dimensions of the purple box by clicking and dragging this box on the computer screen (through the recording program). When the average sarcomere length shows one sharp red peak, start recording (Figure 2A, lower image).
Both sarcomere length and intracellular Ca2+ transients (Fura-2 ratios) are recorded simultaneously from the same myocytes (Figure 3A). The average traces of sarcomere length and Ca2+ transients are shown in Figure 3B. Individually, diastolic/systolic sarcomere lengths, time to peak (PT), and sarcomere shortening are measured to investigate the amplitude and dynamics of myocyte contractility. Time to 50% relaxation (TR50) is analyzed to assess the relaxation of the myocyte. Similarly, the diastolic and systolic Fura-2 ratios (Ca2+ transients), time to peak (PT) of Ca2+ transients and time constant of Ca2+ transient decay (tau) are analyzed to assess myocyte contraction and relaxation (Table 1). In this example, the amplitudes of Ca2+ transients are moderately increased in LV myocytes from a hypertensive rat and contraction is moderately reduced (Figure 3B and Table 1).
Furthermore, the relationships between the Fura – 2 ratio and sarcomere length (indicating the myofilament Ca2+ sensitivity of LV myocytes) are plotted in both sham and hypertensive rats (Figure 3C). The Fura 2 – sarcomere length trajectory during the relaxation phase of the myocyte defines a quasi-equilibrium of cytosol Ca2+, myofilament Ca2+ binding, and sarcomere length14; therefore, the relaxation phase is compared between the two groups. The rightward shift of the trajectory in myocytes from the hypertensive group indicates a reduced myofilament response to Ca2+ (Figure 3C). Accordingly, the intracellular Ca2+ concentration required for half relaxation (EC50) is increased (Figure 3C), referring to myofilament Ca2+-desensitization in hypertension.
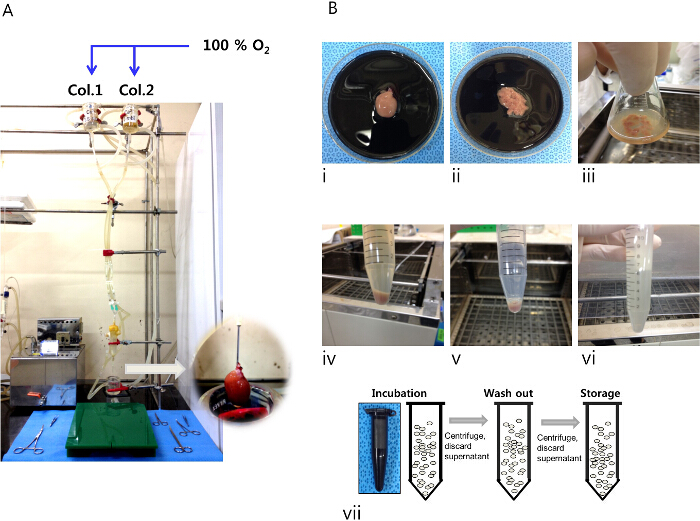
Figure 1. Procedures for isolating LV myocytes from rat heart. (A) The Langendorff perfusion system used to perfuse the isolation solution into the heart cannulated via the aorta (inset, magnified image of the mounted heart on the perfusion system). (B) i – iii: The heart after digestion with collagenase solution 1 and dissected LV tissue in a dish and flask. (B) iv – vi: Myocyte suspension after addition of collagenase solution 2, myocyte pellet after centrifugation, and re-suspended myocyte pellet in storage solution. (B) vii: Incubation, incubate LV myocytes in Fura 2AM – containing isolation solution (2 µM Fura 2 AM, 250 µM Ca2+ and with 2 µl poloxamer 407); washout, wash LV myocytes with isolation solution with 500 µM Ca2+; storage, keep Fura-2 AM – loaded LV myocytes in fresh isolation solution containing 500 µM Ca2+. Please click here to view a larger version of this figure.
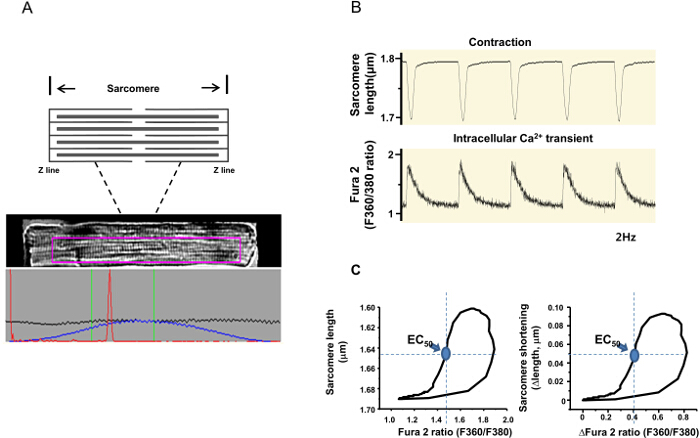
Figure 2. Measurement of sarcomere shortening and the Fura-2 ratio (indicative of the intracellular Ca2+ level). (A) A diagram of sarcomere, an image of a Fura-2 -loaded LV myocyte and the averaged sarcomere length (the red peak) are displayed on the computer. In the lower panel, the black line is the average of each horizontal pixel line within the purple region of interest. The blue line is the same data zeroed at each end. The red line is the fast Fourier transform (FFT) power spectrum, which represents the number of signals the FFT has calculated. One sharp peak means a clean sarcomere recording. (B) Simultaneous recordings of sarcomere length and the Fura -2 ratio in response to field stimulation (2Hz). (C) Phase-plane plot of the Fura 2 ratio vs. sarcomere length of the same LV myocyte (note that both the actual length/Fura 2 ratio and delta changes of these parameters are analyzed). EC50 (Fura 2 ratio at 50% relaxation, circle indicated by arrow) is the qualitative comparison of myofilament Ca2+ sensitivity between the groups. Please click here to view a larger version of this figure.
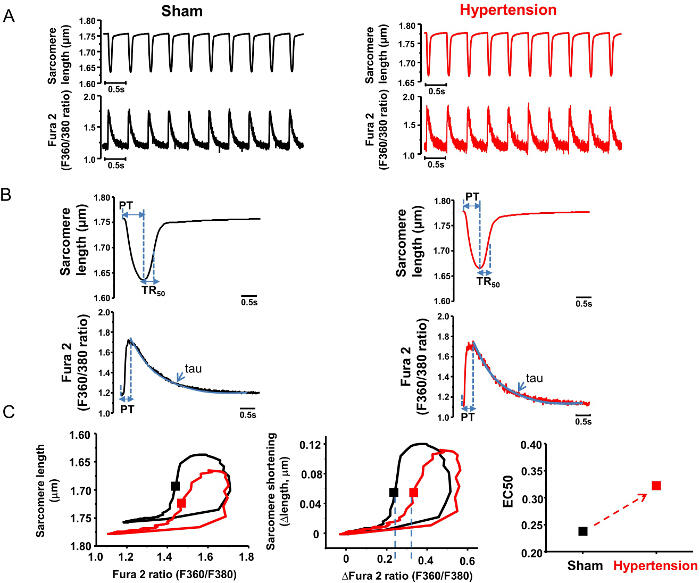
Figure 3. Representative results of the analysis of LV myocyte contraction in sham and hypertensive rats. (A) Raw traces of sarcomere shortening and Fura – 2 ratio measurement in LV myocytes from sham and hypertensive rats. (B) Average traces of sarcomere length and Fura – 2 signals. Parameters analyzed in the averaged traces are shown in Table 1. (C) Phase-plane plots of the Fura – 2 ratio vs. sarcomere length (both the actual length and Fura – 2 ratio and delta changes of these parameters) in the two groups. The trajectory loop is shifted to the right and EC50 tends to be higher in hypertension, suggesting myofilament Ca2+ desensitization. PT, time to peak (sec); Tau, time constant of Ca2+ transient decay (sec) (obtained by fitting the decline phase of the Fura – 2 ratio with an exponential function).TR50: time to 50% relaxation (sec). 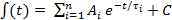 Please click here to view a larger version of this figure.
| Parameters | Sham | Hypertension | |
| Intracellular Ca2+ | Diastolic Ca2+ | 1.189 | 1.124 |
| Systolic Ca2+ | 1.71 | 1.691 | |
| Amplitude (Δ ratio) | 0.521 | 0.567 | |
| Time to peak (PT, s) | 0.021 | 0.031 | |
| Tau (s) | 0.079 | 0.076 | |
| Sarcomere | Diastolic | 1.758 | 1.78 |
| sarcomere length (μm) | |||
| Sarcomere | 0.122 | 0.115 | |
| Shortening (Δ length,mm) | |||
| Time to peak (PT, s) | 0.064 | 0.055 | |
| Time to 50% | 0.032 | 0.03 | |
| Relaxation (TR50,s) | |||
| EC50 | [Ca2+]i (Fura-2 ratio) for 50% sarcomere relengthening | 0.2382 | 0.3224 |
Table 1. Analysis of the Fura – 2 ratio (intracellular Ca2+) and sarcomere length measurements.
