The formation of bone by the osteoblast is accompanied by coordinated destruction or resorption of bones by osteoclasts. The balance between osteoblastic bone formation and osteoclast resorption is a coupled process describing bone turnover or remodeling, which is essential for skeletal homeostasis. Osteoblast dysfunction leads to impaired bone formation and results in various diseases, including osteoporosis1,2,3. Ex vivo/in vitro differentiation of bone marrow stromal stem cells (BMSCs) to osteoblast precursors and mature osteoblasts results in the formation and deposition of the mineralized bone matrix in the culture vessel over time4,5,6. This bone formation by the osteoblast requires a significant amount of cellular energy. Specifically, collagen synthesis and secretion have been shown to rely heavily on cellular ATP: ADP ratios, and presumably, mineralized vesicle trafficking and secretion require additional ATP7,8,9,10,11. Many researchers have demonstrated that the process of osteoblastogenesis and osteoblast function requires an adequate supply of energy to meet the metabolic demand of bone formation12,13,14,15,16. Therefore, the goal of this method is to characterize the bioenergetic status of primary, murine stromal cells throughout osteoblast differentiation using the real-time cell metabolic flux analyzer. These techniques aid in developing a better understanding of skeletal homeostasis, which may ultimately lead to the development of novel therapeutic options capable of improving skeletal disorders.
The real-time cell metabolic flux analyzer can be used to measure the oxygen consumption rate (OCR) and extracellular acidification rate (ECAR) of live osteoblasts, which corresponds to mitochondrial and glycolytic ATP production, respectively. Fundamental to this methodology is the fact that one H+ ion per lactate is released during glycolysis in the conversion of glucose to lactate, which alters media pH reflected in the ECAR values. Conversely, during the TCA (tricarboxylic acid) cycle, oxidative phosphorylation via the mitochondria produces CO2 by utilizing or consuming oxygen, and therefore monitoring OCR is reflective of this metabolic process. The analyzer measures both OCR and ECAR in the extracellular microenvironment simultaneously and in real-time, which allows for tremendous potential when studying cellular bioenergetics6,17. Additionally, performing these assays is relatively straightforward and easily customizable depending on the experimental goal. Similar techniques have been employed to further understand T-cell metabolic regulation of the immune system18,19, cancer initiation, and progression20, along with multiple other cell types contributing to metabolic syndromes21,22.
The advantages of Real-time metabolic flux analyzer over alternative techniques include (1) the capability to measure cellular bioenergetics of live cells in real-time, (2) ability to perform assay with a relatively small number of cells (requires as low as 5,000 cells), (3) injection ports to parallelly manipulate multiple treatments in a high-throughput 96-well system, (4) use of radioactive label-free automated cell imager for normalization18,23,24. The following methods aim to provide a generalized but detailed description of monitoring cellular bioenergetics in murine BMSCs throughout osteoblast differentiation using the analyzer. It will include routinely performed assays; however, as with many techniques and methods, it is highly encouraged that individual labs determine specific details for their experiments.
Selection of assay and different types of assays available: A wide variety of assay kits and reagents are available to study the bioenergetics of cells while ensuring the reliability and consistency of the experimental results. Additionally, the desktop software also offers assay templates that can be easily customized. The assay can be defined based on the user's needs to measure different metabolic parameters. These assays can be modified in various ways based on the experimental goal and/or scientific question. For example, with four injection ports, multiple compounds can be injected into the assay media to analyze the cellular response specific to each metabolic pathway.
Cell energy phenotype test: This assay measures the live cells' metabolic phenotype and metabolic potential. This assay is also recommended as the first step to get a generalized idea of pathway-specific metabolism. A mixture of oligomycin A-an inhibitor of ATP synthase and Carbonyl cyanide 4-(trifluoromethoxy) phenylhydrazone (FCCP)-a mitochondrial uncoupling agent is injected to understand the cell energy potential. The injection of oligomycin A inhibits the synthesis of ATP, resulting in an increase in the rate of glycolysis (ECAR) to enable the cells to meet their energy demands; on the other hand, the injection of FCCP results in higher OCR due to depolarization of the mitochondrial membrane. Essentially, this assay depicts basal metabolic respiration, and following the dual injections, pushes, or stresses, the metabolic response. Based on these parameters, the software then plots OCR and ECAR of the cells by classifying the cells as aerobic, quiescent, glycolytic, or energetic state over time25,26.
ATP real-time production rate assay: This measures the cellular ATP production simultaneously from glycolysis and mitochondrial respiration. This assay quantitatively measures the metabolic shifts from the two energy pathways and provides data on the mitochondrial and glycolytic ATP production rates over time. The assay obtains basal OCR and ECAR data followed by calculating mitochondrial ATP production rate through injection of oligomycin A and glycolytic ATP production rate through injection of rotenone + antimycin A mixture (total inhibition of mitochondrial function), resulting in mitochondrial acidification17,27.
Cell mitochondria stress test (or cell mito stress test): This measures the mitochondrial function through ATP-linked respiration, quantifies cellular bioenergetics, identifies mitochondrial dysfunction, and measures cells' response to stress. Various parameters, including basal and spare respiratory capacity, ATP-linked respiration, maximal respiration, and non-mitochondrial oxygen consumption, can be obtained in one assay. This assay involves sequential injections of oligomycin A, FCCP (mitochondrial uncoupling agent), a mixture of rotenone/antimycin A inhibitors to efficiently analyze the effect of these on the mitochondrial function28.
Flexibility mito fuel flex test: This measures the mitochondrial respiration rate by the oxidation of the three primary mitochondrial fuels by the presence and absence of their inhibitors. The sequential inhibition of glucose, glutamine, and fatty acids aids in measuring the dependency, capacity, and flexibility of cells and the dependency of the cells in various cellular pathways to meet the energy demand. When the mitochondria cannot meet the demands of the blocked pathway of interest by oxidizing other fuels, the cells enter a dependency state. The capacity of the cells is calculated by inhibition of the other two alternative pathways followed by the inhibition of the pathway of interest. The flexibility of cells helps in understanding the ability of mitochondria to compensate and meet the fuel needs of the inhibited pathway. It is calculated by subtracting the dependency of cells from the capacity of cells. Three different inhibitors are used independently or as a mixture of two to effectively calculate the assay parameters. 2-cyano-3-(1-phenyl-1H-indol-3-yl)-2-propenoic acid (UK5099) inhibits the oxidation of glucose by blocking the pyruvate carrier in glycolysis. Bis-2-(5-phenylacetamido-1,3,4-thiadiazol-2-yl) (BPTES) ethyl sulfide inhibits the glutamine oxidation pathway, and etomoxir inhibits the oxidation of long-chain fatty acids29.
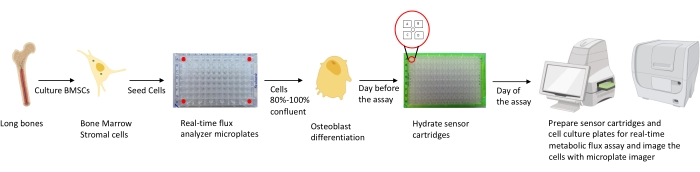
Figure 1: Schematic representation of the methodology for culturing and preparing osteoblasts for analysis. Murine BMSCs are isolated from long bones, cultured, and seeded in 96-well plates at 25,000 cells/well density. Culturing these cells in Osteoblast specific media is started when they reach 80%-100% confluency to start their differentiation. The assays are performed at different stages of differentiation. The cartridge plates are hydrated one day prior to the assay. On the day of assay, different inhibitors are injected in the ports of the sensor cartridges based on the assay requirements, and a calibration buffer is added to the 96-well calibration plate. After calibration, the real-time cell metabolic flux assay is performed, followed by imaging the cell culture microplate using the microplate imager to normalize real-time cell metabolic flux analyzer data with cell count. Please click here to view a larger version of this figure.
All the procedures were based on the guidelines and approval of the Institutional Animal Care and Use Committee at Vanderbilt University Medical center.
1. Preparation of reagents and assay setup
- Isolation and culturing of bone marrow stromal cells (also see the previous article30).
- Prepare complete alpha minimum essential media (αMEM) cell culture media by supplementing minimum essential media with alpha modification with 10% FBS (fetal bovine serum), 100 U/mL of penicillin, and 100 µg/mL of streptomycin.
- Prepare the bone marrow collection tube by trimming the end of a 0.6 mL microcentrifuge tube so that the cells can pass through and inserting it in a 1.5 mL microcentrifuge tube containing 100 µL of complete αMEM.
- Euthanize the mice using CO2 treatment as follows. Place the animal in the CO2 chamber for 2-3 min or until respiration ceases. Wait for at least 1 min after the animal becomes unconscious to remove the mice from the chamber and cervically dislocate.
- Using sterile forceps and a pair of scissors, cut open the lower abdomen of the euthanized mice to make a small incision. Isolate the long bones (femur, tibia, and iliac crest) of the mice.
- Trim the long bones to remove all soft tissue. Once the bone is cleaned, cut ~1-2 mm from the distal and proximal ends to create an opening for the marrow to flush through.
NOTE: This opening should be conservative to avoid losing the marrow while allowing it to flush out. - Place the bones in a collection tube containing 100 µL of 1x sterile PBS (phosphate-buffered saline) to isolate the total bone marrow.
- Flush the marrow by centrifugation at 10,000 x g for 15-20 s at room temperature. Marrow cells pellet at the bottom of the tube.
- Repeat centrifugation until the bone cavity appears white and devoid of most marrow elements. Resuspend the mixed population of bone marrow by gently pipetting up and down.
- Culture the cells from one animal (both femur and tibia) in a 75 cm2 cell culture flask in 10 mL of cell culture media and incubate at 37 °C in a cell culture incubator with 5% CO2. If pooling cells from 2-3 animals, use a 150 cm2 cell culture flask (recommended).
- Following 24-48 h of incubation of the mixed population, aspirate the non-adherent hematopoietic cell population contained within the culture media and wash the adherent cells with 1x PBS.
- Cell seeding from BMSCs and osteoblast differentiation
- Trypsinize the adherent cells by adding enough 0.25% trypsin- EDTA (approximately 3-4 mL) to slightly cover the flask surface, followed by a 3 min incubation at 37 °C.
- Add 6-7 mL of complete αMEM to the flask/trypsin to resuspend the adherent BMSCs by carefully pipetting up and down. Transfer BMSC suspension to a conical centrifuge tube.
- Remove a 50 µL aliquot of the BMSC suspension and add 50 µL of trypan blue (1:1 dilution) to it. Count the total number of viable cells that exclude the dye by pipetting 10 µL of this mixture onto a hemocytometer and observing it under the microscope. Do not count any dead or unhealthy cells that appear blue-colored (<10% cells).
- Based on the cell count, calculate the volume of cell suspension in complete αMEM needed for a final concentration of 2.4 x 10⁶ cells/mL for a total volume of at least 10 mL per plate.
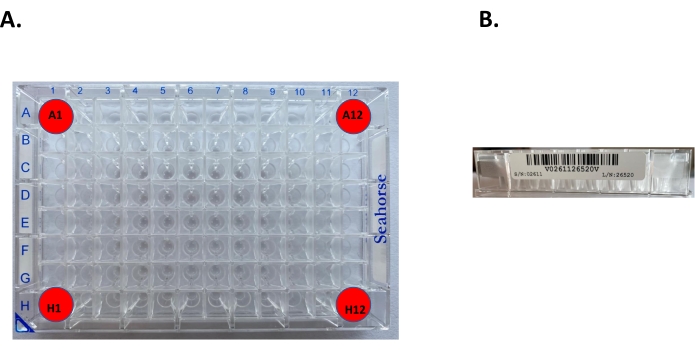
Figure 2: The cell culture microplate, specifically designed for the analyzer. (A) The four background correction wells, A1, A12, H1, H12, are highlighted. These wells only contain assay media without any cells. (B) The barcode on the side of the plate to scan the plate using the imaging reader and analyzer. Please click here to view a larger version of this figure.
- Centrifuge the cells in the conical tube at 1,000 x g for 5 min and resuspend the cells to the desired final concentration of 2.4 x 10⁶ cells/mL.
- Transfer the cell suspension to a reservoir and, using a multichannel pipet, carefully resuspend the cells to ensure a homogenous mixture of cells.
- Seed 2.5 x 10⁴ cells per well in the 96-well cell culture microplate with 80 µL of complete αMEM. Do not seed cells in the background correction wells (A1, A12, H1, H12); instead, just add the medium in these four wells.
NOTE: BMSCs for the assays are plated in 96-well cell culture microplate designed for the analyzer in conjunction with the sensor cartridges. The surface area of these plates is different from a regular 96-well plate. The surface area of each well in the plate is 0.106 cm2, which is approximately 40% of the typical 96-well plate area. Optimal cell seeding density is chosen based on the cell type. Typically, the analyzer can detect between 0.5-4 x 10⁴ cells per well. Osteoblasts need to be in contact to differentiate effectively; for this purpose, plating between 2.0 x 10⁴-3.0 x 10⁴ BMSCs/well in 80 µL of complete αMEM has been selected. - Gently agitate the plate to ensure the even distribution of cells in the wells and incubate at 37 °C, 5% CO2. Check the growth of the cells and cell confluency under the microscope after 48 h. Change the cell culture media if required.
- Depending on the goal of the assay, when BMSCs are 60%-80% confluent (typically 48-72 h), initiate osteoblast differentiation by changing the cell culture media to osteoblast differentiation media (complete αMEM supplemented with 5 mM β-glycerol phosphate and 50 µg/mL of L-ascorbic acid).
- If undifferentiated stromal cells (Day 0) are to be analyzed, maintain cells under complete αMEM.
- Change the osteoblast differentiation media every other day and visualize the cells under the microscope to ensure they are healthy until the day of the assay. Preferably, 24 h before the scheduled assay, change the media and maintain a consistent medium change schedule (recommended).
NOTE: Carefully change the media by slightly tilting the plates at an angle; this avoids accidental contact of pipette tips to the cell culture plates and disruption of the monolayer of cells.
2. Preparation of sensor cartridge for extracellular flux calibration
- Hydrate the sensor cartridges from the extracellular assay kit prior to the day of the assay. Remove the sensor cartridges (green plate) and place the sensors upside down.
- Using a multichannel pipet, add 200 µL of H2O to each well of the utility plate. Carefully place the sensor cartridges back on the utility plate and incubate the plate overnight at room temperature.
NOTE: The manufacturer recommends incubating the sensor cartridges in a non-CO2 37 °C incubator overnight. However, significant evaporation of the sensor cartridges can occur. If this happens, sensor cartridges can be incubated at room temperature. These plates should be incubated for a minimum of 4 h and a maximum of 72 h. - On the day of the assay, discard the H2O from the utility plate and add 200 µL of calibrant. Incubate the utility plate for at least 1 h before the assay.
3. Real-time cell metabolic flux analyzer media preparation
- Use the phenol red free DMEM media with a pre-adjusted pH of 7.4 (recommended) to run the assay with BMSCs.
- Prepare 80 mL of assay media by supplementing DMEM media with 1 mM sodium pyruvate, 2 mM glutamine, 10 mM glucose, 200 nM insulin, 50-200 µM oleic acid BSA.
- Incubate the complete assay media at 37 °C in a water bath.
4. Preparation of compounds for the sensor cartridges
- Thaw oligomycin A, rotenone, and antimycin A on ice. Pipette up and down to solubilize the compounds before use.
- Add 3 mL of prepared assay medium to each tube, followed by the addition of the respective compound-tube A: 26.4 µL of 2.5 mM oligomycin A; tube B: 3.1 µL of 12.67 mM rotenone + 4.1 µL of 9.4 mM antimycin A + 30 µL Hoechst stain.
- Load a 10x concentration of these inhibitors in the corresponding port. The final concentration of injection solutions needed is 2 µM of oligomycin A, 1 µM of rotenone, and 4.1 µM of antimycin A.
NOTE: Hoechst is added to the final injection port for fluorescently staining the nuclei for imaging and normalization purposes. These concentrations can be optimized based on the cell type. - Load 20 µL of these compounds into the cells in 180 µL of assay media.
5. Prepare cell culture microplate for assay
- Remove the cell culture microplate from the 37 °C incubator and observe the cells under the microscope.
- Remove the assay medium from the water bath.
- Gently wash the cells with 200 µL of assay medium twice and add 200 µL of assay media per well.
NOTE: Once the final assay media is added to the cells, the time until the plates get into the analyzer is crucial. Therefore, do not begin replacing the media until the following steps are performed within 1 h. - Check the cells under the microscope to ensure that the cells remain adhered to the wells.
- Ensure cells in D5 and E8 are adhered with a consistent monolayer and were not washed away during the washing step. Cell imaging software uses these two wells for setting the autofocus and autoexposure.
NOTE: The manufacturer recommends incubating the plate in a non-CO2 37 °C incubator for 1 h; this step can be skipped if automated imaging is preferred. For example, the microplate imager maintains the same conditions in a closed chamber, and cells can be imaged under a brightfield.
6. Setting up the assay and imaging
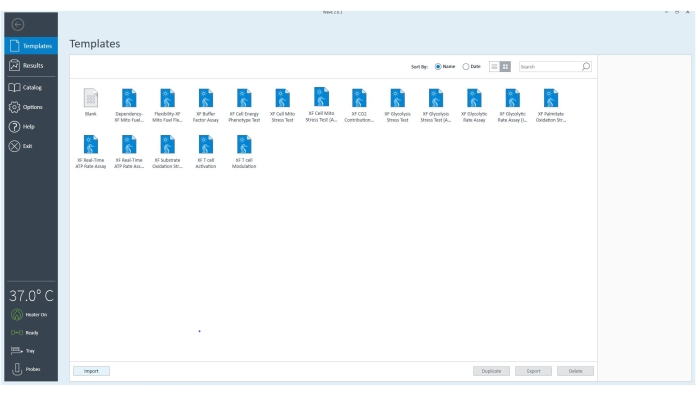
Figure 3: The controller software. The software verifies the equipment is connected and is set to 37 °C. The template files for different assays that can be performed with the extracellular flux analyzer can be selected to customize the assay further based on the experimental goals. Please click here to view a larger version of this figure.
- Open the desktop software in the computer next to the equipment.
- Check the connection status in the lower-left corner of the controller software.
- Go to Templates and select the XF ATP Rate Assay template file or appropriate assay template.
- Select Group Definitions on the top of the screen and define the groups.
- Select the Plate Map Layout and assign the wells depending on the groups defined.
- Verify the instrument protocol, ensure that the compounds added are correctly listed, and include the project information for future references.
- Click on Run Assay; this will prompt the selection of the result file storage location.
- Select the location to save the result file.
- Save the file with the date of assay and click on Start Run.
- Place the sensor cartridge and the utility plate on the tray and click on I'm Ready to initiate the calibration.
- Before starting the calibration , ensure the cartridge lid is removed, and the sensor cartridge is placed in the correct orientation on the utility plate. This step will take 10-20 min, and once complete, the software will display the Load Cell Plate dialog box.
7. Obtain brightfield images
NOTE: This step is optional. If no imaging equipment is available, skip to step 8.
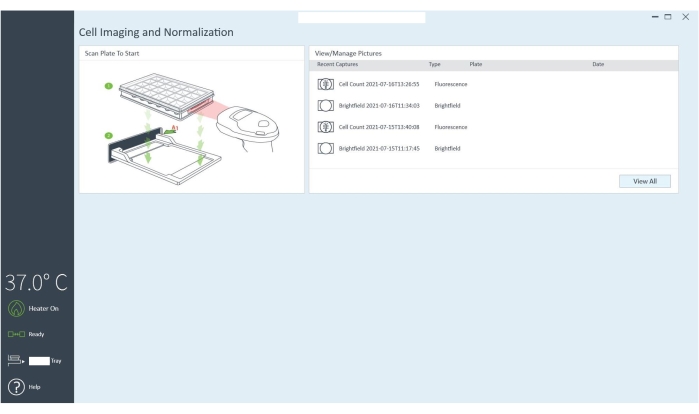
Figure 4: The cell imaging software communicates to the imaging reader through the computer. The cells in the microplate can be imaged before and after the assay, and the cell count/well is obtained after the assay to normalize the data. Please click here to view a larger version of this figure.
- Open the cell imaging software on the computer.
- Make sure that the microplate imager is turned on and the ports are connected to the computer.
- Check the status bar in the bottom left of the screen to ensure that the temperature is set to 37 °C and that the connection status should be highlighted in green as ready.
- Scan the plate barcode to initiate the imaging process.
- Provide a name to the cell plate and hit Save (This is the name where both bright field and fluorescent images will be saved). Click on Perform Brightfield Scan.
- The next screen, plate, and scan menu, show the options for imaging. Before the assay, select Start Brightfield Scan.
- Place the cell culture microplate along with the plate cover/lid on the tray holder and align well A1 with the A1 Mark. Click on Close Tray.
- The next screen, brightfield image acquisition, with a plate map appears. Click on Scan All Wells, which initiates the system initialization process followed by 30 to 35 min of a scan.
- After the brightfield scan, remove the cell culture microplate and place it in the analyzer to perform the assay.
8. Running the assay
- Once the calibration is complete, the software displays the Load Cell Plate dialog box.
- Click on Open Tray to replace the utility tray with a cell culture microplate. Ensure that the lid is removed and the A1 of the plate fits in the correct orientation.
- Then, click on Load Cell Plate to initiate the assay. The sensor cartridge will remain inside the analyzer for the assay injections.
- Wait until the assay starts and displays the estimated time of completion.
- Upon completion of assay, the software displays Unload Sensor Cartridge dialog box. Click on Eject and remove the cell culture microplate from the analyzer.
- Carefully remove the sensor cartridge and replace the cell plate lid. The cells are ready for fluorescent imaging and cell counting.
- After removing the cell plate and sensor cartridge, the Assay Complete dialog box appears.
- Click on Voir les résultats to open the assay result file and normalize the data immediately or click on Home.
9. Obtain fluorescence images and normalize
NOTE: This step is an optional but preferred method for the normalization of BMSCs and osteoblasts. If no imaging equipment is available, another normalization method needs to be performed, such as protein or DNA isolation and quantification.
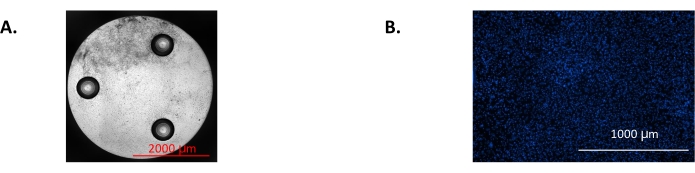
Figure 5: Representative images from the imaging software used for normalization of data from the assay. (A) Stitched bright field image showing the cell confluence throughout the entire well. (B) Stitched fluorescence image showing Hoechst-stained nuclei of osteoblasts used for counting cell numbers to normalize the assay results. These are osteoblasts after 7 days of differentiation. Please click here to view a larger version of this figure.
- After the assay completion, scan the plate barcode with the handheld barcode reader. If the plate has already been imaged, it will not require a new name.
- Select Fluorescence & Cell Count, place the cell plate on the tray holder, and click on Close Tray.
- In the image acquisition window, select Scan All Wells to begin imaging. Fluorescence imaging takes about 15-20 min to scan the entire plate. Observe the green tick mark denoting that the scan has been completed.
- Review the fluorescent images and cell counts in the imaging and cell imaging application by randomly clicking on a couple of the wells.
NOTE: There is an option to view counted cells on the bottom right of the screen. This option shows a masked image, highlighting the objects that were counted. - Once the fluorescence imaging is complete, export the images for additional references.
- Once the imaging and cell count is complete, open the Résultats file and click on Normalize. The normalization screen will give the plate layout and an option to import the cell count.
- Click on Import and select Apply for the desktop software to normalize the assay with cell count automatically.
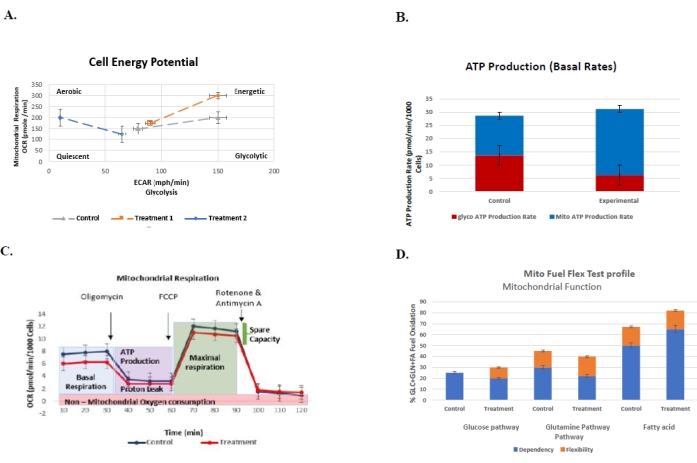
Figure 6: Representative graphs for routinely performed assays to understand the cellular bioenergetic profile of control vs. treatment group with their respective standard errors. (A) The cell energy phenotype test. The plot represents the glycolysis (ECAR) vs. mitochondrial respiration (OCR) of the control vs. two treatment groups (n = 3). The injection of oligomycin A and FCCP stressors elevates the baseline activity, indicated by open symbols, whereas closed symbols indicate the response of cells to different stressors. (B) The real-time ATP rate assay. The ATP rate assay indicates that both the control and treatment groups (n = 2) produce more ATP through glycolysis compared to oxidative phosphorylation. (C) The mito stress test. The mito stress test provides the mitochondrial respiration rate of control vs. treatment cells (n = 2) over time and the effect of inhibitors on the cells after their respective injections. (D) The mito fuel flex test. The mito fuel flex test measures the percentage oxidation of control and treatment groups (n = 2) with respect to glucose, glutamine, and fatty acid pathways and the dependency and flexibility of the cells on these mitochondrial fuels. Please click here to view a larger version of this figure.
The protocol describes a generalized description of how the extracellular flux assays aids in understanding the cellular bioenergetics of osteoblasts derived from murine BMSCs. We have detailed these routinely performed assays and important notes to be considered before, during, and after the assay. The two major ATP production pathways, glycolysis, and mitochondrial oxidative phosphorylation, are widely discussed to better understand the capability of cells to interchange between the pathways, thereby meeting the energy demands of the cells. Once the assay is complete, the assay results are normalized based on the cell count and exported to the respective assay report generator file. The report generator automatically calculates the assay parameters and provides a summary report of the assay. Figure 6 illustrates the representative results of routinely performed assays to better understand how mature osteoblasts control versus treatment groups react when different inhibitors are injected.
Generic, representative images of possible expected results are shown in Figure 6. For example, in Figure 6A, the cell energy phenotype monitors the OCR vs. ECAR by calculating the cells' baseline phenotype, stressed phenotype, and metabolic potential. The injection of the oligomycin A and FCCP stressor mix increases the control group's baseline activity (open symbols) by increasing the utilization of both pathways. In response to the stressors, a significantly high energy level is noticed in the control and treatment 1 group (closed symbols). On the other hand, treatment 2 had a comparatively lower baseline activity, and the cells became more aerobic. This assay aids in understanding the bioenergetics of the cells in response to different stressors.
Real-time ATP rate assay calculates the total cellular ATP production rate based on the sum of glycolytic and mitochondrial ATP production rates.
ATP Production Rate (pmol ATP/min) = glycoATP Production Rate (pmol ATP/min) + mitoATP Production Rate (pmol ATP/min).
Figure 6B indicates that both the control and treatment groups produce more ATP through glycolysis compared to that of oxidative phosphorylation. While the treatment group exhibits significantly higher total ATP production, the cells have consistently shifted from glycolytic to oxidative metabolism. This comparison of the control and treatment group indicates that this specific treatment exhibits a different bioenergetic profile compared to the control group.
Figure 6C is an example of the mitochondrial respiration rate over time, which is detailed. The basal respiration rate in the treatment group is comparatively less than in the control group. The respiration and ATP production rates in both groups are decreased along with the proton leak followed by an oligomycin A injection. The respiration rates of the cells rise back again to their maximal respiration after the injection of FCCP. The final injection of rotenone/antimycin A decreases the OCR again, resulting in spare respiration, which is measured by the differences in maximal and basal respiration. After the third injection, the mitochondrial respiration is shut down by the combination of rotenone/antimycin A, which targets and inhibits the electron transport chain (ETC) complex I and III, thereby enabling us to calculate the non-mitochondrial respiration. Compared to the control group, both the basal and maximal respiration in the treatment groups is relatively lower; this suggests that the treatment could affect the mitochondrial respiration of osteoblasts.
The mito fuel flex test measures the potential of mitochondria to oxidize the three different mitochondrial fuels, glucose, glutamine, and fatty acids. The cell's dependency, flexibility, and capacity on different pathways that fuel the mitochondrial respiration are calculated based on the oxidation of the respective mitochondrial fuel. Figure 6D shows that the control group is highly dependent on the glucose pathway. At the same time, the treatment enhanced the capacity of glucose oxidation of the cells to actively meet the fuel needs of the inhibited pathway. On the other hand, the oxidation of glutamine was efficient in the control group, resulting in comparatively higher dependency of cells to that of the treatment group, thereby increasing the overall capacity of the control group. The fatty acid pathway shows that the treatment has increased the overall capacity of the cells due to the higher dependency on mitochondrial fuel while compensating the fuel needs.
