- 00:00Vue d'ensemble
- 01:15Principles of Bacterial Growth Curve Analysis
- 03:46Collection of Bacterial Culture Aliquots
- 05:09Serial Dilution Plating to Quantify Bacteria
- 07:19Counting Colonies and Calculating Mean Generation Time
- 09:31Applications
- 11:50Summary
Analyse der bakteriellen Wachstumskurve und ihre Umweltanwendungen
English
Diviser
Vue d'ensemble
Quelle: Labors von Dr. Ian Pfeffer und Dr. Charles Gerba – Arizona University
Demonstrierende Autor: Luisa Ikner
Bakterien gehören zu den am häufigsten vorkommenden Lebensformen auf der Erde. Sie sind in jedem Ökosystem gefunden und sind von entscheidender Bedeutung für den Alltag. Zum Beispiel Bakterien beeinflussen, was die Leute Essen, trinken und atmen, und es gibt tatsächlich mehr bakterielle Zellen im Körper einer Person als Säugerzellen. Aufgrund der Bedeutung von Bakterien ist es vorzuziehen, bestimmte Arten von Bakterien im Labor zu untersuchen. Dazu werden Bakterien unter kontrollierten Bedingungen angebaut, in Reinkultur, was bedeutet, dass nur eine Art von Bakterium erwogen wird. Bakterien wachsen schnell in Reinkultur, und Zellzahlen in kurzer Zeit dramatisch zunehmen. Durch die Messung der Rate der Zellpopulation zu erhöhen, im Laufe der Zeit eine “Wachstumskurve” entwickelt werden. Dies ist wichtig, wenn mit dem Ziel, nutzen oder impfen bekannte Nummern des bakteriellen Isolats, zum Beispiel um Pflanzenwachstum zu verbessern, die biologischen Abbau giftiger organischer Stoffe oder Antibiotika oder andere natürliche Produkte im industriellen Maßstab zu produzieren.
Principles
Procédure
Résultats
Following a serial dilution plating experiment, the following data was obtained. At the beginning of exponential growth designated here as time t = 0, the initial concentration of bacterial cells is 1,000 CFU/mL. At time t = 6 h, the concentration of cells is 16,000 CFU/mL.
Now, X = 2n x X0
Where: X0 = initial concentration of cells = 1,000 CFU/mL
X = concentration of cells after time t = 16,000 CFU/mL
n = number of generations
16,000 = 2n x 1,000
2n = 16
log10 2n = log10 16
n x 0.301 = 1.204
n = 1.204 = 4
0.301
Four generations elapsed in 6 h, so
Mean Generation Time = 6/4 = 1.5 h.
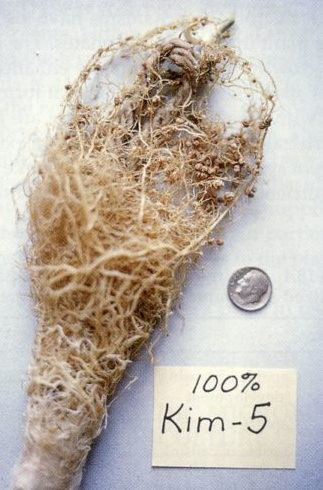
Figure 4. A root nodule that contains nitrogen-fixing bacteria.
Applications and Summary
Knowledge of bacterial growth kinetics and bacterial numbers in a culture medium is important from both a research and commercial point of view. In research, it is often critical to know the number of bacteria in a sample, so the experiment can be replicated, if need be, with the exact same numbers. For example, during experiments in which bacterial inoculants are added to a plot of soil, a minimum of 104 CFU needs to be added per gram of soil to get the desired effect, such as enhanced biodegradation of toxic organic soil contaminants. Another example is the case of commercially produced rhizobial inoculants, where known numbers of rhizobia (bacteria that enter into symbiotic relationships with the roots of plants) are impregnated into a peat-based carbon medium (Figure 4). The medium is then used to inoculate legume seeds to enhance biological nitrogen fixation (i.e., the conversion of molecular nitrogen into organic forms that can be used by organisms as nutrients).
Growth kinetics is also useful for assessing whether particular strains of bacteria are adapted to metabolize certain substrates, such as industrial waste or oil pollution. Bacteria that are genetically engineered to clean up oil spills, for example, can be grown in the presence of complex hydrocarbons to ensure that their growth would not be repressed by the toxic effects of oil. Similarly, the slope and shape of growth curves produced from bacteria grown with mixtures of industrial waste products can inform scientists whether the bacteria can metabolize the particular substance, and how many potential energy sources for the bacteria can be found in the waste mixture.
Transcription
Measuring the growth rate of bacteria is a fundamental microbiological technique, and has widespread use in basic research as well as in agricultural and industrial applications.
Bacteria are among the most abundant life forms on Earth, being present in every ecosystem, including the human body. Certain bacterial species are also genetically highly tractable, and have been harnessed as research models or to produce natural or synthetic products at the industrial scale. However, not all bacterial species can be cultured in the lab. For those that can, an important characteristic is the rate of multiplication, or “growth kinetics”.
Measuring a bacterial culture’s growth rate can inform scientists about their physiological and metabolic functions, and is also useful for obtaining an accurate cell number of the bacteria for downstream applications.
This video will introduce the principles behind bacterial growth rate analysis, demonstrate a protocol for characterizing growth rate with a “growth curve”, and finally, explore several environmental science applications for measuring bacterial growth kinetics.
Bacteria generally reproduce asexually, multiplying by simple binary fission where one parental cell divides into two identical daughter cells. Under favorable growth conditions where nutrients are available in abundance and environmental parameters such as temperature are all conducive to growth, the rate of multiplying far exceeds the death rate. This results in exponential growth.
By measuring the amount of the bacteria in a culture as a function of time, a growth curve can be obtained. Growing bacteria in a liquid culture under optimal conditions produces a growth curve with a characteristic shape that can be divided into various phases. The curve begins with a “lag phase”, when growth is slow while the bacteria become acclimated to the culture conditions. Next is the “log” or “exponential phase”, when the bacteria experience exponential growth. Growth eventually stalls once nutrients become depleted and waste products accumulate, resulting in a “stationary phase”. Finally, once the rate of multiplying is overtaken by the rate of cell death, the culture enters the “death phase”.
To construct a growth curve, bacterial numbers in a flask of liquid culture are counted at different time points over a certain period of culturing. Bacterial counts can be obtained by a number of different methods. One common approach is to measure optical density – or “OD” – 600, which is the bacterial solution’s absorbance of light at a wavelength of 600 nm.
Another method is to determine the “CFU”, or colony forming units, per milliliter of the culture. Due to the clonal nature of bacterial growth, one bacterium in a culture can theoretically expand into one observable colony on an agar plate. By plating a series of dilutions of a bacterial culture to reach a bacterial concentration where individual, discrete colonies can be observed, a method called “serial dilution plating”, the colony count can be used to back-calculate the bacterial concentration in terms of CFU per mL.
Now that you understand how bacterial growth can be analyzed, let’s go through a protocol for conducting growth curve analysis on pure cultures of a well-established bacterial model, Escherichia coli, using the serial dilution plating method.
One day before time point collection, inoculate 20 mL of pre-sterilized trypticase soy broth, or TSB, medium in a 50-mL flask with a single colony of E. coli.
Incubate the culture overnight at 37 °C with shaking. For E. coli, this would result in a stationary phase population of approximately 109 CFU/mL.
The following day, inoculate 100 μL of the overnight culture into 250 mL of TSB in a 500-mL flask. Mix thoroughly. This produces a diluted culture of approximately 4 x 10⁵ CFU/mL. Store 5 mL of this diluted culture into a culture tube. This is the aliquot from time point 0, or T0. Refrigerate immediately at 4 °C.
Incubate the remaining volume of the culture at 37 °C with shaking. At every hour afterwards for up to 8 h, collect 5-mL aliquots from the culture. Designate these samples T1 to T8, and store all of them at 4 °C until use.
On the day of the experiment, remove the E. coli time point aliquots from the refrigerator and keep them on ice. Use sterile microfuge tubes, each with 900 μL of sterile saline, to set up a dilution series for each aliquot according to the following table.
Mix the T0 culture well by gently vortexing, then add 100 μL to Tube A of its dilution series, making a 1-in-10, or 10-1 dilution. Vortex Tube A to mix, and using a fresh pipette tip, add 100 μL of Tube A to Tube B, making the 1-in-100, or 10-2 dilution.
Repeat the process for each culture aliquot and make the appropriate dilution series according to Table 2. Once the dilution series for all the time point samples have been made, have the appropriate number of sterile trypticase soy agar plates prepared for bacterial plating.
3 dilutions of each time point culture will be plated in triplicate according to the following table. Label the plates accordingly. Then, pipette 100 μL of each appropriately diluted culture onto the center of the respective agar plate. Flame-sterilize an “L”-shaped glass rod, cool by touching the rod to the agar away from the inoculum, and immediately spread the liquid over the agar surface. Please note that a delay in spreading could result in bacterial overgrowth at the spot of the inoculation.
Continue plating each dilution series for all 9 time point cultures, flame-sterilizing the glass spreading rod between each dilution series.
Once the plates have been allowed to dry for a few minutes, invert and place them into the 37 °C incubator overnight. After this period of growth, plates can be stored at 4 °C.
After overnight incubation of the dilution plates, examine them for contamination and uniformity of colonies. For each time point culture, pick a dilution for which there are between 30-300 colonies per plate. Count the number of colonies on each of the triplicate plates for that dilution.
Using the mean number of colonies for each dilution and the dilution factor, calculate the concentration of bacteria in the original culture at each time point in CFU/mL. For example, if there are on average 30 colonies from the triplicate plate set obtained from 0.1 mL of the 10-4, or 1-in-10,000, dilution, then there would be 30 divided by 0.1 mL multiplied by 10,000, or 3 million CFU/mL.
Using the bacterial concentration calculated for each time point, plot a graph of the base-10 log of the bacterial concentrations, in CFU/mL, against time in hours. From the graph, identify the log phase of growth of the original bacterial culture and pick two of the time points within the log phase, designating the first of these time points as t = 0. Calculate the mean generation time using the equation X equals 2 to the power of n multiplied by X0 where X is the bacterial concentration at time t, X0 is the initial concentration at t = 0, and n is the number of generations that has elapsed between the two time points.
For example, suppose X0 is 1,000 CFU/mL, and at t = 6 h, the concentration is 16,000 CFU/mL. Using the equation, we obtain that 4 generations have occurred within 6 h, which gives a generation time of 6 divided by 4 or 1.5 h per generation.
Measurement of bacterial growth kinetics is fundamental to many applications for research, agriculture, or bioengineering purposes.
One use for knowing the bacterial growth rate is to permit an accurate amount of a bacterial culture to be obtained to inoculate another culture or medium. For example, certain crops, such as legumes, need to be grown with symbiotic bacteria known as rhizobia that colonize the plants’ roots to form nodules and “fix” nitrogen – converting atmospheric nitrogen into ammonia which can be utilized by the plant. For agricultural applications, a known amount of rhizobia is added to a peat-based carbon medium, which is then used to inoculate legume seeds to establish the plant-bacterial symbiosis.
Growth analysis can also be used to identify bacterial species that can degrade industrial waste and possibly generate valuable byproducts. In this example, researchers investigated how growth media supplemented with black liquor, a waste product from wood pulping and paper production, affected the growth of an environmental microbial isolate.
The bacteria not only demonstrated enhanced growth with black liquor, but also showed a “diphasic” growth pattern, indicating the presence of more than one carbon source in black liquor that the bacteria can metabolize. Individual components of black liquor could then been extracted for more detailed growth analysis.
Finally, growth rate measurements are also useful for characterizing bacteria that have been engineered for particular industrial purposes, for example, for remediation of oil pollution. Here, scientists created genetically engineered bacterial strains that contain enzymes to degrade the hydrocarbon components of oil. Growth analysis was performed, for example, to verify that the engineered bacteria has increased growth rate than normal bacteria in the presence of the toxic hydrocarbons, indicating improved tolerance that will allow the engineered bacteria to perform their pollution cleanup function.
You’ve just watched JoVE’s video on analyzing bacterial growth rates with growth curves. You should now understand the different growth phases of bacterial cultures, how to perform an experiment to obtain a growth curve using time point collection and serial dilution plating, and how growth analysis can be applied to research and industrial purposes. As always, thanks for watching!


