Mice bearing the Colon-26 (C26) carcinoma represent a classical model of cancer cachexia. Progressive muscle wasting occurs in association with tumor growth, over-expression of muscle-specific ubiquitin ligases, and reductions in muscle cross-sectional area. Fat loss is also observed. Cachexia is studied in a time-dependent manner with increasing severity of wasting.
Cancer cachexia is the progressive loss of skeletal muscle mass and adipose tissue, negative nitrogen balance, anorexia, fatigue, inflammation, and activation of lipolysis and proteolysis systems. Cancer patients with cachexia benefit less from anti-neoplastic therapies and show increased mortality1. Several animal models have been established in order to investigate the molecular causes responsible for body and muscle wasting as a result of tumor growth. Here, we describe methodologies pertaining to a well-characterized model of cancer cachexia: mice bearing the C26 carcinoma2-4. Although this model is heavily used in cachexia research, different approaches make reproducibility a potential issue. The growth of the C26 tumor causes a marked and progressive loss of body and skeletal muscle mass, accompanied by reduced muscle cross-sectional area and muscle strength3-5. Adipose tissue is also lost. Wasting is coincident with elevated circulating levels of pro-inflammatory cytokines, particularly Interleukin-6 (IL-6)3, which is directly, although not entirely, responsible for C26 cachexia. It is well-accepted that a primary mechanism by which the C26 tumor induces muscle tissue depletion is the activation of skeletal muscle proteolytic systems. Thus, expression of muscle-specific ubiquitin ligases, such as atrogin-1/MAFbx and MuRF-1, represent an accepted method for the evaluation of the ongoing muscle catabolism2. Here, we present how to execute this model in a reproducible manner and how to excise several tissues and organs (the liver, spleen, and heart), as well as fat and skeletal muscles (the gastrocnemius, tibialis anterior, and quadriceps). We also provide useful protocols that describe how to perform muscle freezing, sectioning, and fiber size quantification.
Muscle wasting is a serious complication of various clinical conditions such as cancer, sepsis, liver, cirrhosis, heart and kidney failure, chronic obstructive pulmonary disease, and AIDS. In particular, muscle wasting is evident in at least 50% of patients with cancer1. Loss of skeletal muscle in cancer results from increased protein degradation due to the over-activation of the skeletal muscle proteolytic systems and/or from decreased protein synthesis6. Lipolysis is also evident, leading to the depletion of adipose tissue. Clinically, cachexia is associated with reduced quality and length of life and is estimated to be the cause of death in 20 – 30% of cancer patients7. Use of experimental models that resemble the human disease as closely as possible would be beneficial. An optimal animal model is characterized by high reproducibility, as well as by limited interference from different therapies and the unpredictable factors of diet, sex, and genetic background that are usually associated with the clinical condition8. So far, cancer cachexia has been studied mainly in animal models characterized by transplantation of cancer cells or injection of carcinogens, although a new method is to use genetically modified mice susceptible to the development of cancer.
Mice bearing the C26 carcinoma (also referred to as colon-26 and adenocarcinoma) represent a well-characterized and extensively used model of cancer cachexia2,5. The growth of the C26 tumor results in body and muscle weight loss, mainly through enhanced fat and protein catabolism9. Generally, a 10% tumor weight versus total body weight is associated with a reduction of 20-25% in skeletal muscle weight and a greater depletion of fat3,10. Hepatomegaly and splenomegaly are also observed with tumor growth, along with the activation of the acute phase response and the elevation of pro-inflammatory cytokine levels3,11. Among these, it is well known that IL-6 plays a pivotal role in mediating muscle wasting in the C26 model, even though this cytokine is probably not the only inducer of cachexia12. Elevated IL-6 causes muscle atrophy through activation of the JAK/STAT3 pathway, and inhibiting this transcription factor can prevent muscle wasting3,4.
During C26-induced muscle wasting, as in many conditions of muscle atrophy, muscle mass is lost largely through reductions in muscle protein content across muscle fibers, not through cell death or loss of fibers13. In C26 cachexia, a shift towards smaller cross-sectional areas is observed in both glycolytic and oxidative fibers2. This is also consistent with reduced muscle strength5. Many groups worldwide have taken advantage of the C26 model in order to discover new mediators of muscle wasting or clinically relevant drugs for cancer cachexia. However, many different procedures for the use of this model have been reported, raising concerns about the consistency of the obtained data and posing barriers to reproducibility in different experimental conditions. Here we report a typical use of this model for the study of cancer cachexia that yields standardized and reproducible data.
Ethics Statement: All studies described were approved by the Institutional Animal Care and Use Committees of the Thomas Jefferson University and Indiana University School of Medicine.
1. C26 Cell Growth and Preparation
2. Mice
3. Euthanasia and Blood Collection
4. Tissue and Organ Excision
NOTE: For use of tissues in biochemical or molecular biology assays, plan to weigh each organ and tissue and place a fragment immediately into pre-labeled cryotubes. Snap freeze in liquid nitrogen and store at -80 °C.
5. Muscle Freezing and Mounting
6. Analysis of the Raw Data
7. Muscle Sectioning
8. Evaluation of Myofiber Size by Laminin Immunofluorescence (Alternative 1)
NOTE: For the evaluation of muscle morphology and cross-sectional area (CSA), hematoxylin and eosin (H&E)- as well as immunofluorescence (IF)-based staining methods are accepted systems to determine fiber size19. Although the H&E staining of muscle sections represents a valuable and convenient method for the analysis of morphology, the use of an IF approach14 is significantly faster and modestly more accurate than the H&E-based method. H&E methods are described below.
9. Evaluation of Myofiber Size from H&E Stained Sections (Alternative 2)
10. Data Collection and Analysis
C26 tumor growth kinetics show a lag phase for the first 7 – 8 d after injection, followed by exponential cell growth (4 – 5 d). The tumor mass eventually reaches ~10% of the body weight (about 2 g; Figure 1A-B). During the first phase, the tumor can be located by palpation only and appears as a small protrusion of the skin. In the second phase, the tumor is observed as a mass under the skin. Rarely, the tumor becomes ulcerated, resulting in an open wound; in this case, the mouse is excluded from the experimental group and is humanely euthanized.
Body weight is unchanged in the first phase, but it is significantly reduced in the second phase, when it reaches 10 – 15% of the initial body weight (30% in the case of tumor-free weight; Figure 1A). Tumor-bearing mice appear wasted and showed disheveled fur at the end of the experimental period, with a body condition (BC) score equal to 118 (Figure 1C). BC1 represents a severely emaciated mouse, where skeletal structures are evident and the vertebrae are distinctly segmented. Body weight loss is mainly accounted for by both skeletal muscle and fat tissue wasting (Figure 1B). Body weight loss is consistent with a reduction of about 20 – 30% in skeletal muscle weight, in particular in the gastrocnemius, tibialis anterior, and quadriceps (Figure 2). The cardiac muscle is also significantly reduced in weight, although to a lesser extent when compared to the other skeletal muscles (Figure 2). Interestingly, hepatomegaly (+16%, p < 0.01) and splenomegaly (+110%, p < 0.01) are generally detected in tumor hosts, while fat mass, similar to skeletal muscle, is severely depleted (-70%, p < 0.001; Figure 3).
Skeletal muscle weight loss is also consistent with and proportional to the reduction in muscle fiber size, as observed after morphometric evaluation of muscle fiber CSA by means of an IF method (Figure 4A-B). In particular, the frequency distribution analysis showed a shift towards smaller-size fibers in C26-bearing mice, thus suggesting that the whole muscle undergoes atrophy in the presence of a C26 tumor (Figure 4C). Similar results can be observed by taking advantage of a traditional H&E-based methodology for the quantification of fiber size, although the magnitude of the change in muscle CSA associated with cancer growth is slightly different (38% versus control, p < 0.01 for the IF-based method; -18% versus control, p < 0.01 for the H&E-based method; Figure 5).
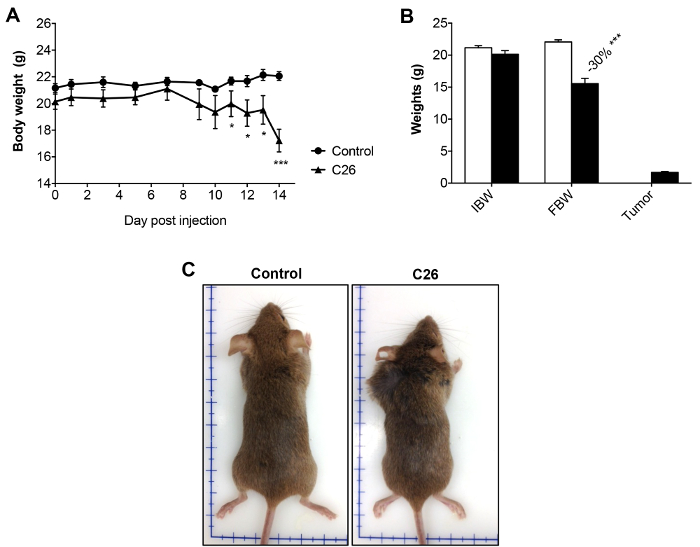
Figure 1: Body Weights in Control and C26-bearing Mice. A) Body weight curve in control and C26 hosts over the entire experimental period (14 days after tumor injection). B) Initial body weight (IBW), final tumor-free body weight (FBW), and tumor weight in control and C26-bearing animals. C) Representative pictures of controls and C26-bearers at the time of sacrifice (day 14 after tumor inoculation). Data are expressed as the mean SD. n = 6. Significance of the differences: *p < 0.05, **p < 0.01, ***p < 0.001 versus the control group using Student's t-test. Please click here to view a larger version of this figure.
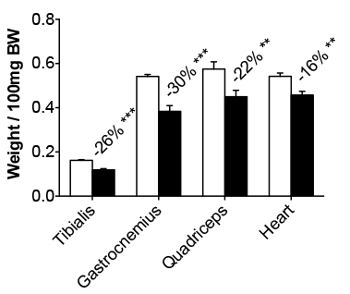
Figure 2: Muscle Weights in Control and C26-bearing Mice. The tibialis, gastrocnemius, quadriceps, and heart weights in control and C26 tumor-bearers are reported as the weight/100 mg IBW. The data are expressed as the mean SD. n = 6. Significance of the differences: **p < 0.01 and ***p < 0.001 versus the control group using Student's t-test.
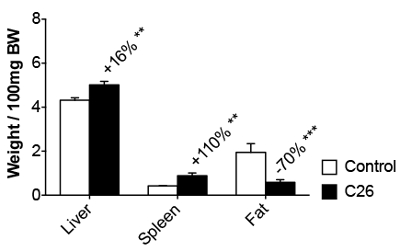
Figure 3: Organ Weights in Control and C26-bearing Mice. The liver, spleen, and epididymal fat pad weights in control and C26 tumor-bearers are reported as the weight/100 mg IBW. The data are expressed as the mean SD. n = 6. Significance of the differences: **p < 0.01 versus the control group.
Figure 4: Morphometry for Myofiber Size by Immunofluorescence. A) Fluorescent immunohistochemical reaction of tibialis sections using an anti-dystrophin antibody (Vector Laboratories) from control and C26 hosts. Magnification: 10X. Size bar: 100 µm. B) Quantification of CSA in the tibialis muscle measured with the ImageJ macro. C) Frequency distribution of CSA in the tibialis muscle of control and C26-bearing mice. The data are expressed as the mean ± SD. n = 6 for each group. Significance of the differences: **p < 0.01 versus the control group using Student's t-test.
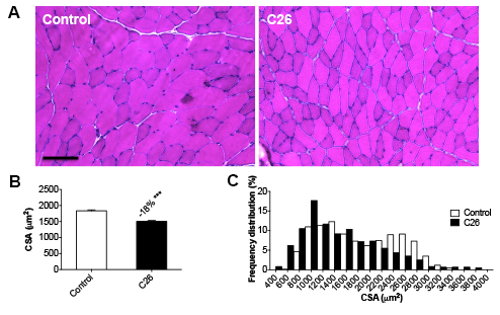
Figure 5: Morphometry for Myofiber Size by H&E. A) Hematoxylin & eosin staining of tibialis sections from control and C26 hosts. Magnification: 20X. Size bar: 100 µm. B) Quantification and frequency distribution of CSA in the tibialis muscle. The data are expressed as the mean SD. n = 6. Significance of the differences: ***p < 0.001 versus the control group using Student's t-test.
Autori | Mouse strain | Mouse gender | Cell number | Origin | Implanted as solid tumor? | Site of injection | Days |
Lazarus et al., 1999 | CD2F1 | M | 5 x 10⁵ | NCI | NO | Dorsal region | 17 |
Al-Majid and McCarthy, 2001 | CD2F1 | F | 2.5 x 10⁶ | OSUMC | NO | Dorsal region | 17 |
Samuels et al., 2001 | Balb/c | M | 0.5 g/ml of tumor suspension | ns | YES | Dorsal region | Up to 11 |
Acharyya et al., 2004 | CD2F1 | M | 1 x 10⁷ | OSUMC | NO | Right flank | Up to 24 |
Aulino et al., 2010 | Balb/c | ns | 0.5 mm3 | NCI | YES | Dorsal region | 21 |
Benny-Klimek et al., 2010 | CD2F1 | F | 1 x 10⁶ | OSUMC | NO | Dorsal region | 14 |
Bonetto et al., 2011; 2012 | CD2F1 | F | 1 x 10⁶ | OSUMC | NO | Dorsal region | 14 |
Cosper and Leinwand, 2010 | CD2F1 | M+F | 5 x 10⁵ | ns | NO | Right flank | Up to 27 |
Murphy et al., 2012 | CD2F1 | ns | 5 x 10⁵ | NCI/OSUMC | NO | Dorsal region | 14 |
Cornwell et al., 2014 | CD2F1 | M | 5 x 10⁵ | NCI | NO | Right&Left flank | Up to 26 |
Assi et al., 2016 | Balb/c | ns | 1 x 10⁶ | Cell Line Service | NO | Dorsal region | Up to 22 |
Table 1: Comparison of the Different Protocols used for C26 Implantation. Different protocols for C26 implantation are provided, with particular reference to the mouse strain used, the cell number and type of tumor inoculated, the cell origin, the site of injection, and the length of the experimental period. OSUMC: Ohio State University Medical Center. NCI: National Cancer Institute. Commercial cell line service NS: not specified.
Especially in its latest stages, colorectal cancer is associated with the development of cachexia, which is responsible for poorer outcomes and reductions in patient quality of life. Many studies have focused on the treatment of conditions secondary to cancer; however, despite many efforts in this direction, there is still no approved therapy for cancer cachexia21. Thus, it is imperative that animal models resemble the human pathology as closely as possible in order to maximize the translation of findings.
C26 tumor-bearing mice are a commonly used experimental model of cancer cachexia22-24. This model closely resembles the human disease, showing reductions in body, muscle, and fat mass, as well as muscle fiber atrophy and increased expression of inflammatory genes and ubiquitin ligases consistent with marked protein hypercatabolism2,5. Despite this, a few disparities with data obtained in cancer patients have been reported25,26. Indeed, some features of the model, including the non-physiologic growth environment (e.g., an ectopic tumor grown subcutaneously instead of orthotopically implanted in the GI tract), the relatively short experimental period compared to other models (e.g., genetic or orthotopic injection of tumors), the dependency on IL-6 action, and the necessary use of CD2F1 or Balb/c mice may represent severe limitations and could constrain the interpretation of results.
The current protocol has proven to be highly reproducible across many experiments performed in our laboratory, maintaining the same characteristics and allowing comparisons between results obtained at different times, in different geographic locations, and by different researchers3,10. However, in order to promote the reproducibility of data, it is important to establish clear and common guidelines.
As gathered from the literature, several caveats might prevent the reproduction of the same data in two different laboratories. For the same reasons, the use of different protocols may generate different phenotypes and outcomes, as well as lead to conflicting and questionable results. Indeed, differences in performing this animal model have been reported, mainly resulting from the strain (Balb/c or CD2F1)2,5,27-29 or sex of mice used17, the type of tumor that was implanted (a cell suspension3,29 rather than a solid tumor in a graft2,30), the tumor source (NCI, ATCC, or OSUMC), the number of C26 cells that were injected, and the site of injection or implantation (the flanks6,17,31 or the dorsal region3,10,32). No direct comparison of the effects associated with the implantation of C26 cell lines obtained from different sources (mainly OSUMC versus NCI) has ever been performed, thus preventing us from drawing any definitive conclusions. However, it is likely that the choice of the source of cells may also significantly influence the expected outcomes. When considering the choice of males versus females, investigators should be reminded of significant differences in the outcomes. Indeed, as reported by Cosper and Leinwand17, male tumor-bearing mice, due to the absence of estrogens, may show a more severe phenotype than females, including greater cardiac mass loss and mortality, a more robust pro-inflammatory response to the tumor, and greater cardiac autophagy.
Especially for those investigators that are not familiar with this model and may initially face problems, based on both a power analysis and our previous experience, the use of at least 6 animals per experimental condition (n = 6) is advisable in order to detect statistically significant differences. It is also critical that randomization is performed carefully, so that initial body weights in the experimental animals do not differ significantly among groups. Similarly, it is advised that, in order to avoid inter-operator variability, the same investigator perform the tissue and organ collection on every animal. Further, it is imperative that tissues (particularly muscle) are frozen as fast as possible in order to preserve the RNAs and enzymatic structure and activity, especially if the goal of the study is to assess gene expression or to evaluate enzymatic activities. Moreover, in the attempt to determine muscle CSA, we showed that reporting the fiber area is generally accepted and representative of muscle fiber size. Here, we present two distinct methods to assess muscle CSA. As shown in Figures 4-5, both methods were able to detect a significant reduction in myofiber size between controls and tumor hosts, although the degree of wasting appeared different.
This discrepancy may result from the fact that, although both methods are acceptable ways to assess muscle fiber size, quantification of muscle characteristics from H&E-stained slides is still a manual or semi-automatic process, most often labor-intensive, time-consuming, and affected by limited accuracy. Based on our experience, we believe that the IF-based method is a more accurate technique to report muscle CSA. Indeed, the number of fibers that can be measured automatically by taking advantage of this technique is significantly larger, thus increasing the accuracy of the measurement. Of note, for both techniques, an alternative method of reporting muscle size is assessing the Feret's diameter. Interestingly, this is considered a very reliable tool due to the fact that this parameter is largely independent of the angle of sectioning. Other parameters, such as the "minimal inner diameter" and the "minimal outer diameter" are also insensitive to the plane of sectioning and can be used instead of the Feret's diameter as alternative indications of the fiber size.
In conclusion, although the cachexia community clearly needs to establish more physiological models for the study of tumor-associated muscle wasting, we believe that mice bearing the C26 colon carcinoma represent a well-standardized and easy-to-use model to investigate molecular alterations and physiological abnormalities usually detected after the occurrence of a tumor. Future applications will involve the investigation of whether orthotopic implantation of C26 cells into the colon might represent a proper and more physiological model of colorectal cancer cachexia.
The authors have nothing to disclose.
We thank Richard Lieber and Shannon Bremner for their ImageJ macro and instructions. While at Thomas Jefferson University, this work was supported by the Pennsylvania Department of Health CURE Grant TJU No. 080-37038-AI0801. Subsequently, this study was supported by a grant to AB from the National Institutes of Health (R21CA190028), and by grants to TAZ from the National Institutes of Health (R01CA122596, R01CA194593), the IU Simon Cancer Center, the Lustgarten Foundation, the Lilly Foundation, Inc., and the IUPUI Pancreas Signature Center.
Cell culture Flasks | Falcon – Becton Dickinson | 35-5001 | |
DMEM | Cellgro | 10-017-CV | |
FBS | Gibco | 26140 | |
Streptomycin-Penicillin | Cellgro | 30-002-CI | |
CD2F1 mice | Harlan | 060 | |
Anesthesia apparatus | EZ-Anesthesia | EZ-7000 | |
2-Methyl Butane | Sigma-Aldrich | M32631 | |
OCT | Tissue-Tek | 4583 | |
Cryostat | Leica | CM1850 | |
Cork disks | Electron Microscopy Sciences | 63305 | |
Superfrost plus glass slides | VWR | 48311-703 | |
Anti-Laminin Rabbit polyclonal antibody | Sigma-Aldrich | L9393 | |
Anti-Dystrophin Mouse Monoclonal antibody | Vector Laboratories | VP-D508 | |
Alexa Flour 594 anti-mouse IgG | Life Technologies | A11062 | |
Alexa Flour 594 anti-rabbit IgG | Life Technologies | A21211 | |
Hematoxylin | Sigma-Aldrich | GHS216 | |
Eosin | Sigma-Aldrich | HT110332 | |
Xylene | Acros Organics | 422680025 | |
Cytoseal-XYL | Thermo | 8312-4 | |
Microscope | Zeiss | Observer.Z1 | |
Bamboo Tablet | Wacom | CTH-661 | |
Prism 7.0 for Mac OS X | GraphPad Software, Inc. | ||
Excel for Mac 2011 | Microsoft Corp. | ||
Image J | US National Institutes of Health | IJ1.46 | http://rsbweb.nih.gov/ij/download.html |
Microtainer | BD | 365873 |