Formation of actomyosin bundles in vitro and measuring myosin ensemble force generation using optical tweezers is presented and discussed.
Myosins are motor proteins that hydrolyze ATP to step along actin filament (AF) tracks and are essential in cellular processes such as motility and muscle contraction. To understand their force-generating mechanisms, myosin II has been investigated both at the single-molecule (SM) level and as teams of motors in vitro using biophysical methods such as optical trapping.
These studies showed that myosin force-generating behavior can differ greatly when moving from the single-molecule level in a three-bead arrangement to groups of motors working together on a rigid bead or coverslip surface in a gliding arrangement. However, these assay constructions do not permit evaluating the group dynamics of myosin within viscoelastic structural hierarchy as they would within a cell. We have developed a method using optical tweezers to investigate the mechanics of force generation by myosin ensembles interacting with multiple actin filaments.
These actomyosin bundles facilitate investigation in a hierarchical and compliant environment that captures motor communication and ensemble force output. The customizable nature of the assay allows for altering experimental conditions to understand how modifications to the myosin ensemble, actin filament bundle, or the surrounding environment result in differing force outputs.
Motor proteins are essential to life, converting chemical energy into mechanical work1,2,3. Myosin motors interact with actin filaments by taking steps along the filaments similar to a track, and the dynamics of actin-myosin networks carry out muscle contraction, cell motility, the contractile ring during cytokinesis, and movement of cargo inside the cell, among other essential tasks3,4,5,6,7,8. Since myosins have so many essential roles, failure in the functionality of the myosin-actin network can lead to disease development, such as mutations in the myosin heavy chain that cause heart hypercontractility in hypertrophic cardiomyopathy (HCM)9,10,11,12,13,14. In muscle contraction, individual myosin motors cooperate with each other by working as an ensemble to provide the required mechanical energy that carries out the relative sliding of AFs4,15,16,17,18. Myosin motors form crossbridges between AFs and use conformational changes due to its mechanochemical cycle to collectively move toward the barbed end of the aligned filaments17,18,19,20,21.
Development of quantitative in vitro motility assays at the SM level using techniques such as optical trapping has facilitated gathering unprecedented detail of how individual myosin motors function, including measuring SM force generation and step sizes22,23,24,25,26,27,28,29,30. Finer et al. developed the "three-bead" or "dumbbell" optical trapping assay to probe the force-generation mechanics of single myosin II motors23,31. As muscle myosin II works in teams to contract AFs but is non-processive at the SM level, the optical trapping assay orientation had to be rearranged from the classic motor-bound bead approach32. To form the dumbbell assay, two optical traps were used to hold an AF over a myosin motor bound to a coverslip-attached bead, and force output by the single motor was measured through movements of the AF within the trap23.
However, SM forces and using a single motor/single filament assay orientation do not give a full image about system-level force generation since many motor proteins, including myosin II, do not work in isolation and often do not function as a sum of their parts15,16,17,32,33,34,35,36. More complex structures that include more than one motor interacting with more than one filament are necessary to better understand the synergy of myosin and actin filaments' networks15,32. The dumbbell assay orientation has been exploited to investigate small ensemble force generation by having multiple myosins attached to a bead or using a myosin-thick filament attached to a surface and allowing the motors to interact with the suspended AF4,23,34,37,38,39,40.
Other small ensemble assays include an in vitro filament gliding assay wherein myosin motors are coated onto a coverslip surface, and a bead bound to an AF is used to probe the force generated by the team of motors4,35,36,38,39,40,41,42,43. In both these cases, the myosins are bound to a rigid surface – bead or coverslip – and utilize one AF. In these cases, the motors are not able to move freely or communicate with each other, nor does having myosins rigidly bound reflect the compliant, hierarchical environment in which the motors would work together in the sarcomere32. Previous studies have suggested that myosin II can sense its environment and adapt accordingly to changing viscoelastic or motor concentration conditions by altering characteristics such as force generation and duty ratio41,44,45. Thus, there is a need to develop an optical trapping assay that fosters and captures motor communication and system compliancy to paint a more realistic picture of the mechanistic underpinnings of myosin II ensemble force generation.
Here, we developed a method to couple hierarchical structure in vitro with optical trapping by forming actomyosin bundles or sandwiches consisting of multiple myosin motors interacting between two actin filaments. This modular assay geometry has the ability to directly probe how molecular and environmental factors influence ensemble myosin force generation. Further, investigating force generation mechanisms through these actin-myosin ensembles have the potential to aid in modeling and understanding how large-scale cellular tasks, such as muscle contraction, propagate up from the molecular level9,10,13.
1. Etching coverslips
2. Actin filament polymerization
3. Myosin and bead preparation
4. Flow cell preparation
5. Actomyosin bundle preparation
6. Force measurements using Optical Trap (NT2 Nanotracker2)
NOTE: While the protocol below is specifically for the NT2 system, this assay can be used with other optical trapping systems, including those that are custom-built, that also have fluorescence capabilities. The general workflow remains the same of getting the surface of the slide in focus, performing bead calibrations, and acquiring data by finding fluorescent actin bundles. For the NT2 system, Supplemental Figure S1, Supplemental Figure S2, Supplemental Figure S3, Supplemental Figure S4, Supplemental Figure S5, Supplemental Figure S6, and Supplemental Figure S7 provide details of the optical trapping system and the software interface.
Flow cells containing the actomyosin bundle systems are of a standard design, consisting of a microscope slide and an etched coverslip separated by a channel made from double-sided sticky tape (Figure 1). The assay is then built from the coverslip up using staged introductions as described in the protocol. The final assay consists of template rhodamine-labeled actin filaments; the desired myosin concentration (1 μM was used for the representative results in Figure 2 and Figure 3); biotinylated, Alexa Fluor 488-labeled actin filaments; 1 μm streptavidin beads; the oxygen scavenging system; ATP; and APB buffer. Multiple bundles will be formed per flow cell, and the actin concentrations described above give adequate spacing between bundles to ensure no unwanted interactions. This also facilitates obtaining multiple force measurements per flow cell to increase data acquisition efficiency. Force profiles should be reproducible within a flow cell and from flow cell to flow cell.
While the protocol above is geared toward the use of a commercial optical trapping setup, the flow cell and assay presented here could be easily utilized for a different commercial instrument or custom-built optical trapping setup coupled with a microscope or microscope stage and possessing fluorescence imaging capabilities. Once all flow cell additions are complete according to the above protocol, the actomyosin bundles on the slide (Figure 1) are ready for immediate measurement. The flow cell is added to the optical trap microscope stage, multiple bead calibration measurements are acquired, and bundles are identified through fluorescence colocalization of the bundle filaments. A bead bound to a bundle is trapped, and the displacement and corresponding force measurement begins. The user can observe the acquisition of data in real time on the computer monitor. Depending on the concentration of myosin used in the flow cell, the bundle could begin exhibiting substantial movement immediately, or it may take 30 s-1 min to effectively see an increase in displacement/force.
A representative force trace is shown in Figure 3A where the myosin motors exhibit a steady ramp in force followed by a plateau. It is typical to see these types of traces develop over 2-5 min. However, it is also possible to measure actomyosin bundles that do not generate any net force (Figure 3B). These traces appear as baseline noise or exhibit no substantial net increase in force over 90 s. This is likely due to a low local concentration of motor that does not permit productive sliding, or the bundle is in an unfavorable parallel orientation where the plus and minus ends of the filaments are aligned.
As the contents of the flow cell can be susceptible to degradation from the incident illumination and trapping laser, local heating on the slide over time, and generation of radical oxygen species, it is strongly advised to not use the same flow cell for more than 1 h. For maximum efficiency, it is suggested to have another assay incubating while acquiring data. Displacement/force trace can be exported from the optical trapping software into Excel, Matlab, Igor, or other data management programs for further filtering and analysis. Data that can be extracted from such optical trapping ensemble/bundle experiments include different types of force generation profiles (baseline, ramp/plateau) under varying assay conditions, velocity of force generation, maximum force generation, ensemble kinetic and stepping behavior through step sizes and dwell times between steps or teams of steps, as well as duty ratio. The user can also alter the assay conditions to compare how adding different types of myosin motors, adding actin binding proteins, or changing buffer conditions influence these ensemble force generation characteristics.
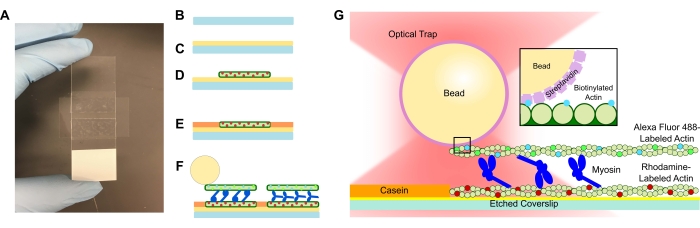
Figure 1: Assay schematic. (A–C) Etched coverslips are coated in poly-L-lysine and used to form the flow cell by using double-sided tape and a microscope slide. Timed introductions and incubation steps described in the protocol result in rhodamine-labeled phalloidin-stabilized actin as the template or bottom filament (D), followed by casein blocking to prevent non-specific binding (E), and (F) Alexa Fluor 488 phalloidin-stabilized biotinylated actin as the cargo or top filament, and teams of myosin II that slide the filaments apart and generate force when ATP is introduced. The geometry of the motors and nature of crosslinking within the bundle could vary under different conditions, such as salt concentration59. Previous studies have demonstrated that the myosin tail domain has the ability to interact with actin filaments and slow ensemble motility46. However, myosin heads in heavy meromyosin experiments demonstrate binding of each head to adjacent actin filaments60. (G) Streptavidin beads are used as the optical handle for the trap and bind solely to the cargo biotinylated actin filament, which aids in validating that proper bundles are formed on the slide. Please click here to view a larger version of this figure.
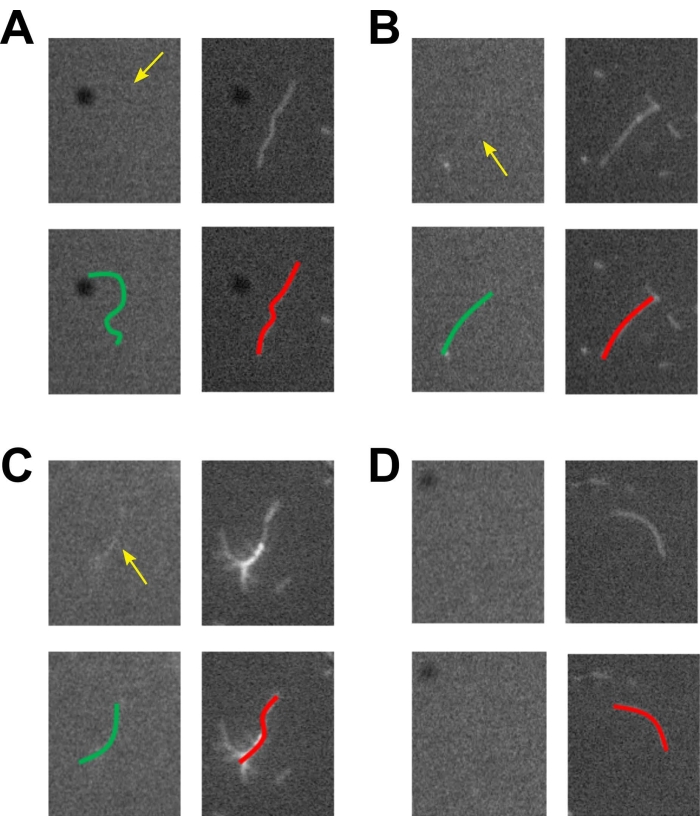
Figure 2: Fluorescent actomyosin bundles. Four different encounters of actin filaments and bundles within the bundle assay presented in Figure 1. The top cargo biotinylated actin filament with the Alexa Fluor 488 phalloidin channel is shown on the left, and the bottom template actin filament with the rhodamine phalloidin channel is on the right. At the bottom, the same figure is shown with colored lines overlaid to help guide the eye. (A) A top actin filament is found near a bottom actin filament but has an incomplete overlay. This would not be used for bundle experiments. (B) Top and bottom actin filaments are colocalized, and the intensity of each filament confirms that they are each single filaments within the bundle. This would be a good candidate for bundle experiments. (C) A large bundle of self-assembled rhodamine filaments is found on the bottom. While there is a corresponding top actin filament that is colocalized, there are too many bottom filaments present; thus, it would not be used for bundle experiments. This is also an example of how when multiple actin filaments of the same type are bundled, the fluorescence intensity increases. The user can utilize this as a gauge for judging single filaments versus bundles of the same filament type. (D) A bottom filament is present with no corresponding top filament, also confirming no bleedthrough. This would not be used for bundle experiments. We note that the intensity of the filaments in the Alexa Fluor 488 channel is low and believe it is due to the filter set that is being used (Filter Set 09 from Zeiss). The filter set used for the rhodamine channel is Filter Set 43 from Zeiss. Please click here to view a larger version of this figure.
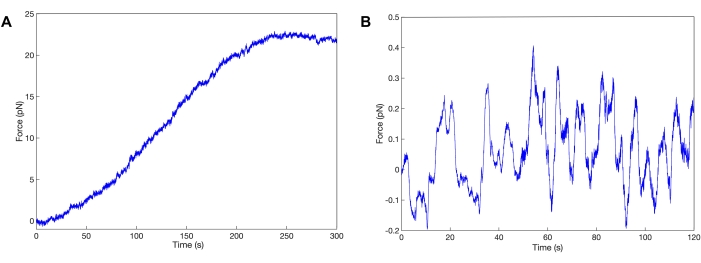
Figure 3: Myosin II ensemble force generation. Representative traces of skeletal myosin II motors generating force within the constructed in vitro actin structural hierarchy. The myosin motors are working together to collectively and productively generate force until a plateau is reached and force is sustained (A) or experience antagonization near baseline (B). Please click here to view a larger version of this figure.
Supplemental Figure S1: Bruker/JPK Nanotracker2 optical trap. (A) Computer monitor. (B) Computer keyboard. (C) Computer tower. (D) Controller box. (E) Laser power supply. (F) Optical trap optics box. (G) Inverted microscope. (H) Door to microscope stage. (I) Polarizer slider to switch between brightfield and differential interference contrast imaging. Please click here to download this File.
Supplemental Figure S2: Remote control for optical trap. (A) Keypad to position the motorized stage. (B–C) Adjust trap position. (D) A, X, and B switch on and off the main shutter, trap 1 shutter, and trap 2 shutter, respectively. (E) The Logitech button is used to wake up the controller. (F) The up and down buttons that are used to position the trapping objective. (G) The up and down buttons that are used to position the detection objective. Note that the remote control is not required, and all these manipulations can be accomplished in the software. However, it is convenient to be able to control the objectives and stage position while looking into the microscope stage environment. Please click here to download this File.
Supplemental Figure S3: Fluorescence module for optical trap. The 89North PhotoFluor fluorescence white light source is coupled to the back of the inverted microscope. It is turned on and off with a toggle switch (arrow). Please click here to download this File.
Supplemental Figure S4: Fluorescence filter cube turret. The turret (arrow) can be turned to use the filter cube necessary for imaging in DIC, rhodamine, or Alexa Fluor 488 dyes. Note that filter cubes can be switched out to customize the setup for using different fluorophores. Please click here to download this File.
Supplemental Figure S5: Nanotracker2 software. (A) Laser power button and control. (B) Objective positioning window. Directional arrows are used to move the detection (top) and trapping (bottom) objectives. Double arrows move the objectives at a higher speed. The blue and red button at the bottom-left uncouples the objectives and retracts them back to their original position. This is necessary for when taking samples in and out of the microscope stage. The third button from the left with the objectives and padlock icon "couples" the objectives so that when they are both in focus and achieve Kohler illumination, the user can move both the trapping and detection objectives up and down in the z-axis. (C) Sample positioning window used to move the microscope stage in the x- and y-axis. Double arrows move the stage at a higher speed. This window is activated by clicking the up/down and left/right arrow icon at the top menu. (D) Camera visualization window. The wrench icon can be used to set customized imaging conditions. This window is activated by clicking on the Camera icon at the top menu. (E) Microscope illumination window. This window is activated by clicking on the Light Bulb icon at the top menu. Please click here to download this File.
Supplemental Figure S6: Calibration window. (A)This window is used for bead calibration and is activated by clicking on the Cal icon at the top menu. To calibrate a bead, a best fit of the corner frequency is accomplished in the x, y, and z signals. (B) For each signal, choose the appropriate signal button in the top left. (C) Click on run and optimize the fit by clicking and dragging within the green window (D). (E) Once satisfied with the fit, click on Use It for sensitivity and stiffness. This will allow for recording displacement in nanometers and force in piconewtons. (F) Then, click on Accept Values at the bottom left. Repeat for the y and z directions. Please click here to download this File.
Supplemental Figure S7: Data Acquisition window. This window is used to acquire position and force data and allows the user to see the measurements in real time. (A) This window is activated by clicking the x,t icon at the top menu. (B) The user can switch between viewing the x and y signals. (C) Click on Start to begin visualizing data. Click on Autosave to save the data. Click on Start Record to begin recording and saving data. Please click here to download this File.
An in vitro study using optical tweezers combined with fluorescence imaging was performed to investigate the dynamics of myosin ensembles interacting with actin filaments. Actin-myosin-actin bundles were assembled using muscle myosin II, rhodamine actin at the bottom of the bundle and on the coverslip surface, and 488-labeled, biotinylated actin filaments on the top of the bundle. Actin protein from rabbit muscle was polymerized and stabilized using general actin buffers (GAB) and actin polymerizing buffers (APB). GAB and APB must be freshly prepared every day in the lab using ATP, FC buffer, and TC buffer. Muscle myosin II was used to form the actin-myosin-actin sandwiches. Phalloidin was used for fluorescent staining of the actin filaments, as well as stabilization in vitro.
Myosin activity can be confirmed by performing a standard gliding filament assay as published previously46,47. Myosin II and its subfragments can bind to the coverslip surface in a variety of orientations, and the presence of the tail domain can slow down filament sliding as compared to assays using heavy meromyosin46,48,49. However, gliding and surface movement can still be observed. A more apparent demonstration of myosin activity is active actin filament breaking that can be observed where longer actin filaments are broken into smaller fragments that then glide away in multiple directions. This occurs due to the high concentration of active motors on the surface, has been observed by multiple laboratories, and does not occur without active myosin motors present42,50,51,52,53,54. Further, the bundle assay presented here aids in alleviating motility issues that have primarily been associated with the gliding filament assay, such as the variety of motor binding orientations on a glass coverslip, because the bundle assay involves casein blocking of the glass surface so that motors bind within the bundle47,55,56.
The first step is to add rhodamine actin filaments as the bottom or template filament to a poly-L-lysine coated coverslip in a flow cell. Poly-L-lysine is used to promote actin binding since poly-lysine is positively charged while actin has negative charges and has been used in previous cytoskeletal in vitro assay preparations61,62,63. Before bundle formation, different actin dilutions were added to a flow cell to optimize the actin concentration. In this case, 600x from the stock was the optimal dilution that yielded a sufficient number of template filaments for bundle formation but with adequate spacing so that bundles were individualized. Dilution was carried out using the APB buffer. Adding rhodamine actin was followed by a layer of casein to block the surface and avoid non-specific binding. The flow cell was incubated for 30 min and washed after incubation with buffer to wash out any unbound actin filaments. Finally, a combination of myosin, 488/biotin actin, and streptavidin-coated beads were added to the flow cell to facilitate actin-myosin bundle formation. The bead concentration should be such that there are enough to bind surface-bound bundles and enough in suspension to facilitate calibration. However, too high of a bead concentration can cause difficulty during trapping experiments due to neighboring beads falling into the laser trap and disrupting measurement. Myosin motors are added to the combination right before injecting it to the slide so that the myosin motors do not preemptively aggregate with the cargo or top biotinylated actin filament and will thus bind the bottom rhodamine to bundle biotinylated actin filaments.
The NT2 optical trapping system is a commercial optical trap with combined brightfield, differential interference contrast (DIC), and epifluorescence imaging modalities. It is coupled with a Zeiss AxioObserver 3 inverted microscope with 100x/NA 1.46 and 63x/NA 1.0 water immersion trapping and detection objectives. The system is equipped with click and drag trapping capability of one laser trap and can be used while imaging in any of the listed modalities previously. The formed bundles are detected and confirmed by using fluorescence imaging. Having a white light source with appropriate filter cubes (GFP/FITC and TRITC/CY3) allows for rapid switching between filament imaging. Colocalized AFs were verified by visualizing the AFs at the different excitation wavelengths before taking each force measurement using optical tweezers. As the filaments can photobleach quickly even with an oxygen scavenging reagent, it is suggested that researchers optimize visualization parameters such as intensity and exposure time before performing the bundle experiments.
Optical trapping was employed to take the force measurements, using the streptavidin beads in the presence of ATP to bind the biotinylated cargo actin filament and activate myosin force generation as a force transducer. Displacement and force versus time data obtained by optical trapping were extracted from the trapping software for analysis. However, the commercial trapping software also provides analysis routines that can be utilized, or custom algorithms in other programs can be programmed by the user to visualize and analyze trapping data. On custom optical trapping systems, the user may have excitation lasers instead of a white light source with filters, which are also acceptable to use. Further, fluorescent dyes can be changed to be suited to the existing equipment a user may have if the emission spectra do not overlap and cause bleedthrough.
We note that the assay presented is a baseline assay that can be further customized by the user depending on their research question within the realm of actomyosin ensemble mechanics. The general workflow can also be applied to other in vitro cytoskeletal ensemble systems that may be of interest, such as microtubule bundle assays that form minimal models of mitotic spindle32,61,63,64,65,66. Modifications could include but are not limited to changing the fluorophore labels that are suited to the user's existing setup; altering myosin concentration, construct, or isotype; and titrating buffer conditions, among other aspects.
Potential challenges are possible when performing this assay. When forming the actin-myosin bundles, myosin concentration within the actin bundles may not be homogeneous across the slide. To accommodate this, multiple bundles across the entire slide will be measured to ensure that motor distribution and force generation profiles are properly sampled. It is also challenging to know bundle orientation if this is required for interpretation of force data. Thus, multiple trials should be taken for each bundle. One could also incorporate actin filament end labeling through fluorescent gelsolin or gelsolin-coated beads of a smaller size than the optical trapping handle. Fluorescence imaging can also be used to look at x and y component forces to deduce bundle orientation. Moreover, as myosin aggregation state is highly influenced by the ionic strength of the buffer with formation of thick filaments occurring upon rapid dilution of KCl, buffer salt concentration should monitored appropriately67,68.
Previous studies that used other in vitro methods such as gliding assays were helpful to identify the role of myosin domains and study the configuration and interactions between myosin and other actin binding proteins. However, these methods have a disadvantage in that binding myosin onto a rigid surface will limit the potential for coordination between myosin motors and thus mechanosensing feedback that occurs to determine whether the motor ensemble is in a high or low duty ratio mode33,35,41,69. Further, optical trapping with single-myosin motor networks does not give a clear understanding of how myosin motors interact with each other and with actin filaments. The protocol developed here allows for the investigation of myosin motor ensemble dynamics within a compliant, hierarchical actin network. It is also customizable in terms of motor-filament ensemble characteristics such as concentration, isoform, and buffer environment, among other aspects, to allow for systematic investigation. The presented protocol is a platform for future studies of more complex actomyosin networks and maintains the precision of displacement and force generation measurements facilitated by optical trapping that has traditionally been used for single-molecule studies.
The authors have nothing to disclose.
This work is supported in part by the University of Mississippi Graduate Student Council Research Fellowship (OA), University of Mississippi Sally McDonnell-Barksdale Honors College (JCW, JER), the Mississippi Space Grant Consortium under grant number NNX15AH78H (JCW, DNR), and the American Heart Association under grant number 848586 (DNR).
Actin protein (biotin): skeletal muscle | Cytoskeleton | AB07-A | Biotinylated actin protein |
Actin protein, rabbit skeletal muscle | Cytoskeleton | AKL99-A | Actin protein |
Alexa Fluor 488 Phalloidin | Invitrogen | A12379 | Actin stabilizer and Alexa Fluor 488 stain |
ATP | Fisher scientific | BP413-25 | Required for actin assembly and myosin motility |
Beta-D-glucose | Fisher scientific | MP218069110 | Part of oxygen scavenging system used to reduce photobleaching during fluorescence imaging |
Blotting Grade Blocker (casein) | Biorad | 1706404 | Used to block surface from non-specific binding |
CaCl2 | Fisher scientific | C79500 | Calcium chloride, provides the necessary control over the dynamics of actin myosin network |
Catalase | Fisher scientific | ICN10040280 | Part of oxygen scavenging system used to reduce photobleaching during fluorescence imaging |
Coverslips | Fisher scientific | 12544C | Used to make flow cells |
DTT | Fisher scientific | AC327190010 | Used for buffer preparation |
Ethanol | Fisher scientific | A4094 | Regent used for cleaning coverslips |
Glucose oxidase | Fisher scientific | 34-538-610KU | Part of oxygen scavenging system used to reduce photobleaching during fluorescence imaging |
KCl | Fisher scientific | P217-500 | Used for buffer preparation |
KOH | Fisher scientific | P250-1 | Used to etch coverslips and adjust buffer pH |
MgCl2 | Fisher scientific | M33-500 | Used for buffer preparation |
Microscope slides | Fisher scientific | 12-544-2 | Used to make flow cells |
Myosin II protein: rabbit skeletal muscle | Cytoskeleton | MY02 | Full length myosin motor protein isolated from rabbit skeletal muscle |
Nanotracker2 | Bruker/JPK | NT2 | Optical trapping instrument |
Poly-l-lysine | Sigma-Aldrich | P8920 | Facilities adhesion of actin filaments onto glass surface of the coverslip |
Rhodamine Phalloidin | Cytoskeleton | PHDR1 | Actin stabilizer and rhodamine fluorescent stain |
Streptavidin beads, 1 μm | Spherotech | SVP-10-5 | Optical trapping handle |
Tris-HCl | Fisher scientific | PR H5121 | Used for buffer preparation |