Mitophagy is the primary mechanism of mitochondrial quality control. However, the evaluation of mitophagy in vivo is hindered by the lack of reliable quantitative assays. Presented here is a protocol for the observation of mitophagy in living cells using a cell-permeant green-fluorescent mitochondria dye and a red-fluorescent lysosome dye.
Mitochondria, being the powerhouses of the cell, play important roles in bioenergetics, free radical generation, calcium homeostasis, and apoptosis. Mitophagy is the primary mechanism of mitochondrial quality control and is generally studied using microscopic observation, however in vivo mitophagy assays are difficult to perform. Evaluating mitophagy by imaging live organelles is an alternative and necessary method for mitochondrial research. This protocol describes the procedures for using the cell-permeant green-fluorescent mitochondria dye MitoTracker Green and the red-fluorescent lysosome dye LysoTracker Red in live cells, including the loading of the dyes, visualization of the mitochondria and the lysosome, and expected outcomes. Detailed steps for the evaluation of mitophagy in live cells, as well as technical notes about microscope software settings, are also provided. This method can help researchers observe mitophagy using live-cell fluorescent microscopy. In addition, it can be used to quantify mitochondria and lysosomes and assess mitochondrial morphology.
Mitochondria are the powerhouses of nearly all eukaryotic cells1,2. In addition to ATP production through oxidative phosphorylation, mitochondria play a vital role in other processes such as bioenergetics, calcium homeostasis, free radical generation, apoptosis, and cellular homeostasis3,4,5. As mitochondria generate reactive oxygen species (ROS) from multiple complexes in the electron transport chain, they are constantly stimulated by potential oxidative stress, which can eventually lead to structural damage and dysfunction when the antioxidant defense system collapses6,7. Mitochondrial dysfunction has been found to contribute to many diseases, including metabolic disorders, neurodegeneration, and cardiovascular disease8. Therefore, it is crucial to maintain healthy mitochondrial populations and their proper function. Mitochondria are highly plastic and dynamic organelles; their morphology and function are controlled by mitochondrial quality control mechanisms, including post-translational modifications (PTM) of mitochondrial proteins, mitochondrial biogenesis, fusion, fission, and mitophagy9,10. Mitochondrial fission mediated by dynamin-related protein 1 (DRP1), a GTPase of the dynamin superfamily of proteins, results in small and round mitochondria and isolates the dysfunctional mitochondria, which can be cleared and degraded by mitophagy11,12.
Mitophagy is a cellular process that selectively degrades mitochondria by autophagy, usually occurring in damaged mitochondria following injury, aging, or stress. Subsequently, these mitochondria are delivered to lysosomes for degradation10. Thus, mitophagy is a catabolic process that helps maintain the quantity and quality of mitochondria in a healthy state in a wide range of cell types. It plays a crucial role in the restoration of cellular homeostasis under normal physiological and stress conditions13,14. Cells are characterized by a complex mitophagy mechanism, which is induced by different signals of cellular stress and developmental changes. Mitophagy regulatory pathways are classified as ubiquitin-dependent or receptor-dependent15,16; the ubiquitin-dependent autophagy is mediated by the kinase PINK1 and the recruitment of ubiquitin ligase Parkin E3 to the mitochondria17,18, while receptor-dependent autophagy involves the binding of autophagy receptors to the microtubule-associated protein light chain LC3 that mediates mitophagy in response to mitochondrial damage19.
Transmission electron microscopy (TEM) is the most commonly used method, and still one of the best methods, to observe and detect mitophagy20. The morphological features of mitophagy are autophagosomes or autolysosomes formed by the fusion of autophagosomes with lysosomes, which can be observed from electron microscopy images21. The weakness of electron microscopy (EM), however, is the inability to monitor the dynamic processes of mitophagy, such as mitochondrial depolarization, mitochondrial fission, and fusion of autophagosomes and lysosomes, in the living cell20. Thus, evaluating mitophagy through imaging living organelles is an attractive alternative method for mitochondrial research. The live cell imaging technique described here uses two fluorescent dyes to stain mitochondria and lysosomes. When mitophagy occurs, damaged or superfluous mitochondria engulfed by autophagosomes are stained green by the mitochondrial dye, while the red dye stains the lysosomes. The fusion of these autophagosomes and lysosomes, referred to as autolysosomes, causes the green and red fluorescence to overlap and manifest as yellow dots, thus indicating the occurrence of mitophagy22. The cell-permeant mitochondria dye (MitoTracker Green) contains a mildly thiol-reactive chloromethyl moiety to label mitochondria23. To label mitochondria, cells are simply incubated with the dye, which diffuses passively across the plasma membrane and accumulates in active mitochondria. This mitochondria dye can easily stain live cells, and is less effective in staining aldehyde-fixed or dead cells. The lysosome dye (LysoTracker Red) is a fluorescent acidotropic probe used for labeling and tracking acidic organelles in live cells. This dye exhibits a high selectivity for acidic organelles and can effectively label live cells at nanomolar concentrations24.
The procedures for using these fluorescent dyes in living cells, including loading the dyes and the visualization of mitochondria and lysosomes, are presented here. This method can help researchers observe mitophagy using live-cell fluorescent microscopy. It can also be used to quantify mitochondria and lysosomes, and assess mitochondrial morphology.
1. Cell culture and passaging
NOTE: The protocol is described using routinely cultured mouse embryonic fibroblasts (MEFs) as an example.
2. Mitochondrial staining
3. Confocal imaging
4. Image analysis
MitoTracker Green is a green-fluorescent mitochondrial stain that is able to accurately localize to mitochondria. The dye can easily stain live cells and is less effective in staining aldehyde-fixed or dead cells (Figure 2). The red-fluorescent lysosome dye LysoTracker Red is capable of labeling and tracking acidic lysosomal organelles and can only stain live cells (Figure 2). Confocal microscope imaging allows the visualization of mitochondria and lysosomes stained with the appropriate dyes (Figure 1 and Figure 2).
Mitophagy is a catabolic cellular process that selectively degrades mitochondria by autophagy, which usually occurs in damaged mitochondria after injury, aging, or stress20. Subsequently, these mitochondria are delivered to lysosomes for degradation. Mitophagy helps maintain the quantity and quality of mitochondria in a healthy state in a wide range of cell types. In healthy mammalian cells, mitophagy occurs infrequently, and therefore other stimuli are required to induce this process25. Carbonyl cyanide-4 (trifluoromethoxy) phenylhydrazone (FCCP), a mitochondrial uncoupler, is a nonspecific ionophore that causes a severe loss of mitochondrial membrane potential within minutes, alteration of intracellular pH, and subsequent mitophagy26,27. In this study, FCCP was used to trigger mitophagy in MEF cells for confocal imaging. When damaged green-stained mitochondria are engulfed by red-stained lysosomes, the green and red fluorescence overlap to reveal yellow co-localized mitochondria-lysosomes (Figure 3). The yellow dots in Figure 3D and Figure 4B correspond to these co-localized mitochondria-lysosomes, representing ongoing mitophagy, and thus can be counted to evaluate the extent of mitophagy (Figure 4).
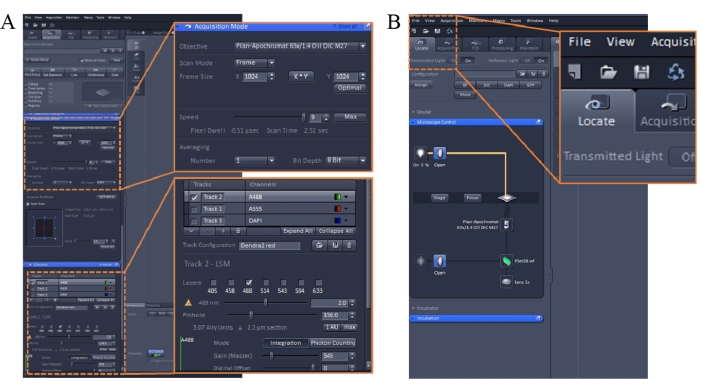
Figure 1: Imaging parameters of the confocal microscopy imaging software. Please click here to view a larger version of this figure.
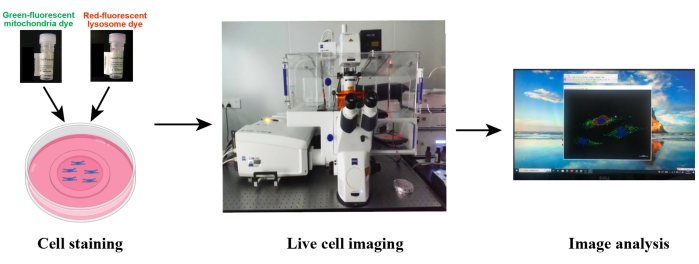
Figure 2: Schematic illustration of the confocal imaging of live cells. The live cells are co-stained with the green-fluorescent mitochondrial dye and red-fluorescent lysosomal dye, and then the live cells are imaged using confocal microscopy. Image processing and data analysis was performed using the microscope-associated imaging software or Image J. Please click here to view a larger version of this figure.
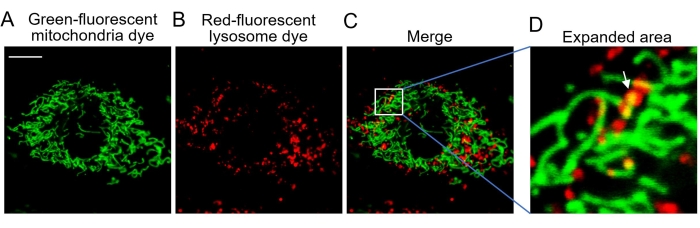
Figure 3: Confocal imaging of live cells. (A) Representative images of cells stained with the green-fluorescent mitochondria dye show the mitochondria. (B) Representative images of cells stained with the red-fluorescent lysosome dye showing the lysosome. (C) Merged image of both fluorescent dyes. (D) Expanded area showing mitophagy. The white arrow indicates green mitochondria engulfed by red lysosomes. Abbreviation: Ex = excitation wavelength. The green-fluorescent mitochondria dye is excited at 488 nm with emission collected at 505-545 nm. The red-fluorescent lysosome dye is excited at 543 nm with emission collected at >560 nm. Scale bars = 10 µm. Please click here to view a larger version of this figure.
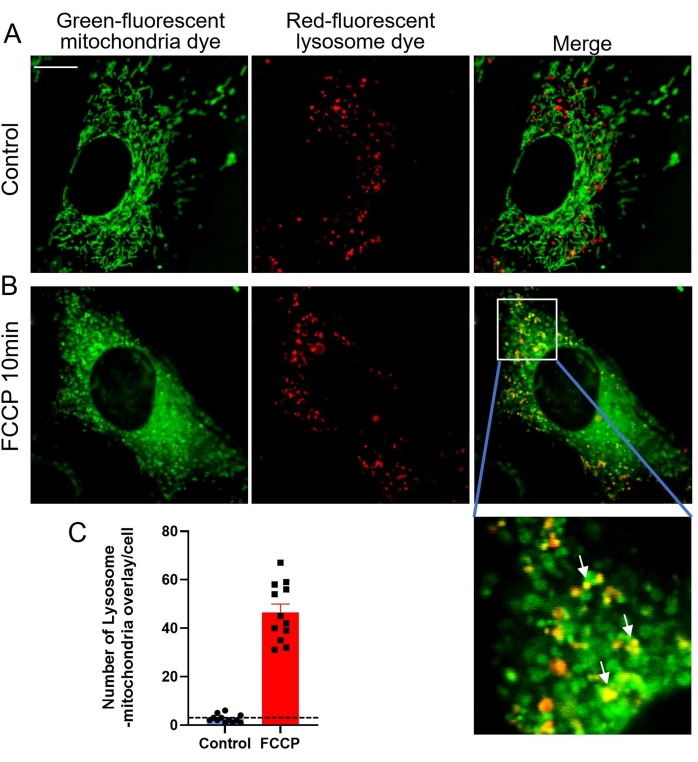
Figure 4: Mitophagy triggered by FCCP stimulation. (A) Representative images of cells co-stained with the green-fluorescent mitochondria dye and the red-fluorescent lysosome dye. (B) Representative images of cells treated with 1 µM FCCP for 10 min. The white arrow indicates green mitochondria engulfed by red lysosomes. (C) Quantitative data of mitophagy indicated by lysosomal-mitochondria overlay. Data are mean ± SEM, n = 8 cells. *p < 0.05 versus control. Scale bars = 10 µm. Please click here to view a larger version of this figure.
The protocol described here provides a method for evaluating and monitoring the dynamic process of mitophagy in living cells, involving autophagosomes, lysosomes, and mitochondrial fission, through co-staining with cell-permeant mitochondria and lysosome dyes. The method can also be used to identify mitochondria and assess mitochondrial morphology. Both dyes used in this study should be protected from light, multiple freeze-thaw cycles should be avoided, and the dyes should be stored in single-use aliquots as much as possible. It is recommended to prepare working solutions of the dyes to avoid adding them directly to the cell culture medium, which may result in high local concentrations and inadequate mixing of the dyes. To avoid staining other cellular structures, the MEF cells should be stained for 30 min prior to imaging with the confocal microscope. It is recommended to perform the staining procedure immediately before imaging. In MEF cells, both mitochondria and lysosome dyes at 1 µM are well localized in mitochondria and lysosomes, respectively, with higher dye concentrations resulting in cytotoxicity as well as nonspecific staining of other cellular structures. This concentration is also optimal for staining mitochondria and lysosomes in H9C2 cells. For other cell lines, the dye concentration and staining time that allow the dye to localize well to the organelles need to be optimized. To obtain clear images of mitochondria and lysosomes, the image collection parameters (see the note in step 3.3) must be adjusted conscientiously. Cell confluence at 50%-60% is crucial to obtain individual live cell images, and therefore cells must be counted before seeding. If the lab does not have confocal dishes, circular coverslips can be used as an alternative. In some animal studies, especially in clinical examinations, it is difficult to detect mitophagy in animal living tissue samples due to the lack of reliable and convenient quantitative experiments to study mitophagy. Nevertheless, mitophagy in cells isolated from animal tissues can be assessed using the protocol described here. A limitation of this method is that although both dyes can easily stain live cells, they are less effective in staining dead or aldehyde-fixed cells.
In addition to the dyes used in this study, other mitochondria and lysosome tracers, such as MitoMM1/2 and LysoKK, respectively, are currently available to researchers for evaluating mitophagy28,29. While MitoMM1/2 can stain mitochondria in paraformaldehyde-fixed cells or tissues, it cannot directly assess mitophagy and requires double staining with a specific antibody, such as anti-LC3B, to detect mitophagy. Since LysoKK can only stain live cells, the combination of these dyes can also only detect mitochondrial autophagy in live cells28,29. Nevertheless, MitoMM1/2 is easy to use and allows the use of TRITC filter (as it does not show excitation when using a blue laser and does not produce green emission). LysoKK can stain organelles within 5 min, facilitating the rapid monitoring and assessment of numerous stimuli28,29.
Mitophagy occurs in cells via a complex mechanism, which is induced by different cellular stress signals and developmental changes. FCCP, a potent uncoupler of mitochondrial oxidative phosphorylation, is a nonspecific ionophore26 that was used to induce mitophagy in this study. FCCP (1 µM) interferes with the proton gradient by transporting protons across the inner mitochondrial membrane, a process that causes a change in intracellular pH. Thus, FCCP can cause a severe loss of mitochondrial membrane potential within minutes and then induce mitochondrial autophagy by recruiting Parkin and microtubule-associated protein light chain 3 (LC3) to the mitochondria26,27,30. Mitophagy regulatory pathways are classified as ubiquitin-dependent (PINK1-parkin-mediated) or receptor-dependent (mediated by LC3 and other receptors)15,16. Mitophagy has been studied using specific antibodies that bind to key molecules in the receptor-dependent autophagic pathway, such as LC3B, followed by co-staining with red fluorescent lysosome dye31,32. Although it is difficult to differentiate between these two pathways using the dyes employed in this protocol, they offer a simple method to evaluate the extent of mitophagy in living cells and assess mitochondrial morphology.
The authors have nothing to disclose.
This work was partially funded by the National Key Research and Development Program of China (2017YFA0105601, 2018YFA0107102), the National Natural Science Foundation of China (81970333,31901044,), and the Program for Professor of Special Appointment at Shanghai Institutions of Higher Learning (GZ2020008).
Automated cell counter | Countstar | IC1000 | |
Cell counting chamber slides | Countstar | 12-0005-50 | |
Dulbecco's modified Eagle medium (DMEM) | Corning | 10-013-CV | |
Dulbecco's phosphate-buffered saline (DPBS) | Corning | 21-031-CVC | |
Glass bottom cell culture dish (confocal dish) | NEST | 801002 | |
Image J (Rasband, NIH) | NIH | https://imagej.nih.gov/ij/download.html | |
Krebs–Henseleit(KHB) buffer | Self-prepared | ||
LysoTracker Red | Invitrogen | 1818430 | 100 µmol/L, red-fluorescent lysosome dye |
MitoTracker Green | Invitrogen | 1842298 | 200 µmol/L stock, green-fluorescent mitochondria dye |
Mouse Embryonic Fibroblasts | Self-prepared | ||
Objective (63x oil lens) | ZEISS | ZEISS LSM 880 | |
Trypsin-EDTA 0.25% | Gibico | Cat# 25200056 | |
ZEISS LSM 880 Confocal Laser Scanning Microscope | ZEISS | ZEISS LSM 880 | |
ZEN Microscopy Software 2.1 (confocal microscope imaging software) | ZEISS | ZEN 2.1 |