La prueba de asociación implícita
English
Condividere
Panoramica
Fuente: Julian Wills & Jay Van Bavel, Universidad de Nueva York
Uno de los constructos fundamentales en la psicología social es la idea de una actitud hacia un objeto o persona. Tradicionalmente, los psicólogos miden actitudes por simplemente preguntar a la gente a uno mismo-informe sus creencias, opiniones o sentimientos. Este enfoque tiene limitaciones, sin embargo, la medición de actitudes socialmente sensibles, como los prejuicios raciales, porque las personas a menudo son motivadas a uno mismo-informe sin prejuicios creencias igualitarias (a pesar de que las asociaciones negativas). Para evitar este sesgo de deseabilidad social, los psicólogos han desarrollado una serie de tareas que tratan de medir las actitudes implícitas que son menos susceptibles de control deliberado (y distorsión posibles).
El Test de asociación implícita, o UAI, es una de las medidas más influyentes de estas actitudes inconscientes. El IAT se introdujo en un papel 1998 por Anthony Greenwald y sus colegas. 1 este video mostrará cómo llevar a cabo la IAT utilizada en el experimento final, donde los participantes americanos europeos (informe de la OMS expresas actitudes igualitarias) exhiben preferencias implícitas para su propia raza.
Procedura
Risultati
This procedure typically results in considerably slower responses during Black/pleasant compared to White/pleasant trials (Figure 1). Since slower responses are interpreted to reflect more difficult associations, this longer relative latency (i.e., delay) suggests an implicit attitudinal preference for White over Black. That is, subjects typically find it more challenging to associate Black faces with pleasant nouns. Moreover, when exclusively analyzing responses from White participants, for instance, they often self-report egalitarian preferences (i.e., no preference for either White or Black), despite IAT scores that reveal a strong implicit preference for White over Black (Figure 2).
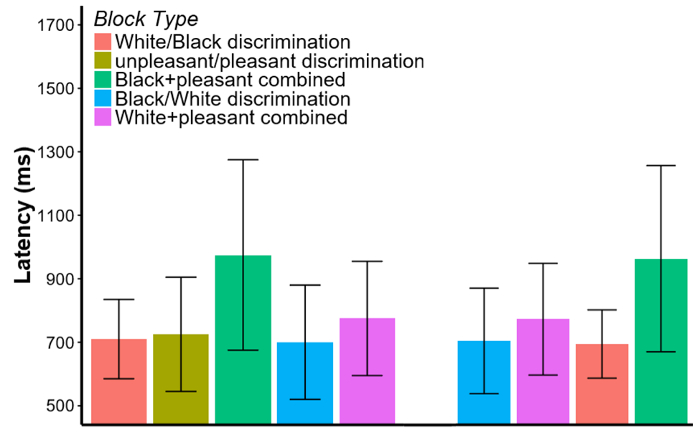
Figure 1. A typical outcome of the Implicit Association Test. White subjects who performed the Black/pleasant block first. The mean reaction time scores (untransformed) are displayed on the y-axis with error bars equal to one standard deviation. Although the reaction times are log transformed for the analysis, the untransformed scores are displayed for easier interpretation. The x-axis displays the order in which these subjects encountered these blocks. This figure was adapted from Greenwald, McGhee, and Schwartz.1
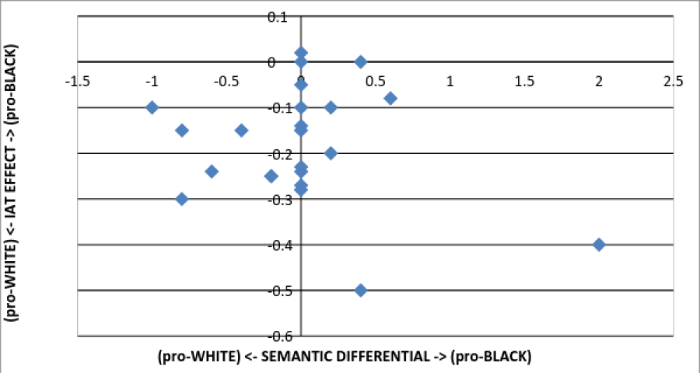
Figure 2. Relationship of IAT scores to explicit preferences among White participants. The IAT effects scores are displayed on the y-axis with positive scores indicating pro-Black preferences, negative scores indicating pro-White preferences, and zero indicating no differential preference. The semantic differential scores are displayed on the x-axis with positive scores indicating pro-Black preferences, negative scores indicating pro-White preferences, and zero indicating no differential preference. Virtually all White participants that report an explicit pro-Black or egalitarian (i.e., score of zero) semantic preference also show a pro-White preference on the IAT. This figure was adapted from Greenwald, McGhee, and Schwartz.1
Applications and Summary
Since the original paper, the IAT has been extended to examine prejudice in many other domains, such as gender, religion, and sexuality.4 In addition, the IAT has been adapted to (1) dissociate implicit attitudes from stereotypes, (2) measure self-esteem by pairing self/other with pleasant/unpleasant words, and (3) reveal implicit attitudes in children. In some cases, the IAT provides better predictive validity than self-report measures, such as discrimination and suicidal behavior.5
One of the reasons it has become so influential is that it had been made available online at a website called Project Implicit (https://implicit.harvard.edu/implicit/) where anyone can participate in multiple versions. Millions of people have now completed the measure and they have received immediate feedback on how their own implicit preferences compare to other people who have completed the test. The research on implicit bias has had massive implications outside the field of psychology, and implicit bias training is now common in major organizations, governmental agencies, and police departments.
Riferimenti
- Greenwald, A. G., McGhee, D. E., & Schwartz, J. L. (1998). Measuring individual differences in implicit cognition: the Implicit Association Test. Journal of personality and social psychology, 74, 1464.
- McConahay, J. B., Hardee, B. B., & Batts, V. (1981). Has racism declined in America? It depends on who is asking and what is asked. Journal of Conflict Resolution, 25, 563-579.
- Wittenbrink, B., Judd, C. M., & Park, B. ( 1997). Evidence for racial prejudice at the implicit level and its relationship with questionnaire measures. Journal of Personality and Social Psychology, 72, 262-274.
- Nosek, B. A., Smyth, F. L., Hansen, J. J., Devos, T., Lindner, N. M., Ranganath, K. A., Smith, C.T., et al. (2007). Pervasiveness and correlates of implicit attitudes and stereotypes. European Review of Social Psychology, 18, 36-88.
- Nock, M. K., Park, J. M., Finn, C. T., Deliberto, T. L., Dour, H. J., & Banaji, M. R. (2010). Measuring the suicidal mind: implicit cognition predicts suicidal behavior. Psychological Science, 21, 511-517.
Trascrizione
Asking someone to say what’s on their mind can be disconnected from the beliefs that they are willing to discuss or are even knowingly aware of.
While traditional methods often ask individuals to report on their own attitudes—say to evaluate personal feelings about members of a stigmatized group—their opinion is explicit, involving deliberate thought.
Because the topic is sensitive, people are more likely to state unprejudiced, egalitarian views and portray themselves positively even though they may truly harbor negativity.
To circumvent this social-desirability bias, implicit attitudes—evaluations that occur outside of conscious awareness and control—must be examined.
This video demonstrates how to conduct the Implicit Association Test—an influential measure for investigating the strength of associations between a concept like race and automatic evaluations based on the original work of Greenwald and colleagues.
In this experiment, European American participants are recruited to establish out-group homogeneity. They are shown pictures and words—associated with either a particular race or attribute—and asked to quickly and accurately sort them across five different blocks.
The catch is that the stimuli appear in rapid succession—without time for participants to explicitly process them—hence, the name Implicit Association Test.
In the first block of trials, concept discrimination, the initial targets—faces of White European or Black African origin—are randomly presented, without replacement.
If the face shown is White, participants should press the key corresponding to “White”. The first half are considered practice trials, and not saved, as errors are expected while participants get used to responding quickly.
Likewise, for Block 2—attribute discrimination—participants are exposed to only “good” and “bad” words. That is, if “horrible” appears, the correct reply would be a keypress corresponding to “bad”. Thus, the first two blocks serve as baseline latencies associated with correct responses.
During Block 3—the combined portion—either images or words are shown with a race and attribute paired to one response key. Participants must now decide whether the presented face or word like “fabulous” corresponds with “Black or Good” or “White or Bad”.
Block 4—the reversed concept discrimination—is a repeat of Block 1 except that the computer keys for “Black” and “White” are flipped. With this block, participants adjust to the keypresses for the new “Black/White” correspondences.
Finally, Block 5—reversed combined—is similar to Block 3 except that Race is flipped across attributes, such that “Black or Bad” and “White or Good” are now paired on the same response key. Implicit preferences should be observed in latency differences compared to Block 3.
The dependent variable then is the latency to react across block types. Participants are expected to sort faster when good words and White faces go with the same key compared to the opposite, good and Black. Thus, reaction times reveal the strength of each participant’s implicit preference, which agrees with a stereotypical bias.
In addition, the responses can be log-transformed and compared to self-reported attitudes provided on a race-related questionnaire given after the task has been completed.
In this case, if participants’ biases are indeed unspoken, it’s hypothesized that the self-reported beliefs will not correlate to the scores identified during the Implicit Association Test, thus revealing a form of social-desirability.
Before starting the experiment, conduct a power analysis to determine the appropriate number of participants—specifically of European-American descent—that are required.
To begin, greet each one in the lab, explain they will be sorting images and words over several blocks of trials, and have them sign a consent form to participate.
Seat the participant in front of a computer. Further explain that they are to classify, as quickly and accurately as possible, the word or image that appears on the screen by pressing “E” if it fits the category on the left or “I” for the right side. Answer any questions and leave the room.
Start Block 1 by pressing the spacebar. During this initial phase, notice that participants are merely responding to classify faces based on the race anchors Black and White over the course of 100 trials.
Proceeding to Block 2, associated attribute discrimination, observe that now only the list of words and the valence anchors good and bad serve as the classification choices for another 100 trials.
Upon progressing into Block 3, the initial combined task, either images or words appear—but are now paired onto one response key—for a total of 200 trials.
Block 4, reversed target-concept discrimination, is related to Block 1, except that the race anchors now appear on the opposite side for 100 trials.
Finally in Block 5, the reversed combined segment, notice that participants again classify faces and words with combined anchors but the attributes are flipped compared to Block 3.
Following the Implicit Association Test, explain that there are some additional questionnaires to complete on the computer. Emphasize that they will have complete privacy, and then leave the room.
Allow participants enough time to complete the surveys. To conclude, return for debriefing and thank them for taking part in the study.
To visualize the data, plot the mean trial latencies across block type. See the manuscript for details on recoding reaction times.
Notice that responses were slower for the Black/good trials as compared to the White/good ones. Slower responses reflect more difficult associations, suggesting European-American participants found it challenging to associate Black faces with pleasant nouns. In other words, they exhibited an implicit attitudinal preference for the White anchor over the Black anchor.
Also for each participant, compute an index of the Implicit Association Effect by first log transforming the reaction times and then subtracting the means in Block 3 from Block 5. A positive score reflects an automatic preference for Black, whereas a negative one reveals an inclination for White.
Compare these indexes with the semantic differential score calculated by averaging the explicit ratings on the final questionnaire. Here, a value of zero indicates a self-reported egalitarian preference—no race bias.
Results show that most participants did self-report egalitarian preferences despite their IAT scores revealing a moderate to strong implicit preference for White over Black. These results suggest that a social-desirability bias may have distorted their responses to the questionnaire.
Now that you are familiar with how the Implicit Association Test can examine automatic bias and prejudice for socially sensitive topics, let’s look at other real-life situations where the task can be applied.
Researchers have published the Implicit Association Test on the internet allowing anyone to participate, on a number of topics, including social attitudes and mental health. Participants receive immediate feedback on their implicit preferences, providing a straight-forward approach for examining their own beliefs and biases in the comfort of their own home or office.
Other researchers have used the task to measure self-esteem by pairing self/other with pleasant/unpleasant words. These tests can see through any fa¸ade or deception leading to better success with interventions and treatment.
Lastly, children are notoriously difficult to get reliable information from, especially when asked to self-report measures. For this reason, researchers use Implicit Association Tests to assess young attitudes and beliefs, ranging from versions that investigate preferences towards race, gender, and even healthy-eating behaviors.
You’ve just watched JoVE’s video on the Implicit Association Test. Now you should have a good understanding of how to design and execute an experiment using Implicit Association tests, how to analyze and assess the results, as well as how to apply the principles to a number of real-world situations.
Thanks for watching!