Summary

通过总内部反射荧光显微镜与数量和亮度分析相结合,活细胞中细胞表面受体的显微化动力学

Published: November 06, 2019
doi:

Summary

我们描述了一种成像方法,用于测定由活细胞血浆膜中的配体结合诱导的mEGFP标记受体寡聚体的平均寡聚状态。该协议基于总内部反射荧光 (TIRF) 显微镜与数字和亮度 (N&B) 分析相结合。

Abstract

尽管受体寡聚的重要性和普及性,但很少方法适用于检测聚类事件和测量聚类的程度。在这里,我们描述了一种成像方法,以确定活细胞膜中mEGFP标记受体同质复合物的平均寡聚状态。该协议基于总内部反射荧光 (TIRF) 显微镜与数字和亮度 (N&B) 分析相结合。N&B 是一种类似于荧光相关光谱 (FCS) 和光子计数直方图 (PCH) 的方法,该方法基于对荧光团荧光强度波动的统计分析,该分析在照明中扩散出来在观察时间内的体积。特别是,N&B是PCH的简化,以获得关于寡聚混合物中蛋白质平均数量的信息。强度波动幅度由荧光的分子亮度和照明体积内的平均荧光量来描述。因此,N&B只考虑振幅分布的第一个和第二个时刻,即平均强度和方差。这同时也是方法的强弱。由于只考虑了两个时刻,N&B无法确定混合物中未知寡聚物的摩尔部分,但它仅估计混合物的平均寡聚状态。然而,只需监测荧光强度的时间波动,即可应用于相对较小的时间序列(与其他瞬时方法相比),以逐像素为基础。它将每像素的有效时间缩短到几微秒,允许在秒到毫秒的时间内采集,这是快速寡头化动力学所必需的。最后,可以探索大细胞区域以及亚细胞隔间。

Introduction

我们描述了一种总内部反射荧光数和亮度(TIRF-N&B)成像方法,用于确定活细胞血浆膜上受体分子的平均寡聚状态,旨在连接受体组件蛋白质的生物功能动力学(图1)。

在细胞外配体结合时,受体根据其构象、寡聚物、潜在的共受体和膜组成启动细胞内信号转导。尽管受体寡聚的重要性和普及性,在细胞信号1,2,3,4,5,6中被确认为关键事件,7、少数方法可以检测聚类事件,并实验性地测量聚类的程度8,9。共聚焦体积(x,y = 300 nm,z = 900 nm)不足以证明分子相互作用和化学测量,即使在通过图像恢复算法10进行优化后也是如此。蛋白质寡聚物的亚单位组成不能在纯粹的空间基础上解决,即使超分辨率的方法在x,y分辨率为20-70nm,如PALM11,STORM12和STED13。此外,它们的时间分辨率(按每个图像的分钟数顺序)不能跟随秒范围内的动力学。单分子步进漂白只有在蛋白质寡聚物不可移动才能解决其化学计量。

测量单个图像中荧光标记蛋白的密度和寡头化的最通用方法之一是空间强度分布分析 (SpIDA),它依赖于空间采样。它适用于化学固定和活细胞,并允许使用标准荧光显微镜15同时分析细胞的几个感兴趣的区域。或者,电矩方法,如荧光相关光谱(FCS)16、光子计数直方图(PCH)17和数和亮度(N&B)18、19,适用于定量寡聚子测量。这些方法分析荧光强度波动,当荧光光道在照明体积中扩散时,可以及时观察到。强度波动的振幅可以通过荧光荧光(+)的分子亮度和照明体积17(图2)内的平均荧光量(n)来描述。通常,荧光的扩散系数和照明体积内的分子平均数量(与G(0)值成反比,可以通过FCS20获得。然而,由于扩散时间只与质量的立方根量一起缩放,FCS对检测分子质量21的变化不够敏感。在实践中,单色FCS不能检测膜受体的二分化。PCH 可准确分解不同寡聚物的混合物。使用两个以上振幅分布的瞬间,它检测占据相同照明体积的不同亮度的分子。扫描FCS22和开发,如有趣的分子亮度(pCOMB)方法23的对相关性,介绍了扩大荧光相关方法在生物系统中的适用范围24,仍然是单点方法,缺乏在单元大面积进行快速测量的能力,需要在每个像素上连续进行多次观测,数据采集需要秒数。

N&B 是 PCH 的简化版本,它仅考虑荧光分布振幅的第一个和第二个矩,即平均强度、和方差,#2图 218,19因此,它不能确定混合物中未知寡聚物的摩尔分数,而只能估计混合物的平均寡聚状态。然而,N&B 的优势是,只需通过监测荧光强度的时间波动,即可逐像素处理比 PCH 更小的活细胞图像时间序列。由于 N&B 可将每像素的时间缩短到几微秒,因此它可以在大型单元区域上遵循快速的寡聚动力学,从而允许在栅格扫描显微镜(例如,共聚焦、2 光子)和毫秒内以秒的时间量采集图像基于相机的显微镜(例如,TIRFM)。

几份报告已经证明了N&B通过成像扩展细胞区域来量化蛋白质簇中亚单位数量的能力。在CHO-K1细胞25的粘附位处检测到帕西林-EGFP簇,COS-7细胞26中描述了致病性Httex1p肽的细胞内聚集。N&B应用于对ErbB受体27的配体驱动寡聚,以及配体FGF21对克洛托布(KLB)和FGFR1c在HeLa细胞28中的影响。TIRF成像和N&B分析相结合,表明dynamin-2主要是整个细胞膜29的四分之二。我们应用N&B在栅格扫描和TIRF图像,以证明配体驱动的uPAR和FGFR1细胞膜受体的二分化30,31。

荧光相关方法,如N&B、FCS和PCH,基于这样一种概念,即在开卷中,粒子的占用数量遵循泊森分布。因为只有荧光光素可以检测到,因此测量的荧光强度与图像像素中的时间平均值是照明体积 n 和其中平均荧光量数的成因。分子亮度,Φ17

其中 α 表示为当分子处于照明体积中心时,每个分子每单位时间发射的光子数(通常为每秒)。

亮度是给定采集中每个荧光光的特性,而强度是所有荧光光道贡献的总和。在生物竞赛中,亮度会随着一起波动的荧光量的增多而增加,从而提供有关荧光标记蛋白的寡聚状态的信息。给定像素的波动幅度由荧光信号的方差测量,±2

其中强度平方的平均值和强度平均值的平方是从每个帧的每个像素中的单个强度值计算的:

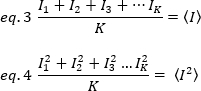
其中K是时间序列中的总帧数。在实验中,有必要计算整个图像序列的方差,该方差描述单个图像每个像素围绕平均强度值的散射。方差包括不同来源的所有波动。在第一个近似值中,由于探测器拍摄噪声的偏差,照明体积中的扩散粒子[20]的方差可以从方差中分离出来,因为探测器的拍摄噪声为 ± 2d。这两个方差是独立的;因此,总方差由其总和给出:

由于检测体积的分子波动,方差与分子亮度和强度呈线性关系:

根据 eq. 1 重新排列 eq. 6:

根据荧光相关光谱中的典型概念,方程7指出,波动次数引起的方差取决于粒子亮度的平方。

然后,探测器波动引起的方差是检测强度的线性函数,假设探测器的运行量低于其饱和度限制19

对于光子计数检测器,则±1c=0,因此检测器方差等于平均强度:

为了将这些概念应用于活细胞中的实际测量,Gratton 及其同事18将每个像素的表观亮度 B 定义为方差与平均强度的比率:

B 是实验测量的参数。在这项工作中,由TIRF显微镜捕获HeLa细胞血浆膜上的FGFR1受体的时间序列图像,通过N&B分析确定平均表观亮度B。然后,在添加FGF2后,连续时间序列被捕获,以跟随在用规范配体刺激受体后膜表面受体分子的自组装的变化。

但是,由于 TIRF 显微镜的探测器是 EMCCD 摄像机,因此表面亮度的表达式需要修改为19

其中偏移是检测器设置特征的检测电子的强度偏移。模拟探测器的方差和平均强度分别由:

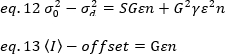
其中 G 是数字电平 (DL/光子) 中的模拟增益,S,每光子19的数字电平,由强度斜率与具有恒定强度(无时态波动)的光源的方差图给出。α 系数与像素检测体积的形状有关。根据Hassler等人32,在检测摄像机19的最大增益下工作的TIRF成像的β系数等于0.3。偏移、S 和 G 参数是相机和显微镜的特性。视界亮度 B 是通过根据 eq. 12 和 13 重新排列 eq. 11 获得:

实验上,α是激光强度和系统检测效率的复杂函数。然而,由于 B/S 线性依赖于 α,因此确定给定检测模式的 α 的相对值非常重要:

其中[‘与 ______________________不过,校准是使用内部参考执行的。

Protocol

1. 样品制备 第1天。种子HeLa细胞在玻璃底培养皿中,浓度为100,000-200,000细胞/mL。种子6-8复制菜肴。注:在此示例中,该介质辅以 10% 热灭活胎儿牛血清 (FBS)、1 mM 丙酸钠、100 U/100 μg 青霉素/链霉素。准备了几道复制菜肴。 第2-3天当细胞处于亚汇合时,在无血清培养基中转染一半与蛋白质粒的菜肴,用参考质粒(单体和二分体)转染一半。注:转?…

Representative Results

图5和补充表1显示了同一培养皿中两个代表性的HeLa-mEGFP-FGFR1细胞的结果。在添加FGF2配体后,在0分钟(图5A,上图)和7分钟(图5A,底部)捕获两个细胞。 图5还显示了两个代表性的HeLa细胞的结果,?…

Discussion

N&B 在选择细胞模型和标签策略时需要采取若干预防措施。它只能应用于在图像捕获期间保持稳定粘附的活细胞。由于整个细胞刚性位移引起的额外波动,可以通过适当的图像恢复方法38来处理。然而,一般当细胞移动时,细胞膜也会变形,结构变形,产生较大的额外方差,对膜蛋白的分析造成严重限制。在这项工作中,荧光结构在HeLa细胞系中表达,因为构成FGFR1可以忽略不计。?…

Divulgazioni

The authors have nothing to disclose.

Acknowledgements

CNIC由Ciencia、创新与大学部和Pro CNIC基金会支持,是塞韦罗·奥乔亚卓越中心(SEV-2015-0505)。我们还得到欧洲区域发展基金(FEDER)”欧洲区域发展基金”的支持。UC 感谢意大利癌症协会、国际癌症研究协会(现称全球癌症研究)和意大利卫生部的支持。A.T. 感谢”伦巴第大区万达松银行”部分支持他与PV奖学金”Progetto专业+ 伊万诺贝奇”2011-2012年的工作。

Materials

3-Colour Fast TIRF Leica AM TIRF MC inverted microscope, with smi-automatic TIRF alignment. The microscope is equipped with a diode 488 nm laser, a 100×1.46 oil TIRF objective, Ex/Em Bandpass filters at 490/20 and 525/50, temperature/CO2 incubator and Andor DU 8285 VP EMCCD camera. The microscope is operated by Leica LIF software. Leica Microsystems, Wetzlar, Germany
Albumin from Bovine Serum 98% minimun Sigma-Aldrich, St. Louis, MI, USA A7906-100G
DMEM without Phenol Red with 25 mM HEPES GIBCO Thermo Fisher Scientific,Waltham, MA, USA 21063029 Used serum free for microscopy
DMEM high-glucose GlutaMAX I GIBCO Thermo Fisher Scientific,Waltham, MA, USA 10566-016 Used for complete medium
Dulbecco's Phosphate Buffered Saline 10x (PBS) Biowest, Nuaillé, France X0515-500
Emission splitting system Photometrics DV2 TeledynePhotometrics, Tucson, AZ, USA
Fetal Bovine Serum, qualified, Brazil GIBCO Thermo Fisher Scientific,Waltham, MA, USA 10270106 10% inactivated supplement for complete medium
Glass bottom 35-mm sterile 1.5 dishes MatTek, Ashland, MA, USA P35G-0.170-14-C uncoated, glass thickness 0.17 microns
GraphPad Prism GraphPad Software Inc., San Diego, CA, USA
Human cervical carcinoma (HeLa), serum-free animal component (AC) cells Millipore-Sigma ECACC, Darmstadt, Germany CB_08011102
iXonEM+ 897 EMCCD (back-illuminated) ANDOR camera controlled by ANDOR Solis software Oxford Instruments, Andor TM Technology, Abingdon-on-Thames, UK This camera, installed in an additional port of the microscope, is used for acquiring the N&B time series
Matlab Executable N&B routine Unit of Microscopy and Dynamic Imaging, CNIC, Madrid, Spain download at https://www.cnic.es/en/investigacion/2/1187/tecnologia
MatLab v.2018b The MathWorks, Inc. Natick, MA, USA download at https://www.mathworks.com/products/matlab.html
Penicillin:Streptomycin for tissue culture 100x Biowhittaker Inc. Walkersville, MD, USA LONZA 17-602E supplement for medium at Penicillin/Streptomycin 100U/100µg.
pN1-mEGFP-FGFR1 expression vector Unit of Gynecological Oncology Research, European Institute of Oncology IRCCS, Milan, Italy Zamai et al., 2019
pN1-N-Gly-mEGFP-GPI expression vector Unit of Microscopy and Dynamic Imaging, CNIC, Madrid, Spain Hellriegel et al., 2011
pN1-N-Gly-mEGFP-mEGFP-GPI expression vector Unit of Microscopy and Dynamic Imaging, CNIC, Madrid, Spain Hellriegel et al., 2011
Recombinant FGF2 PeproTech EC, Ltd., London, UK Ligand solution: 20ng/mL of FGF2 in PBS supplemented with 0.01%BSA.
Sodium pyruvate GIBCO ThermoFisher Scientific 11360070 1mM supplement for medium
TransIt-LT1 Transfection Reagent MirusBio LLC, Madison, WI, USA MIR 2300
Trypsin-EDTA (0.25%), phenol red GIBCO Thermo Fisher Scientific,Waltham, MA, USA 25200056
Type F Immersion liquid 10 mL Leica Microsystems, Wetzlar, Germany 11513 859
UltraPure BSA (50 mg/mL) ThermoFisher Scientific AM2618 0.1% supplement for medium without phenol red used for transfections

Riferimenti

  1. Agwuegbo, U. C., Jonas, K. C. Molecular and functional insights into gonadotropin hormone receptor dimerization and oligomerization. Minerva Ginecologica. 70 (5), 539-548 (2018).
  2. Ferre, S., et al. G protein-coupled receptor oligomerization revisited: functional and pharmacological perspectives. Pharmacological Reviews. 66 (2), 413-434 (2014).
  3. Marsango, S., Ward, R. J., Alvarez-Curto, E., Milligan, G. Muscarinic receptor oligomerization. Neuropharmacology. 136 (Pt C), 401-410 (2018).
  4. Oishi, A., Cecon, E., Jockers, R. Melatonin Receptor Signaling: Impact of Receptor Oligomerization on Receptor Function. International Review of Cell and Molecular Biology. 338, 59-77 (2018).
  5. Thelen, M., Munoz, L. M., Rodriguez-Frade, J. M., Mellado, M. Chemokine receptor oligomerization: functional considerations. Current Opinion in Pharmacology. 10 (1), 38-43 (2010).
  6. Van Craenenbroeck, K. GPCR oligomerization: contribution to receptor biogenesis. Subcellular Biochemistry. 63, 43-65 (2012).
  7. Wnorowski, A., Jozwiak, K. Homo- and hetero-oligomerization of beta2-adrenergic receptor in receptor trafficking, signaling pathways and receptor pharmacology. Cell Signaling Technology. 26 (10), 2259-2265 (2014).
  8. Fricke, F., Dietz, M. S., Heilemann, M. Single-molecule methods to study membrane receptor oligomerization. Chemphyschem. 16 (4), 713-721 (2015).
  9. Vidi, P. A., Ejendal, K. F., Przybyla, J. A., Watts, V. J. Fluorescent protein complementation assays: new tools to study G protein-coupled receptor oligomerization and GPCR-mediated signaling. Molecular and Cellular Endocrinology. 331 (2), 185-193 (2011).
  10. Trussell, H. J., et al., Trussell, J., et al. . Academic Press Library in Signal Processing. 4, 3-9 (2014).
  11. Betzig, E., et al. Imaging intracellular fluorescent proteins at nanometer resolution. Science. 313 (5793), 1642-1645 (2006).
  12. Rust, M. J., Bates, M., Zhuang, X. Sub-diffraction-limit imaging by stochastic optical reconstruction microscopy (STORM). Nature Methods. 3 (10), 793-795 (2006).
  13. Nagerl, U. V., Willig, K. I., Hein, B., Hell, S. W., Bonhoeffer, T. Live-cell imaging of dendritic spines by STED microscopy. Proceedings of the National Academy of Sciences of the United States of America. 105 (48), 18982-18987 (2008).
  14. Tsekouras, K., Custer, T. C., Jashnsaz, H., Walter, N. G., Presse, S. A novel method to accurately locate and count large numbers of steps by photobleaching. Molecular Biology of the Cell. 27 (22), 3601-3615 (2016).
  15. Godin, A. G., et al. Revealing protein oligomerization and densities in situ using spatial intensity distribution analysis. Proceedings of the National Academy of Sciences of the United States of America. 108 (17), 7010-7015 (2011).
  16. Qian, H., Elson, E. L. Distribution of molecular aggregation by analysis of fluctuation moments. Proceedings of the National Academy of Sciences of the United States of America. 87 (14), 5479-5483 (1990).
  17. Chen, Y., Muller, J. D., So, P. T., Gratton, E. The photon counting histogram in fluorescence fluctuation spectroscopy. Biophysical Journal. 77 (1), 553-567 (1999).
  18. Dalal, R. B., Digman, M. A., Horwitz, A. F., Vetri, V., Gratton, E. Determination of particle number and brightness using a laser scanning confocal microscope operating in the analog mode. Microscopy Research and Technique. 71 (1), 69-81 (2008).
  19. Unruh, J. R., Gratton, E. Analysis of molecular concentration and brightness from fluorescence fluctuation data with an electron multiplied CCD camera. Biophysical Journal. 95 (11), 5385-5398 (2008).
  20. Hess, S. T., Huang, S., Heikal, A. A., Webb, W. W. Biological and chemical applications of fluorescence correlation spectroscopy: a review. Biochimica. 41 (3), 697-705 (2002).
  21. Muller, J. D., Chen, Y., Gratton, E. Fluorescence correlation spectroscopy. Methods in Enzymology. 361, 69-92 (2003).
  22. Levi, V., Ruan, Q., Kis-Petikova, K., Gratton, E. Scanning FCS, a novel method for three-dimensional particle tracking. Biochemical Society Transactions. 31 (Pt 5), 997-1000 (2003).
  23. Hinde, E., et al. Quantifying the dynamics of the oligomeric transcription factor STAT3 by pair correlation of molecular brightness. Nature Communications. 7, 11047 (2016).
  24. Waithe, D., et al. Optimized processing and analysis of conventional confocal microscopy generated scanning FCS data. Methods. 140-141, 62-73 (2018).
  25. Digman, M. A., Dalal, R., Horwitz, A. F., Gratton, E. Mapping the number of molecules and brightness in the laser scanning microscope. Biophysical Journal. 94 (6), 2320-2332 (2008).
  26. Ossato, G., et al. A two-step path to inclusion formation of huntingtin peptides revealed by number and brightness analysis. Biophysical Journal. 98 (12), 3078-3085 (2010).
  27. Nagy, P., Claus, J., Jovin, T. M., Arndt-Jovin, D. J. Distribution of resting and ligand-bound ErbB1 and ErbB2 receptor tyrosine kinases in living cells using number and brightness analysis. Proceedings of the National Academy of Sciences of the United States of America. 107 (38), 16524-16529 (2010).
  28. Ming, A. Y., et al. Dynamics and Distribution of Klothobeta (KLB) and fibroblast growth factor receptor-1 (FGFR1) in living cells reveal the fibroblast growth factor-21 (FGF21)-induced receptor complex. Journal of Biological Chemistry. 287 (24), 19997-20006 (2012).
  29. Ross, J. A., et al. Oligomerization state of dynamin 2 in cell membranes using TIRF and number and brightness analysis. Biophysical Journal. 100 (3), L15-L17 (2011).
  30. Hellriegel, C., Caiolfa, V. R., Corti, V., Sidenius, N., Zamai, M. Number and brightness image analysis reveals ATF-induced dimerization kinetics of uPAR in the cell membrane. FASEB J. 25 (9), 2883-2897 (2011).
  31. Zamai, M., et al. Number and brightness analysis reveals that NCAM and FGF2 elicit different assembly and dynamics of FGFR1 in live cells. Journal of Cell Science. 132 (1), (2019).
  32. Hassler, K., et al. Total internal reflection fluorescence correlation spectroscopy (TIR-FCS) with low background and high count-rate per molecule. Optics Express. 13 (19), 7415-7423 (2005).
  33. Di Rienzo, C., Gratton, E., Beltram, F., Cardarelli, F. From fast fluorescence imaging to molecular diffusion law on live cell membranes in a commercial microscope. Journal of Visualized Experiments. (92), e51994 (2014).
  34. Beenken, A., Mohammadi, M. The FGF family: biology, pathophysiology and therapy. Nature Reviews Drug Discovery. 8 (3), 235-253 (2009).
  35. Joubert, J., Sharma, D. Light microscopy digital imaging. Current Protocols in Cytometry. , (2011).
  36. Gell, C., Berndt, M., Enderlein, J., Diez, S. TIRF microscopy evanescent field calibration using tilted fluorescent microtubules. Journal of Microscopy. 234 (1), 38-46 (2009).
  37. Burghardt, T. P. Measuring incidence angle for through-the-objective total internal reflection fluorescence microscopy. Journal of Biomedical Optics. 17 (12), 126007 (2012).
  38. Trullo, A., Corti, V., Arza, E., Caiolfa, V. R., Zamai, M. Application limits and data correction in number of molecules and brightness analysis. Microscopy Research and Technique. 76 (11), 1135-1146 (2013).
  39. Caiolfa, V. R., et al. Monomer-dimer dynamics and distribution of GPI-anchored uPAR are determined by cell surface protein assemblies. Journal of Cell Biology. 179 (5), 1067-1082 (2007).
  40. Campbell, R. E., et al. A monomeric red fluorescent protein. Proceedings of the National Academy of Sciences of the United States of America. 99 (12), 7877-7882 (2002).
  41. Cutrale, F., et al. Using enhanced number and brightness to measure protein oligomerization dynamics in live cells. Nature Protocols. 14 (2), 616-638 (2019).
  42. Dunsing, V., Chiantia, S. A Fluorescence Fluctuation Spectroscopy Assay of Protein-Protein Interactions at Cell-Cell Contacts. Journal of Visualized Experiments. (142), (2018).
check_url/it/60398?article_type=t

Play Video

Citazione di questo articolo
Zamai, M., Trullo, A., Arza, E., Cavallaro, U., Caiolfa, V. R. Oligomerization Dynamics of Cell Surface Receptors in Living Cells by Total Internal Reflection Fluorescence Microscopy Combined with Number and Brightness Analysis. J. Vis. Exp. (153), e60398, doi:10.3791/60398 (2019).

View Video