Extracellular vesicles (EVs) are small (0.03-2 µm) membrane-bound vesicles secreted by nearly all cell types1. They are often referred to as "exosomes," "microvesicles," or "apoptotic bodies" depending on their mechanism of release and size2. While it was initially thought that EVs were simply a means of eliminating waste from the cell to maintain homeostasis3, we now know that they can also participate in intercellular communication via transfer of molecular material – including DNA, RNA (mRNA, microRNA), lipids, and proteins4,5 – and that they are important regulators of normal physiology as well as pathological processes1,5,6,7,8.
There are many different methods to isolate and quantify EVs, which have been described elsewhere9,10,11,12. The isolation protocol used as well as the source of EVs can greatly impact EV yield and purity. Even differential centrifugation, long considered the "gold standard" approach for exosome isolation, can be subject to substantial variability subsequently impacting the EV population obtained and downstream analyses13. Thus, the various different methodologies for EV isolation and quantification make it difficult to compare, reproduce, and interpret results of experiments reported in the literature14. Furthermore, EV release can be regulated by cellular conditions or various external factors. It has been suggested that EVs play a role in maintaining cellular homeostasis by protecting cells against intracellular stress15, as several studies have shown that cellular stress stimulates EV secretion. For example, increased EV release has been reported after cellular exposure to hypoxia, endoplasmic reticulum stress, oxidative stress, mechanical stress, cigarette smoke extract, and particulate matter air pollution16,17,18,19,20,21,22. EV release has also been shown to be modified in vivo; mice subjected to a high fat diet or fasting for sixteen hours released more adipocyte EVs23. To investigate whether a specific treatment or condition alters EV release, the number of EVs must be accurately determined. Assessment of the EV size distribution may also indicate the predominant subcellular origin of EVs (e.g., fusion of late endosomes/multivesicular bodies with the plasma membrane vs. budding of the plasma membrane)24. Thus, there is a need for robust methods to accurately measure the total concentration and the size distribution of the EV prep being studied.
A rapid and highly sensitive method for the visualization and characterization of EVs in solution is nanoparticle tracking analysis (NTA). A detailed explanation of the principles of this method and comparison with alternative methods for assessment of EV size and concentration have been described previously25,26,27,28. Briefly, during NTA measurement, EVs are visualized by the light scattered when they are irradiated with a laser beam. The scattered light is focused by a microscope onto a camera which records the particle movement. The NTA software tracks the random thermal motion of each particle, known as Brownian motion, to determine the diffusion coefficient which is used to calculate the size of each particle using the Stokes-Einstein equation. NTA was first applied to measurement of EVs in a biological sample in 201125. Until recently, there were only two mainstream companies offering commercial NTA instruments29 until the introduction of the ViewSizer 3000 (hereafter referred to as the particle tracking instrument) which uses a combination of novel hardware and software solutions to overcome significant limitations of other NTA techniques.
The particle tracking instrument characterizes nanoparticles in liquid samples by analyzing their Brownian motion and characterizes larger micron-sized particles by analyzing gravitational settling. This instrument's unique optical system, which includes multispectral illumination with three laser light sources (at 450 nm, 520 nm, and 635 nm), allows researchers to analyze a wide range of particle sizes (e.g., exosomes, microvesicles) simultaneously. A schematic of the instrument setup is shown in Figure 1.
Here, we demonstrate how to perform particle size distribution and concentration measurements of isolated mouse and human EVs using a novel NTA instrument.
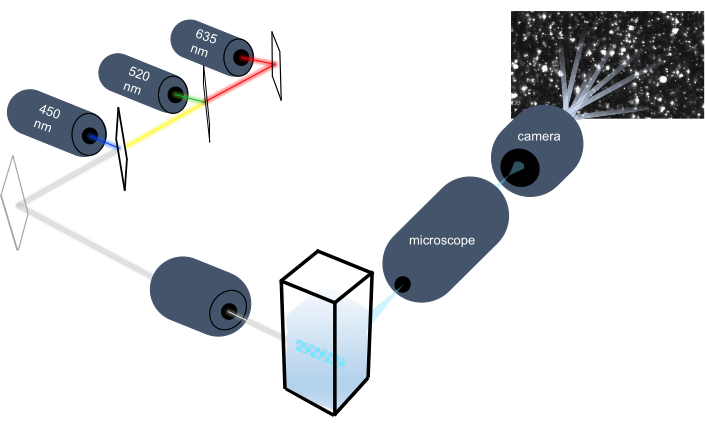
Figure 1: Particle tracking instrument optical system. The NTA instrument illuminates particles using three lasers with the following wavelengths: 450 nm, 520 nm, 635 nm. Video recording of the scattered light from individual particles is detected and tracked by a digital video camera oriented 90° from the cuvette. Please click here to view a larger version of this figure.
All work with these samples was performed in compliance with Institutional Animal Care and Use Committee and Institutional Review Board guidelines. A schematic overview of the NTA method is depicted in Figure 2.
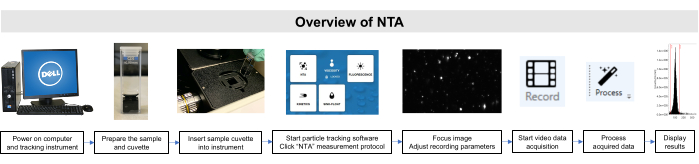
Figure 2: Overview of NTA method using the particle tracking instrument. The sample is prepared and inserted into the instrument. The NTA software is opened, recording parameters are adjusted, and the sample is focused. Then, the data is recorded, processed, and displayed. Please click here to view a larger version of this figure.
1. Extracellular vesicle isolation
NOTE: Mouse perigonadal adipose tissue EVs were isolated as previously described23. Plasma EVs were isolated from 1 mL of human plasma using the following protocol:
- Collect the plasma and centrifuge at 3,000 x g for 15 min to remove cellular debris. Transfer the supernatant to a new tube.
NOTE: If additional debris remains detectable, centrifuge the supernatant for additional 10 min at 12,000 x g and transfer the supernatant to a new tube. - Add 67 µL of the exosome isolation reagent per 250 µL of plasma. Mix well by inverting or flicking the tube.
- Incubate on ice upright for 30 min.
- Centrifuge the exosome isolation reagent/plasma mixture at 3,000 x g for 10 min at 4 °C.
NOTE: Centrifugation may be performed at room temperature or 4 °C with similar results, but 4 °C is preferred. After centrifugation, the EVs may appear as a beige or white pellet at the bottom of the tube. - Carefully aspirate off the supernatant. Spin down any residual exosome isolation solution and remove all traces of fluid by aspiration, taking great care not to disturb the precipitated EVs in the pellet.
- Resuspend the pellet in 200 µL of Buffer B (provided by the manufacturer). Measure and record the sample's protein concentration (for step 2.8) using a spectrophotometer, fluorometer, Bradford assay, or other preferred method.
2. Purification of isolated EVs
- Add 200 µL of Buffer A (provided by the manufacturer) to re-suspended EVs.
- Take out the purification column (provided), loosen the screw cap, and snap off the bottom closure. Place the column into a collection tube.
NOTE: Save the bottom closure for steps 2.7-2.9. - Centrifuge at 1,000 x g for 30 s to remove the storage buffer.
- Discard the flow-through and place the column back into the collection tube.
- To wash the column, remove the cap and apply 500 µL of Buffer B on top of the resin and centrifuge at 1,000 x g for 30 s. Discard the flow through. Save the cap for steps 2.7-2.9.
- Repeat steps 2.4-2.5 one more time to wash the column.
- Plug the bottom of the column with the bottom closure (from step 2.2). Apply 100 µL of Buffer B on top of the resin to prepare it for sample loading.
- Add the entire content from step 1.6 (or up to volume equivalent of 4 mg of total protein) to the resin. Place the screw cap on the top of the column.
- Mix at room temperature on a rotating shaker for no more than 5 min.
3. Sample elution
- Loosen the screw cap and remove the bottom closure, and immediately transfer to a 2 mL microcentrifuge tube.
NOTE: The sample will start to elute as soon as the bottom closure is removed. Please make sure 2 mL microcentrifuge tubes are ready to receive eluate to minimize sample loss. - Centrifuge at 1,000 x g for 30 s to obtain purified EVs. Discard the column.
4. Sample preparation for nanoparticle tracking analysis
- Use a lint-free material like a microfiber cloth to cover the workspace and prevent fibers from entering cuvettes.
- Wearing gloves, place the cuvette onto the magnetic cuvette jig, then place the stir bar in the cuvette. Always handle the cuvettes with gloves to prevent fingerprints and smudges from appearing on the cuvette's surface.
- Use the hook tool to place the insert into the cuvette as depicted in Figure 3. It is important to note the orientation of the insert for later (Step 5.4).
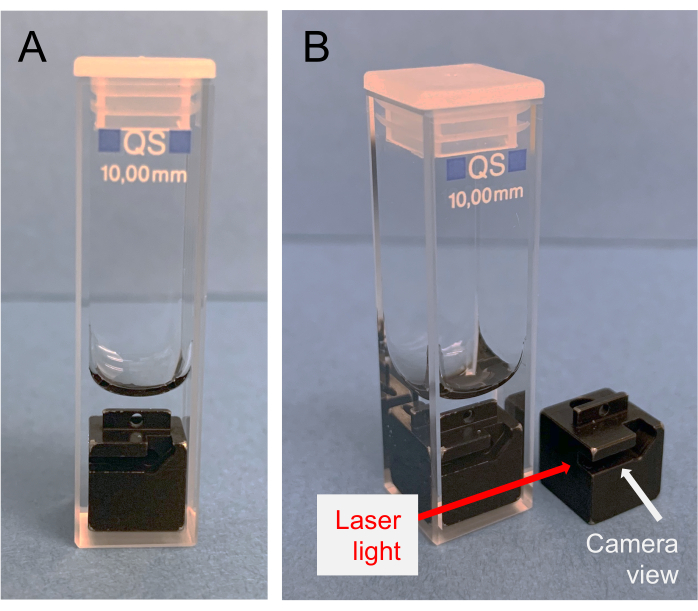
Figure 3: Proper orientation of insert within the quartz cuvette. The "notch" of the insert should be visible from the front of the cuvette. This should be inserted into the instrument facing the camera. Please click here to view a larger version of this figure.
- Using a pipette, slowly add 400-500 µL of the diluent or diluted sample at room temperature to the cuvette through the hole in the insert. Gently pipette up and down to mix. Avoid introducing air bubbles.
- First prepare a cuvette loaded with the chosen diluent (blank) to measure the particle concentration of the diluent. This should be done before measuring the sample so that the background concentration of the sample can be corrected.
NOTE: A good blank (phosphate buffered saline [PBS] in this case) will have a concentration <9 x 10⁶ (depending on the diluent) and will display 1-10 particles per screen in the live view (Figure 4). It is recommended that the actual sample particle concentration is at least 3 times the background concentration. - Optionally, before recording the sample prime the cuvette with 400-500 µL of the diluent or diluted sample before measuring. To do so, load 400-500 µL of the diluted sample into the cuvette, discard the solution, and then add 400-500 µL more of the sample for the measurement. This may help with washing out residues within the cuvette.
- First prepare a cuvette loaded with the chosen diluent (blank) to measure the particle concentration of the diluent. This should be done before measuring the sample so that the background concentration of the sample can be corrected.
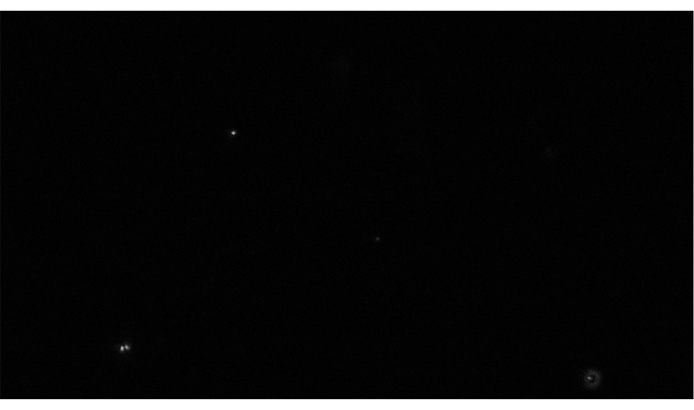
Figure 4: Representative live stream view of a diluent within the proper concentration range of a blank. Dilute EV preps in filtered (0.02 µm or 3 kDa, preferred) PBS. A good blank will display ~1-10 particles per screen in the live view, yielding a concentration within the range 105-106. Please click here to view a larger version of this figure.
- Cap the cuvette and check for bubbles. Tap out bubbles if necessary. Use a lint free cloth to wipe the outside faces of the cuvette.
5. Startup procedure of the particle tracking instrument
- Turn on the computer workstation and instrument, wait a few minutes prior to running the first sample and start the program by clicking on the software icon. When prompted, click NTA on the screen to conduct Nanoparticle Tracking Analysis. Begin in the Recording tab and click on the various software tabs (Record, Process, Plot) to switch between them throughout the protocol. Record the sample (diluent or EV prep) first, then process the recordings, and finally plot the results.
- Follow the instructions on the screen to fill out all the necessary information about the sample. Check that all necessary fields are completed and accurate, i.e., Sample name, Description, Sample preparation, Dilution factor [1000], Target temperature (Set to 22 °C), and Diluent: Select diluent from the dropdown menu and use PBS as the diluent for EVs. Selecting PBS from the dropdown menu will auto-populate the salinity to 9%. This information is necessary to determine the dynamic viscosity of the liquid.
NOTE: It can take up to 3 min for the temperature to equilibrate inside the cuvette even if the probe already shows desired temperature (i.e., green dot becomes stable). Sample readouts could vary considerably if target temperature is not set, as sample temperature differences could greatly alter the Brownian motion of particles. - Open the instrument lid and remove the protective cap covering where the cuvette will be placed.
CAUTION: The particle tracking instrument is certified as a Class 1 laser product (21 CFR Ch. I part 1040), containing lasers that can be dangerous and could cause serious injury such as burns and/or permanent damage to eyesight. To prevent accident or injury, do not remove the instrument cover by unscrewing the bolts from the side. Note that during operation, the laser beams are completely enclosed, posing no threat to users. Also, a magnetic safety interlock is built into the instrument's sample holder to prevent the lasers from operating when the cap of the sample holder is removed. - Place the cuvette (from Step 4.3) inside the instrument in the correct orientation (see Figure 5). Replace the cap over the cuvette and close the instrument lid. Always operate the instrument with the cap in place over the sample holder. Do not disable or attempt to circumvent the safety interlock feature.
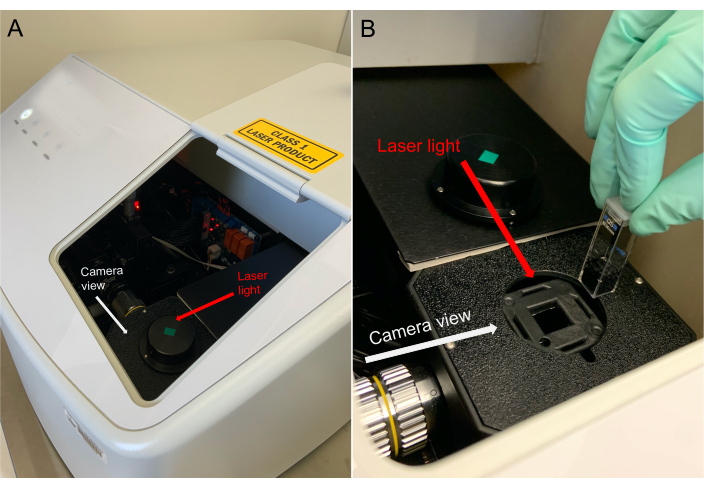
Figure 5: Proper orientation of cuvette within particle tracking instrument. The face of the cuvette (with the "notch" of the insert visible) should face the camera. Please click here to view a larger version of this figure.
- Turn on the camera by clicking the arrow above Streaming.
- Click the chevron arrow to expand the Record settings. Set Gain and Laser power to values appropriate for the application. See Table 1 (and Supplemental Figure 1) for parameters used for NTA of small (100 nm) EVs.
NOTE: These advanced settings accessed by clicking the chevron arrow may be password-protected. Use the same settings for recording and processing for the diluent (blank) as those used for the subsequent samples. - Adjust the focus until particles are properly focused. Focusing should be done on relatively small particles (Figure 6). For small EV quantification (consistent with exosomes), the following recording settings are recommended: Frame rate: 30 fps, Exposure: 15 ms, Stir time: 5 s, Wait time: 3 s, Laser power – Blue: 210 mW, Green: 12 mW, Red: 8 mW, Frames per video: 300 frames, and Gain: 30 dB.
NOTE: The user can increase the Zoom to 1x and/or increase the Gain to help with focusing. Remember to re-set these parameters to recommended values before recording videos.
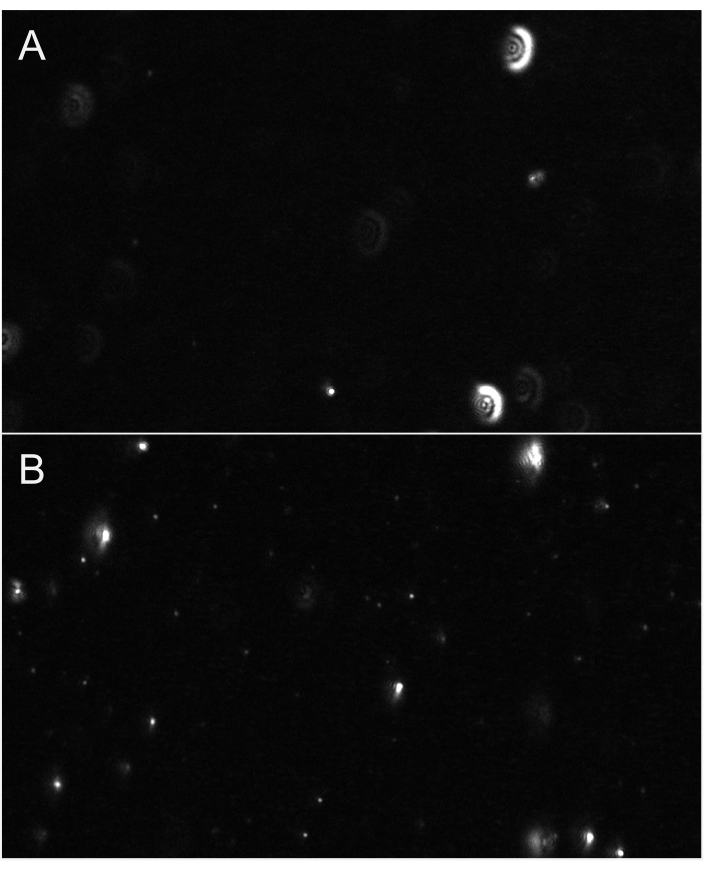
Figure 6: Representative live stream views showing particle focus. (A) An example live stream view of particles not in focus. Particles have glow-like halo or appear blurry. Adjust focus. (B) An example live stream view of particles in proper focus. The smallest particles are in focus. Commence recording. Please click here to view a larger version of this figure.
- Perform a visual quality check to ensure that the sample is properly diluted. If the sample is too concentrated, remove the cuvette from the instrument and dilute the sample sequentially. Repeat until the sample is properly diluted before proceeding to Step 6.
NOTE: Do not over-dilute the sample! Always make dilutions sequentially. The ideal blank will display only a few particles on the screen (1-4) as shown in Figure 4. Regarding EV samples, a properly diluted sample will have roughly 20-100 particles visible on the screen, with no glow-like or cloudy images in the background (see Figure 7 as an example). This should result in an optimum particle concentration in the range of 5 x 10⁶ to 2 x 10⁸ particles per mL (not adjusting for dilution factor).
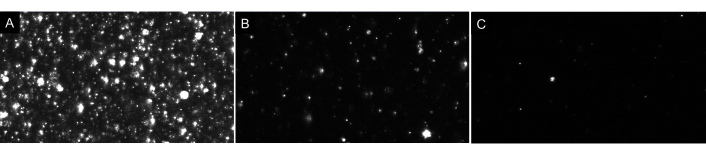
Figure 7: Representative live stream views depicting different particle dilutions. (A) An example live stream view of a sample that is too concentrated. Recording a sample that is too concentrated will yield inaccurate results. (B) An example live stream view of a properly diluted sample. There are 60-100 particles visible on screen and recording results in a raw concentration of 5 x 10⁶– 2 x 10⁸ particles/mL. (C) An example live stream view of a sample that is too dilute. If a sample is this dilute, there will not be enough particles tracked, lowering the sample size and, therefore, the results will be statistically invalid. In this case, increasing the number of videos recorded is recommended. Please click here to view a larger version of this figure.
6. Video data acquisition
- (Optional) Set the zoom setting to 0.5x to save bandwidth and prevent lost frames.
- Begin recording the videos by clicking on Record (see Table 1 for recommended recording parameters).
NOTE: By default, the instrument will stir the sample for 5 s, wait for 3 s, and then record for 10 s before repeating this process. Typical measurement time for 50 videos is ~15 min to record and ~13 min to process. - Do not touch the instrument while recording videos. Ensure that the surface of the laboratory bench is not vibrating.
NOTE: It is preferred that the instrument is set on an anti-vibration platform or table to reduce any vibration disturbances from nearby equipment that will interfere with the determination of nanoparticle movement. Avoid operating centrifuges, vortex mixers, or other potential vibration-generating devices on the same bench as the particle tracking instrument. Vibrations are easily visible on screen as elongation of usually round particles. If exposed to vigorous vibrations, the instrument may require realignment of optical elements. The instrument was not designed to be serviced or calibrated by the customer; contact the manufacturer for maintenance, service, and calibration. - Note any recorded video that has very large particles visible as large, irregular white blobs. Remove these videos from processing in Step 7.3.
7. Process acquired data
- When a prompt appears stating that videos have been recorded, click OK to complete recording. Then select the Process tab.
NOTE: The protocol can be stopped here. Processing of acquired data can be restarted later by moving directly to the Process tab after opening the particle tracking instrument's software and specifying the directory where the recorded videos are saved. - When analyzing EVs, check the box Disable auto detection override and set the Feature Diameter to 30. Click Process. (See Table 2 for processing settings and Supplemental Figure 2 for processing display). A live distribution graph will display so the user can view the processing in real-time.
- For exosomes, process with Detection Threshold set to the default Polydisperse Sample. Process the data with Detection Threshold Manual set to 0.8 instead of a standard threshold of 0.99 only for solutions with very large differences in particle sizes.
- If any videos had noticeably very large particles visible (see Step 6.4), navigate to the directory of recorded videos and remove the problematic video. After editing the list of video files, change the number of recorded videos in other user-kept logs.
- After processing is complete, click OK. Then, select the Plot tab. For EVs, display the Main chart as LogBinSilica.
NOTE: Here in the Plot tab, the user may customize other features of the graph, such as defining the range of the x axis (particle diameter, nm) to set the area for integration for the figure produced.
8. Display and interpret results
- To create a PDF report, click the Report button. The measurement is now complete, and the results may be viewed.
NOTE: Remember to record and process the blank first so that the background concentration of subsequent samples can be corrected. If this step is forgotten, the blank can be recorded after samples and the sample particle concentration corrected manually. - Examine the PDF report which displays the mean, median, and mode size as well as the concentration adjusted for the dilution factor and corrected by subtracting the diluent's particle concentration. The distribution width (standard deviation) is also shown.
NOTE: There are very few applications where a single value is appropriate and representative. Thus, describing the entire size distribution and reporting the width of the distribution for any sample analyzed is recommended (as shown in Table 3 for example). - Record the following instrument settings used to generate the data which should be stated when reporting results: Diluent, Laser power of each laser [mW], Exposure [ms], Gain [dB], Frame rate [fps], Frames per video, Number of videos recorded, Processing setting (e.g., LogBinSilica), Integration range [min nm, max nm] (recommended to set min to 50 nm) and Number of particles tracked (desirable to analyze at least ~150 particles per video; minimum 3,750 total tracks per sample recommended to avoid artifactual spikes in the particle size distribution and generate statistically significant data).
9. Cleaning the cuvettes
- Clean cuvettes manually between samples. First, empty the cuvette.
NOTE: The sample can either be recovered from the cuvette and saved or discarded. - Once the cuvette is empty, clean the cuvette by rinsing it 10-15 times with de-ionized (DI) water. Then, rinse 3 times with ethanol (70-100%). When doing this, make sure to completely fill the cuvette with solvent.
- Dry the outside of the cuvette with a lint free microfiber cloth. Avoid smudges on the surfaces. Air dry the inside of the cuvette or dry using a compressed air duster.
NOTE: Only lens cleaning paper or lint free microfiber cloth should be used to wipe the optical surfaces of the cuvette, as most paper products contain small wood fibers that may scratch or damage the cuvette's surface. - Prepare two glass scintillation vials: one filled with 70-100% ethanol and the other with DI water. Rinse the inserts and stir bars in the ethanol first (then DI water) by placing the insert/stir bar in the appropriate scintillation vial and shaking the vial vigorously. Dry the inserts and stir bars using lint free cloths or compressed air dusters.
NOTE: The cuvette and insert can also be cleaned using a sonicating water bath. To do so, first ensure the sonicating unit contains enough water (at least 5 cm depth). Then place the cuvette and insert inside a glass beaker (50 mL or larger), fill the beaker with alcohol to the same level as the water bath, place the beaker in the water, and switch on the power. Sonicate for a maximum of 5 min at a time, allowing the machine to rest >5 min between each 5-min burst if longer times are required. - When finished, immediately put all cleaned and dried components away for storage.
Before this demonstration, the calibration of the instrument was first tested to ensure the validity of the acquired data by measuring the size distribution of polystyrene bead standards. We tested the size distribution of 100 nm and 400 nm beads using the default recording parameters and the processing settings recommended in this protocol (Figure 8).
For the 100 nm polystyrene bead standard, a concentration of 4.205 x 10⁷ particles/mL was measured. The mean (standard deviation, SD) size was 102 (±17) nm with a coefficient of variation (CV) of 0.16. The D10/D50/D90 values were 76/104/126 nm. This indicates that the particle tracking instrument accurately reported the size of the 100 nm monodisperse beads. For the 400 nm polystyrene bead standard, the concentration was 4.365 x 10⁷ particles/mL. The mean (SD) size was 391 (±47) nm, with a CV of 0.12. The D10/D50/D90 values were 150/358/456 nm (Table 3). While the reported mean is very close to the true size of the beads, we can see that the instrument settings applied in this protocol are more accurate for the smaller particles ~100 nm. Thus, for particles larger than 400 nm, optimizing the laser parameters is suggested. Researchers should first conduct a method such as transmission electron microscopy (TEM) for an estimate of the resulting EV size distribution from a given source and isolation method prior to NTA.
A mean concentration of 4.41 x 10¹⁰ particles/mL was measured for the mouse tissue EV sample used for this demonstration. This sample was recorded following the parameters summarized in Table 1 and processed following the parameters outlined in Table 2. We demonstrate the impact of various dilution factors in Figure 9 and report the raw and adjusted particle concentrations in Table 4. The optimum dilution for the mouse tissue-derived EVs was between 1,000 to 3,000 whereas for human plasma-derived EVs it was 1,000, indicating that when first testing a given biofluid source or EV isolation method for NTA, serial dilutions should be tested so the optimum dilution for NTA measurement can be identified. We recommend measuring and reporting at least two different dilutions of a sample. We also measured four additional samples at various dilutions on two distinct particle tracking instruments. Supplemental Figure 3 compares the particle tracking instrument's precision in size measurements compared with another commercially available NTA instrument. Supplemental Table 1 further demonstrates the precision of this instrument's measurements, showing that the particle concentration changed proportionally with the sample dilution, but that the particle size measures did not.
After processing, the results (along with the instrument/software information, recording and processing settings, and experimental notes) can be saved in a .pdf report. The histogram included on this report can be modified as described in the protocol (section 7.4). The raw results are saved in a .dat file that can be exported. The recorded videos are also saved and can be used for later off-line processing and analysis. However, once videos are recorded, recording settings cannot be changed retrospectively.
The impact of altering the various laser powers and gain in the recording settings was demonstrated using human plasma derived EVs. This is visualized in Figures 10-12 and the quantitative information based on these images is shown in Table 5. Increasing the gain increases the camera's sensitivity, allowing visualization of smaller particles (Figure 10) resulting in an increasing total particle concentration with a smaller average particle size (Table 5). However, increasing the gain above 30 dB (our recommendations) makes the view too grainy, allowing noise to obscure measurement of true particles. At a camera gain of 30 dB, the effect of altering the blue laser power is depicted in Figure 11. Increasing the blue laser (450 nm, short wavelength) power results in greater resolution to detect smaller particles (i.e. those with a size consistent with exosomes). Holding the green and red laser powers constant at the default settings, increasing the blue laser power from 70 mW to 210 mW shifted the reported average particle size from 122 nm to 105 nm and increased the reported total particle concentration from 1.1 x 10⁸ to 1.7 x 10⁸ (Table 5).
The effect of increasing the green and red laser powers was also demonstrated (Figure 12). Increasing the power of the red laser (650 nm, long wavelength) increased the reported average particle size from 175 to 246 nm. The reported total particle concentration decreased, but that is because in this human plasma EV sample we did not have many large particles present, confirmed by TEM negative staining (Supplemental Figure 4). Increasing the green laser power resulted in a decrease in the reported average particle size and an increase in reported total particle concentration. Thus, the user can optimize the power of the three lasers to sensitively detect particles of various sizes.
This protocol is optimized for smaller vesicles (e.g., <400 nm). Researchers interested in microvesicles of larger sizes (e.g., 400-1000 nm) are encouraged to optimize the laser parameters using hollow organosilica beads which have light-scattering properties similar to that of EVs making them a more suitable reference than polystyrene or silica bead standards30. Yet silica nanoparticles may be the best practical substitute until organosilica standards become more widely available.
Here, an NTA instrument was used to successfully quantify EVs isolated from mouse tissue by ultracentrifugation and human plasma by using a commercial kit. The effects of altering the NTA parameters were illustrated and show that the parameters in this protocol are optimized for small vesicles. The importance of the dilution step was also displayed and shows that the particle tracking instrument demonstrated here can accurately detect variations in dilution factors. The concentration changed proportionally with multiple dilutions, while the size distribution did not. The resulting data showed little technical variability. Thus, adaptation of this protocol by researchers using this instrument for NTA will increase rigor and reproducibility in the EV research field.
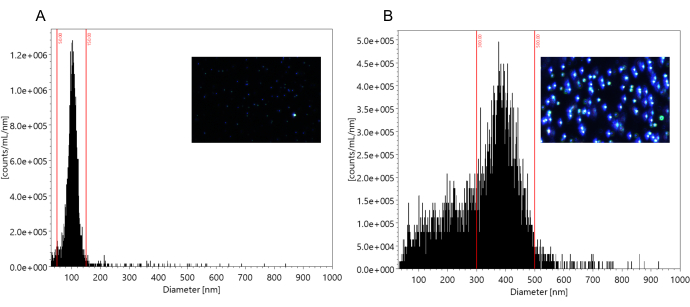
Figure 8: Particle size distributions of monodisperse polystyrene bead standards. (A) Particle size distribution of 100 nm polystyrene bead standard. (B) Particle size distribution of 400 nm polystyrene bead standard. Values are reported in Table 3. Inset shows example live stream view of the first measured frame. Please click here to view a larger version of this figure.
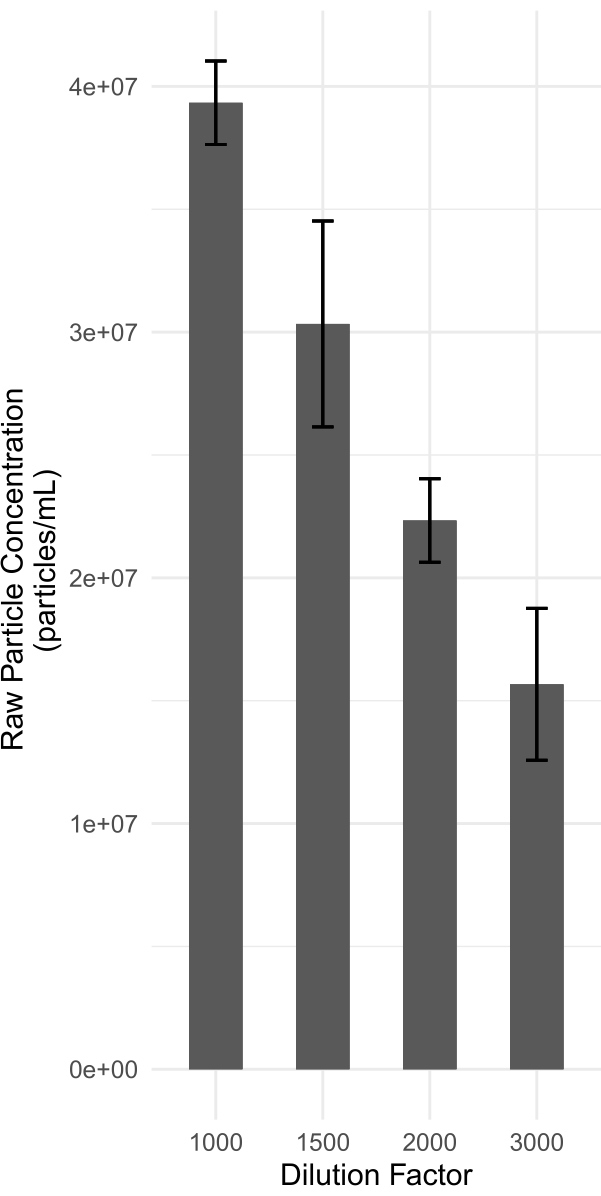
Figure 9: Raw total particle concentrations by dilution factor for mouse perigonadal adipose tissue EVs. Error bars represent standard deviation. Three measurements were taken for each dilution. Values are reported in Table 4. Please click here to view a larger version of this figure.
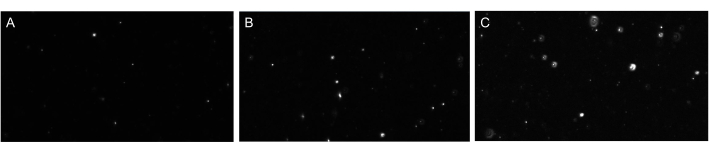
Figure 10: Visual impact of increasing gain. Representative images of particles measured with default laser settings (Blue = 70 mW, Green = 12 mW, Red = 8 mW) and gain set to (A) 18 dB, (B) 24 dB – default, and (C) 30 dB – recommended. Please click here to view a larger version of this figure.
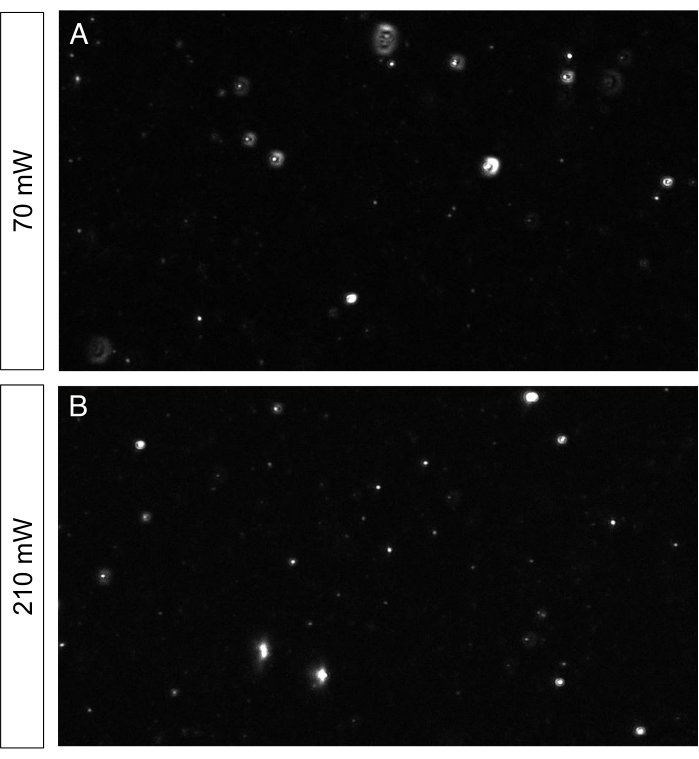
Figure 11: Effect of blue laser on small particles when red and green lasers are set to default settings. (A) Blue laser = 70 mW (default). (B) Blue laser = 210 mW (recommended). More small particles are visible and in focus when the blue laser power is increased to 210 mW. Please click here to view a larger version of this figure.
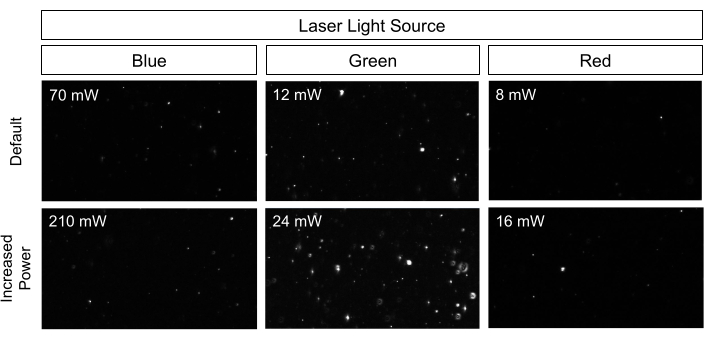
Figure 12: Visual impact of altered blue, green, and red laser power. Representative live screen views depict the different particle sizes visualized across different laser settings. Resulting NTA values are reported in Table 5. Please click here to view a larger version of this figure.
| Particles | Diameter [nm] | Blue laser [mW] | Green laser [mW] | Red laser [mW] | Camera gain [dB] | Temperature Regulation | Processing | # Videos |
| Exosomes | 100 | 210 | 12 | 8 | 30 | Enabled, set to 22 ºC | Disabled Auto Detection Override | 50 |
Table 1: Recording parameters for small extracellular vesicles (~100 nm).
| Process Description | Detection Threshold | Disable Auto Detection Override | Feature Diameter [px] |
| Exosomes | Polydisperse Sample | Checked | 30 |
Table 2: Processing parameters for small extracellular vesicles (~100 nm).
| Size of Polystyrene Standard [nm] | Integration range [nm] | Mean size [nm] | SD size [nm] | CV of size | D10 [nm] | D50 [nm] | D90 [nm] | Total Counts |
| 100 | 50 to 150 | 102 | 17 | 0.16 | 76 | 104 | 126 | 2628 |
| 400 | 300 to 500 | 391 | 47 | 0.12 | 150 | 358 | 456 | 2728 |
Table 3: NTA results of monodisperse polystyrene bead standards. Both standards were optimally diluted, with raw concentrations for the 100 nm standard and 400 nm standard of 4.205 x 10⁷ particles/mL and 4.365 x 10⁷ particles/mL, respectively. D10 is the point in the size distribution where 10% of the sample is contained, D50 is the point where 50% of the sample is contained (median), and D90 is the point where 90% of the sample is contained. SD: Standard deviation; CV: Coefficient of variation.
| Dilution Factor | Particle Concentration, particles/mL | Total Particle Concentration, particles/mL |
| Raw | Adjusted for Dilution Factor | |
| 1000 | 4.10E+07 | 4.10E+10 |
| 4.00E+07 | 4.00E+10 | |
| 3.70E+07 | 3.70E+10 | |
| mean (SD) | 3.93E+07 (1.70E+06) | 3.93E+10 (1.70E+09) |
| 1500 | 3.60E+07 | 5.40E+10 |
| 2.60E+07 | 3.80E+10 | |
| 2.90E+07 | 4.40E+10 | |
| mean (SD) | 3.03E+07 (4.19E+06) | 4.55E+10 (6.60E+09) |
| 2000 | 2.40E+07 | 4.80E+10 |
| 2.30E+07 | 4.60E+10 | |
| 2.00E+07 | 4.00E+10 | |
| mean (SD) | 2.23E+07 (1.70E+06) | 4.46E+10 (3.40E+09) |
| 3000 | 2.00E+07 | 6.00E+10 |
| 1.30E+07 | 3.90E+10 | |
| 1.40E+07 | 4.20E+10 | |
| mean (SD) | 1.57E+07 (3.09E+06) | 4.71E+10 (9.27E+09) |
Table 4: NTA results of mouse perigonadal adipose tissue EVs demonstrate reproducibility of NTA measurements. Raw NTA particle concentrations (particles/mL) measured on the particle tracking instrument and total particle concentration (particles/mL) adjusted for dilution factor of EVs derived from mouse perigonadal adipose tissue at various dilutions.
| Gain [dB] | Blue Laser [mW] | Green Laser [mW] | Red Laser [mW] | Total Concentration, particles/mL (raw) | Average size [nm]* | Standard deviation of size / CV | Modal size | D10 / D50 / D90 |
| 18 | 70 | 12 | 8 | 5.90E+07 | 133 | 89 / 0.66 | 67 | 66.57 / 131.08 / 322.70 |
| 24 | 70 | 12 | 8 | 1.00E+08 | 118 | 73 / 0.61 | 64 | 60.21 / 117.93 / 257.08 |
| 30 | 210 | 12 | 8 | 1.70E+08 | 105 | 57 / 0.54 | 80 | 59.83 / 104.74 / 206.07 |
| 30 | 70 | 12 | 8 | 1.10E+08 | 122 | 75 / 0.61 | 74 | 73.17 / 123.09 / 278.70 |
| 30 | 210 | 0 | 0 | 1.00E+08 | 116 | 70 / 0.6 | 82 | 71.33 / 115.63 / 257.65 |
| 30 | 70 | 0 | 0 | 7.00E+07 | 126 | 79 / 0.63 | 82 | 74.81 / 125.16 / 284.23 |
| 30 | 0 | 12 | 0 | 2.80E+07 | 169 | 106 / 0.63 | 100 | 98.28 / 163.39 / 392.50 |
| 30 | 0 | 24 | 0 | 4.40E+07 | 148 | 95 / 0.64 | 88 | 84.24 / 147.69 / 354.15 |
| 30 | 0 | 0 | 8 | 1.50E+07 | 175 | 129 / 0.74 | 62 | 8.81 / 15.32 / 108.93 |
| 30 | 0 | 0 | 16 | 9.20E+06 | 246 | 147 / 0.6 | 13 | 8.55 / 14.93 / 136.75 |
| *Integrated within 50-1000 nm range | ||||||||
Table 5: NTA results of human plasma derived EVs demonstrate the effect of altering laser power and gain on size and particle concentration measurements of human EVs (1:1000 dilution). D10 is the point in the size distribution where 10% of the sample is contained, D50 is the point where 50% of the sample is contained (median), and D90 is the point where 90% of the sample is contained. SD: Standard deviation; CV: Coefficient of variation.
Supplemental Figure 1: Screenshot of recording panel depicting recommended recording parameters. Access advanced settings to change the camera gain and laser power to recommended settings. Please click here to download this File.
Supplemental Figure 2: Screenshot of processing panel depicting recommended processing settings. Ensure "Disable auto detection override" is checked and the Feature Diameter is set to "30." Please click here to download this File.
Supplemental Figure 3: Particle size measurements across multiple dilutions: Precision of the particle tracking instrument (ViewSizer 3000) vs. comparable commercial NTA instrument (NanoSight NS300). NTA of EVs isolated from mouse perigonadal adipose tissue was performed on two instruments. For each mouse, three dilutions (1:1000, 1:500, 1:100) were measured. Raw values for measures taken on the ViewSizer 3000 (demonstrated in this protocol) are shown in Supplemental Table 1. Capture and analysis settings for the NanoSight NS300 measures are shown in Supplemental Table 2. Please click here to download this File.
Supplemental Figure 4: Representative negative-stain transmission electron microscopy (TEM) of human plasma-derived EVs. Grids were imaged with a transmission electron microscope operating at 100 kV accelerating voltage. Images were captured on a 2K x 2K CCD camera. Scale bar reflects the magnification at the camera. Electron micrographs show round vesicles ~25 nm in diameter. 100k magnification, scale bar 200 nm. Please click here to download this File.
Supplemental Table 1: ViewSizer 3000 particle size and concentration measurements of mouse perigonadal adipose tissue EVs across multiple dilutions. NTA of EVs isolated from mouse perigonadal adipose tissue was performed. For each mouse, three dilutions (1:1000, 1:500, 1:100) were measured. D10 is the point in the size distribution where 10% of the sample is contained, D50 is the point where 50% of the sample is contained (median), and D90 is the point where 90% of the sample is contained. Particle concentrations are background-corrected. Please click here to download this Table.
Supplemental Table 2: NanoSight NS300 capture and analysis settings. Settings (using NTA 3.4 Build 3.4.003) used to measure mouse perigonadal adipose tissue EV samples reported in Supplemental Figure 3. Please click here to download this Table.
Here, we demonstrate a protocol for NTA of EVs to measure the size distribution of a wide range of particle sizes simultaneously and measure total EV concentration in a polydisperse sample. In this study, mouse perigonadal adipose tissue and human plasma were used as the source of EVs. However, EVs isolated from other tissues or biological fluids such as serum, urine, saliva, breast milk, amniotic fluid, and cell culture supernatant may also be used for NTA. Measurements of polystyrene bead standards ensured that the instrument was properly calibrated and demonstrated that this NTA instrument can correctly measure the size of nanoparticles ≤400 nm. Various dilutions of a mouse tissue EV sample were then tested. As shown in Figure 9, the reported particle concentration scales accordingly with the dilution factor, as expected, demonstrating that the instrument can accurately detect the particle concentration at various dilutions with little variability between technical replicates. However, this was when working with particle concentrations within the working range of the instrument (5 x 10⁶ to 2 x 10⁸ particles per mL); appropriately diluting a sample is a critical step in the protocol. Adjusting for the dilution factor yielded roughly the same estimate for the total particle concentration of the sample, with a CV of 15.1 across the four dilutions tested. Also, different measures, repeated on multiple dilutions of the same samples, showed the precision in the particle size distribution assessments, as particle concentrations scaled proportionally with the dilution factor but reported size measures did not.
EVs in suspension undergo random thermal motion known as Brownian motion, according to which the diffusion of particles in a liquid suspension is inversely proportional to their size. This random motion is modeled by the Stokes-Einstein equation, where the hydrodynamic diameter D of a spherical particle is:
Where kB is the Boltzmann constant and R is the particle radius. As one can see from the equation, particle movement in suspension also depends on the temperature (T) and dynamic viscosity (η) of the liquid. During NTA, EVs are irradiated with focused laser beams that pass through the particles in suspension and are detected by the incident illumination coming from the lasers. The light scattered by each individual particle is focused by a microscope onto the image sensor of a high-resolution, light-sensitive charge-coupled device (CCD) camera, which records digital images of the scattered light of the particles (Figure 1). The NTA software identifies and tracks the Brownian motion of each individual particle to calculate the diffusion coefficient of each particle. This is used together with the temperature and the viscosity of the liquid containing the particles to calculate particle diameter using the Stokes-Einstein equation. Thus, a single measurement can determine two critical pieces of information: particle size distribution and total particle count of EVs in suspension.
A comparison of NTA to other techniques for detecting and quantifying EVs has been described elsewhere31,32. Compared to other light scattering based methods such as dynamic light scattering (DLS), NTA has higher resolving capabilities and is a particularly powerful method for analyzing particles with a mean diameter of less than 100 nm. Unlike single-particle analytics such as TEM, NTA is not time consuming or technically challenging and can phenotype an entire sample in a relatively low volume at once in a semi-automated manner. While NTA is a powerful characterization technique, it does have limitations. First, NTA is subject to sensitivity limits due to the strong decrease in the intensity of scattered light scaling with particle diameter, causing the scattered light of very small particles to disappear below the background noise33. Thus NTA has reduced sensitivity for EVs smaller than ~50 nm31 and results in an overestimation of EV sizes. Short wavelength lasers are needed to detect the smaller particles of a polydisperse sample due to their light scattering potential. However, this particle tracking instrument offers an improvement to this limitation inherent to nanoparticle tracking technology. Equipped with three variable light sources (450 nm, 520 nm, 635 nm), this system allows for visualization of particles over a wide range of sizes, making this instrument a particularly valuable tool for NTA analyses of polydisperse samples such as a heterogeneous population of EVs. Nonetheless, because most EV preps will be polydisperse in composition and likely contain impurities, researchers should be aware that sample-dependent limits of detection impact the shape of the overall size distribution and therefore exercise caution when interpreting results.
Another major limitation of NTA is that it measures more than just EVs. The NTA instrument will detect, measure, and count all particles exceeding the detection limit, including protein aggregates, lipoproteins, cellular debris, and contamination caused by diluents. However, particle concentration in the background can be corrected for by measuring the particle concentration of the diluent prior to loading and measuring a sample. We recommend using at minimum 0.02 µm filtered PBS and have found very low particle contamination when using 3 kDa filtered PBS. Furthermore, it is possible to extend NTA to measure and analyze fluorescently labeled EVs, overcoming the limitation of non-specific measurement. Commercial kits are available that specifically and efficiently dye the membranes of intact vesicles only, excluding membrane fragments, protein aggregates, and other particles from the NTA measurement. Thus, the data derived from fluorescent NTA more accurately represents the true EV concentration and size distribution. Through selectively tagging EV surface antigens, fluorescent NTA can also measure specific EVs labeled by fluorescently tagged antibodies, allowing for the counting and sizing of antigen-specific, biologically relevant EV subpopulations.
There has been little work on standardization of NTA protocols, making comparability of results difficult and hindering reproducibility across samples, days, operators, and laboratories. The particle tracking instrument demonstrated in this protocol requires little hands-on time. We have also noted which instrument settings users should report to facilitate reproducibility of generated data. Thus, following the optimized protocol laid forth here should result in standardization and enable comparison of results across laboratories. Another advantage of using this instrument is that the sample is prepared in a cuvette, which allows the instrument to repeatedly stir between videos, ensuring a statistically random sample for each video and yielding a more reproducible result than other commercially available NTA instruments that rely on syringe pumps and flow cells. Also, the multiple lasers allow for detection of particles with varying refractive indices, yielding more robust results. Yet operation of this particle tracking instrument does not require knowledge of particle material properties such as the refractive index, making measurements more reproducible across operators.
EVs have been identified in nearly all biofluids tested2,5. However, effective isolation of specific EVs (e.g., cell-type specific EVs) from different media (e.g., blood, breast milk, cell culture media) presents a difficult challenge. Many different methods for EV isolation have been described9. NTA can be performed to compare yields of EVs isolated using different methods and identify variations in the vesicles that arise from different isolation methods. This is important for interpreting downstream results, as currently the function of different EV subpopulations remains unclear. Accurately measuring EV concentration is also important in studies investigating whether a certain treatment, condition, or molecule impacts EV release. For example, our group is interested in the impact of environmental exposures such as particulate matter air pollution on EV content and release. In order to assess whether a condition affects EV release, the number of vesicles has to be accurately quantified. When using EVs as diagnostic biomarkers, the concentration of EVs in the sample could impact the assay results. Thus, a reliable method to determine particle concentration and size distribution is critical.
Regardless, NTA measurements should be accompanied by other complementary techniques that can measure particles independently of the other particles in the sample, such as TEM. Newer technologies such as microfluidic resistive pulse sensing (MRPS) are also promising for sizing and counting of EVs independent of the polydispersity of the sample. Further biochemical or proteomic analyses of EV samples can be used in addition to the size and concentration data to cluster subsets of EVs into populations of biological significance. In conclusion, measuring valid and reproducible particle concentrations and particle size distributions is important for the EV field. The ViewSizer 3000 achieves accurate and reproducible measurements of total EV concentration and EV size distribution, even for highly polydisperse samples, as demonstrated here. In the future we hope to see further rigorous experimental comparisons of this instrument with other NTA instruments.
