The joint ethics committee (IACUC) of the Hebrew University and Hadassah Medical Center approved the study protocol for animal welfare (MD-19-15827-1).
1. Krebs-Henseleit buffer preparation
- A day before the experiment, prepare a modified version of the Krebs-Henseleit buffer (KHB)26. Initially, dissolve 118 mM NaCl, 4.7 mM KCl, 0.5 mM pyruvate, 1.2 mM MgSO4, 25 mM NaHCO3, and 1.2 mM KH2PO4 in double-distilled H2O.
- Bubble this mixture with 95%/5% O2/CO2 for 20 min, and then add 1.2 mM CaCl2.
- Adjust the pH of the buffer to 7.4 with HCl or NaOH.
- On the day of the experiment, add 10 mM glucose and 72 U/L insulin to the KHB prepared in step 1.2.
NOTE: Insulin is added to the perfusion buffer as described in the work of Kolwicz et al.26 and in agreement with previous studies reporting that insulin increases the contractile function27 and the intensity of the hyperpolarized [13C]bicarbonate signal28.
2. Perfusion system preparation
- Keep a reservoir of 200 mL of KHB in a water bath at 40 °C, and bubble with 95%/5% O2/CO2 at a flow rate of 4 L/min for 1 h prior to cardiac perfusion. Keep the buffer continuously bubbling with this gas mixture throughout the experiment.
- First, set the water bath to 40 °C. Insert the KHB reservoir. Use a peristaltic pump (see Table of Materials) and medical-grade extension tubes to recirculate the KHB between the buffer reservoir and the 10 mm NMR tube at a constant flow rate of 7.5 mL/min.
- Connect three platinum-cured silicone tubes (3 mm i.d.) to the pump (one inflow tube and two outflow tubes for the KH buffer). Insert the outflow and inflow lines into the heated KH buffer. Then, insert the oxygen line into the heated KH buffer.
- Use thin polyether ether ketone (PEEK, see Table of Materials) lines for the buffer and hyperpolarized agent to flow to and from the NMR tube within the spectrometer's bore.
- Ensure that the temperature is maintained at 37-37.5 °C. Follow the steps below.
- Wrap the inflow line (from the buffer reservoir to the NMR tube) with a heating tape set to 42 °C.
- Heat the NMR tube inside the spectrometer with a warm airflow that is regulated by the spectrometer.
- Use an NMR-compatible temperature sensor (see Table of Materials) to measure the temperature inside the NMR tube. The temperature is adjusted to 37-37.5 °C.
3. Calibration and preparation of the NMR spectrometer for acquisition
- On the day of the experiment, insert a 13C standard sample that contains 1,4-dioxane (Table of Materials) into the spectrometer, and tune and match the NMR probe for 13C. Then, obtain a spectrum showing the thermal equilibrium signal of 1,4-dioxane with a nutation angle of 90°.
- Now exchange the 13C standard sample with a 31P standard sample (Table of Materials), that contains 105 mM of ATP in D2O. Tune and match the NMR probe for 31P.
NOTE: A spectrum showing the thermal equilibrium phosphate signals is obtained with a nutation angle of 50°. - Insert the inflow line, the outflow line, and the temperature probe into a 10 mm NMR tube, and then insert the tube into the magnetic bore. Adjust the heating tape to 42 °C.
- Acquire a 31P NMR spectrum of the circulating KH buffer to be used in that experiment for 30 min, with a nutation angle of 50° and a TR of 1.1 s (1,640 acquisitions).
4. Animal preparation, surgical procedure, and perfusion of the heart in the NMR tube
- Anesthetize a male HSD:ICR (CD-1) mouse with 3.3% isoflurane in room air (Table of Materials) at 340 mL/min for 5 min using a gas anesthesia system (Table of Materials) in an induction chamber.
- Use nasal anesthesia for the maintenance of general anesthesia with 2.9% isoflurane.
NOTE: Care is taken to minimize pain and discomfort to the animal. - Secure the limbs of the animal with tape, ensure a negative pedal pain reflex, and then inject 300 IU of sodium heparin intraperitoneally.
- Wet the mouse's chest wall and abdomen thoroughly with 70% alcohol to ensure cleanliness and avoid hair contamination or obstruction during the surgical procedure.
- At 1 min after the heparin injection, cut the skin and muscle of the abdominal cavity with small scissors.
- Place the small curved-jaw hemostat-locking mosquito clamp between the xiphoid process and the chest skin to lift the chest and expose the diaphragm. Puncture and cut the right lobe of the diaphragm.
- Cut the chest across the midline, retract to the sides, and then remove.
- Inject the left ventricle of the heart with 200 IU of sodium heparin to prevent blood coagulation. Then, inject 0.1 mL of ice-cold 0.5 mol/L KCl to achieve cardiac arrest, as previously described25. Cardiac arrest is essential to be able to cannulate the heart.
- Identify the thymus, and remove it using scissors to expose the aorta. Remove residual rib cage tissue.
- Identify the aortic arch, and use curved forceps to place a loose knot with a 3-0 silk suture (Table of Materials) around the ascending aorta. Inject 3 mL of KHB into the left ventricle to remove blood clots from the aorta.
- Use curved forceps to retract the heart inferiorly for better visualization of the ascending aorta.
- Perform cannulation in situ with a 22 G intravenous catheter (Table of Materials). Apply cyanoacrylate adhesive in the cannulated region, and then perform double suture tying. Inject additional KH buffer into the heart, and verify that it flows through the cannulation tube.
- Remove the curved forceps. Disconnect the heart from the surrounding viscera, and perfuse it retrogradely with ice-cold KHB (4 °C) through the intravenous catheter.
- Connect the heart to the inflow line of the perfusion system via the intravenous catheter. Upon the initiation of perfusion with warm buffer (37-37.5 °C) at 7.5 mL/min, the heart begins beating spontaneously.
- Fix the NMR tube with the beating heart, outflow lines, and temperature probe, and insert into the bore of the spectrometer, making sure the heart is at the center of the NMR probe.
5. Acquiring data for cardiac energetics and pH
- Acquire 31P spectra for about 1 h with a flip angle of 50 ° and a TR of 1.1 s.
6. DNP spin polarization and dissolution
- Prepare a 28.5 mg formulation of [1-13C]pyruvate. This formulation consists of 11.1 mM to 14.0 mM OX063 radical in the neat acid.
- Prepare 4 mL of dissolution medium. The dissolution medium consists of TRIS-phosphate buffer, which contains 11.2 mM NaH2PO4, 38.8 mM Na2HPO4, 33 mM TRIS, and 2 mM HCl. This medium composition is adjusted such that upon the addition of 28.5 mg of [1-13C]pyruvic acid formulation to 4 mL of this buffer (in the dissolution phase), the pH of the resulting solution will be 7.4.
- Perform spin polarization and fast dissolution in a dissolution-DNP (dDNP) spin polarization device according to the manufacturer's instructions (Table of Materials). Apply microwave irradiation at a frequency of 94.110 GHz for the polarization of the [1-13C]pyruvic acid formulation at 1.45 K to 1.55 K for about 1.5 h.
- Quickly mix the 4 mL of hyperpolarized medium from the dDNP device with a well-oxygenated solution that complements the hyperpolarized dissolution medium to obtain a composition closely matching the perfusion medium.
NOTE: The final volume of the medium perfusing the heart during the hyperpolarized injections with 14 mM hyperpolarized [1-13C]pyruvate is 26 mL. The final composition of the injected medium (after mixing) contains 4.7 mM KCl, 1.2 mM MgSO4, 70 mM NaCl, 25 mM NaHCO3, 1.2 mM KH2PO4, 10 mM glucose, 1.2 mM CaCl2, and 72 U/L insulin. - Administer the hyperpolarized [1-13C]pyruvate-containing medium to the isolated heart using a continuous flow setup29.
NOTE: This is done to ensure that the heart perfusion is not disturbed at any point during the experiment and that the hyperpolarized medium is administered at a known rate and for a known duration.
7. Hyperpolarized 13C spectroscopy
- Acquire hyperpolarized 13C data using product-selective saturating-excitation pulses15 by applying 2.5 ms cardinal sine (Sinc) pulses, as previously described15,16. Selectively excite [1-13C]lactate and [13C]bicarbonate consecutively at 6 s intervals to obtain a 12 s interval for each metabolite.
- For [1-13C]lactate detection, center the selective Sinc pulse at the [1-13C]pyruvate hydrate frequency (179.4 ppm), which results in signal intensity ratio (lac) of 0.113 for the C1 signals of [1-13C]pyruvate to [1-13C]lactate.
- For [13C]bicarbonate detection, center the selective Sinc pulse at 157.7 ppm, which is 214 Hz down-field of the [13C]bicarbonate signal (161.1 ppm); this results in a signal intensity ratio (bic) of 0.139 for the C1signal of [1-13C]pyruvate to [13C]bicarbonate.
8. Determination of the tissue wet weight and volume
- At the end of the experiment, detach the heart from the perfusion system, and gently dry it with tissue paper. Subsequently, weigh the heart to obtain the tissue wet weight.
- Determine the volume of the heart using a density factor of 1.05 g/cm3, as determined previously for the mouse heart30.
9. ATP content quantification
- Integrate the γ-ATP signal of a single acquisition of the ATP standard sample and a 30 min acquisition (TR of 1.1 s and 1,640 acquisitions) of the isolated heart.
- Quantify the ATP content of the heart by comparing the integral of the heart's γ-ATP signal to that of the standard (Table of Materials), where the latter has a known concentration (105 mM), and correct for the number of acquisitions and relaxation effects.
10. Resolving the Pi signal of the heart
NOTE: In order to evaluate the tissue pH, it is first necessary to deconvolve the heart's Pi signal from that of the total Pi signal (Pit). This is done by omitting the signal of the KHB Pi (PiKH) from that of the Pit.
- In a 31P spectrum of KHB that shows a single Pi signal (PiKH, Figure 1A), fit the PiKH signal to a Lorentzian function using Excel (Table of Materials).
- The volume visible to the NMR probe (Vp, 1.375 mL), contains more KHB when the sample tube does not contain the heart. To correct for this filling effect, calculate the attenuated buffer signal (Pib) using Eq. 1A.
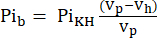 Eq. 1A
where Vh is the heart's volume, as determined in step 8. - Subtract this signal from the Pit according to Eq. 1B to obtain the Pi signal arising solely from the perfused heart (Pih, Figure 1B).
 Eq. 1B
11. Multi-parametric pH analysis
- Perform the conversion of the Pih signal chemical shift distribution to the pH with reference to the chemical shift of PCr using Eq. 231.
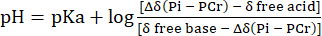 Eq. 2
Eq. 2
where Δδ is the chemical shift difference, pKa is 6.72, δ free base is 5.69, and δ free acid is 3.27, as previously described31. - Correct the resulting pH distribution curve for the non-linearity between the Pih chemical shift scale and the pH scale according to Lutz et al.32. A typical pH distribution resulting from this calculation is presented in Figure 1C.
- Analyze the tissue pH distribution with a multi-parametric approach using seven statistical parameters following the work of Lutz et al.32. Four of these parameters are presented here as they appear to be the most descriptive of tissue pH: 1) global maximum pH; 2) weighted mean pH; 3) weighted median pH; and 4) skewness of the pH plot (Figure 1C).
12. Calculation of the LDH and PDH activities
NOTE: The production rates of the hyperpolarized metabolites [1-13C]lactate and [13C]bicarbonate are used to calculate the LDH and PDH activities, respectively. In the product selective saturating-excitation approach15, only newly synthesized hyperpolarized metabolites are detected by each selective excitation.
- Use the hyperpolarized [1-13C]pyruvate signal as a reference to determine the corresponding metabolite production level.
- During the perfusion with the hyperpolarized medium, the [1-13C]pyruvate concentration in the NMR tube increases (wash-in), then plateaus (at a maximal concentration of 14 mM), and then decreases (wash-out).
- To identify the time points at which the pyruvate concentration reached a constant level (plateau), correct the [1-13C]pyruvate signal for signal decay resulting from T1 relaxation and RF pulsation using the effective relaxation constant, Teff.
- For each injection, define the Teff based on its ability to correct the [1-13C]pyruvate decay curve to show this flow dynamics (Eq.3).
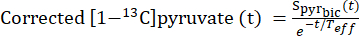 Eq. 3
Eq. 3
where is the [1-13C]pyruvate signal that was acquired during the [13C]bicarbonate acquisition. The average Teff in the experiments described herein was found to be 35.8 s ± 2.3 s (n = 5 hearts).
 - Select the data points in which the concentration is within 10% of the maximal corrected [1-13C]pyruvate signal for further analysis.
- Use the corresponding data of [1-13C]lactate and [13C]bicarbonate production for the time points selected in step 12.1 for the calculation of the metabolite production rates using Eq. 4A and Eq. 4B, provided that the SNR of the metabolite signal is larger than 2 (threshold for analysis). A typical example of such a selection of time points is shown in Figure 2B (highlighted temporal window).
- Calculate the production rates of each of the selected data points using Eq. 4A and Eq. 4B:
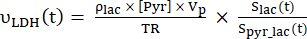 Eq. 4A
 Eq. 4B
where and
and  are the production rates of [1-13C]lactate or [13C]bicarbonate at each time point, respectively.
  and
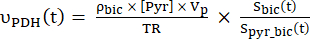
and  are factors that represent the relative excitation of [1-13C]pyruvate and the products [1-13C]lactate or [13C]bicarbonate, respectively. These factors were determined previously to be 0.113 and 0.139, respectively29. Vp is the volume that is detected by the NMR probe (1.375 mL), TR denotes the time interval between two consecutive product selective saturating excitations (12 s for each product),
  and
and  are the signals of [1-13C]lactate and [13C]bicarbonate, respectively, and
  and
and  are the signals of [1-13C]pyruvate that were acquired during the [1-13C]lactate and [13C]bicarbonate excitations, respectively. [Pyr] is the [1-13C]pyruvate concentration, which was 14 mM during the plateau phase.
- Determine the rate for each point and then average per hyperpolarized injection.
The 31P spectra recorded from a mouse heart perfused with KHB and from the buffer alone are shown in Figure 1A. The signals of α-, β-, and γ-ATP, PCr, and Pi were observed in the heart. The Pi signal was composed of two main components: in the higher field (left side of the signal), the Pi signal was mostly due to the KHB at a pH of 7.4; in the lower field (right side of the signal), the Pi signal was broader and less homogeneous due to the more acidic environment. The latter pattern arises from the cardiac tissue. The cardiac tissue Pi signal is extracted by subtracting the Pi signal of the KHB (Figure 1B) and then converted from the ppm scale to the pH scale (Figure 1C). The pH is investigated using a multi-parametric analysis of the tissue Pi signal by calculating the weighted mean, weighted median, global maximum, and skewness (Figure 1C).
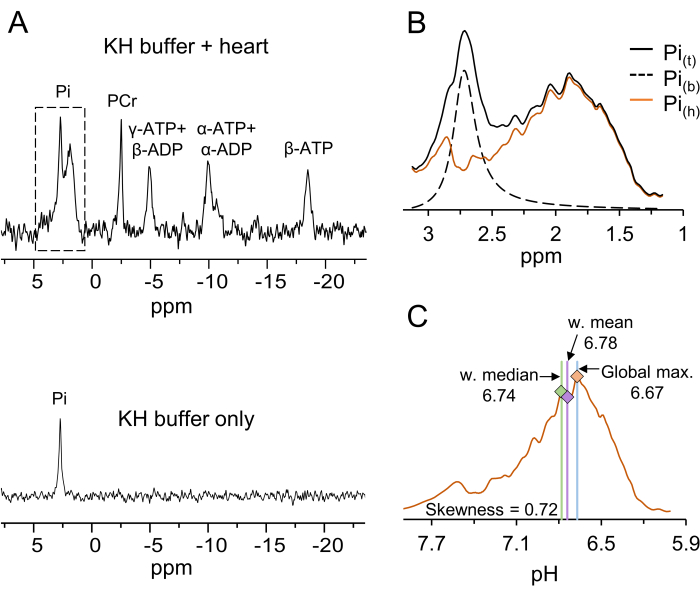
Figure 1: Typical 31P spectra, the distinction between the Pi signal of the KHB and the heart, conversion from the chemical shift to pH axes, and the statistical parameters of the pH distribution. (A) The upper panel displays a typical 31P NMR spectrum obtained from a mouse heart perfused with KHB in the spectrometer, while the lower panel shows a spectrum obtained from KHB alone. The dash-marked spectral region is shown enlarged in panel B. Abbreviations: Pi = inorganic phosphate; PCr = phosphocreatine; ATP = adenosine triphosphate; ADP = adenosine diphosphate. (B) The original spectrum is shown in black (Pit); the dashed curve shows the Pi signal from the buffer only (Pib). The latter was obtained by fitting a Lorentzian line shape with its center at the corresponding KHB component of the Pit signal and adjusting for the amount of KHB in the probe following the heart insertion (according to Eq. 1A). The Pi signal attributed to the heart (Pih) is shown in orange, and this is obtained by subtracting the Pib signal from the Pit signal (according to Eq. 1B). (C) Conversion of the Pih signal chemical shift distribution shown in (B) to a pH distribution and multi-parametric pH analysis. The non-linearity between the chemical shift and the pH scales was corrected as previously described32. The results of the multi-parametric pH analysis are marked by the vertical lines. For this specific distribution, the values of the statistical parameters are provided. Please click here to view a larger version of this figure.
With the hyperpolarized product selective saturating-excitations acquisition approach15, it is possible to perform absolute quantification of the LDH and PDH enzyme activities. Figure 2 summarizes the acquisition and processing steps required for this determination. Table 1 shows the ATP content and the LDH and PDH rates in five different hearts. Normalizing the LDH and PDH activities to the ATP content of each heart reduced the variability in the LDH and PDH measurements across the group, as can be seen in the enzyme activity columns in Table 1, which are expressed in units of nmol/s/µmol ATP.
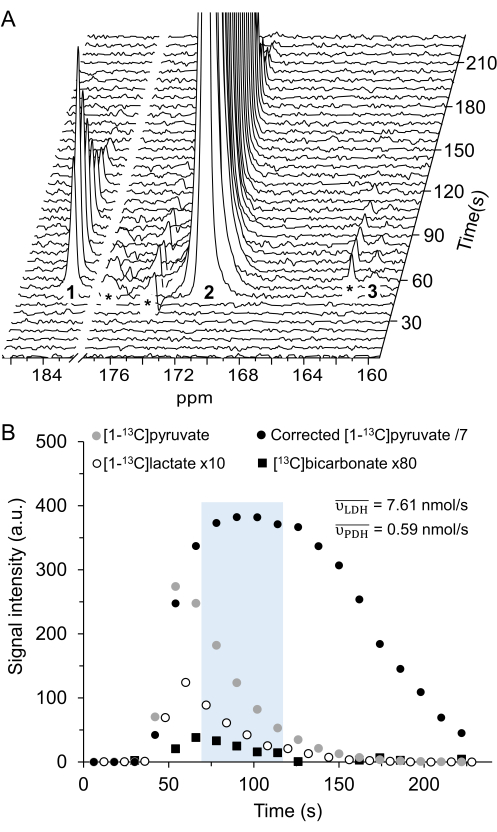
Figure 2: Hyperpolarized 13C MRS processing and analysis of [1-13C]pyruvate metabolism. (A) Representative 13C NMR spectra acquired with the product selective saturating-excitations approach during an injection of 14 mM of hyperpolarized [1-13C]pyruvate into the perfused mouse heart. Signal assignment: 1 = [1-13C]lactate (183.2 ppm); 2 = [1-13C]pyruvate (171 ppm); 3 = [13C]bicarbonate (161.1 ppm); * = impurities arising from the [1-13C]pyruvate formulation33. (B) Time course of the hyperpolarized signal intensities displayed in A. The integrated intensities of [1-13C]pyruvate (grey) were adjusted for T1decay and RF pulsation with a Teff time constant of 32 s (black), and this yielded the expected flow dynamics for the substrate (wash-in, plateau, wash-out). Further analysis was performed on the data points within the time window in which the adjusted [1-13C]pyruvate signal showed a constant and maximal [1-13C]pyruvate concentration in the NMR tube (highlighted in light blue). The production rates of LDH and PDH ( and
and  ) for the selected time points were calculated according to Eq. 4A and Eq. 4B and then averaged. The mean values for this injection (
 and
and  ) are provided in units of nmol/s. For display purposes, the adjusted [1-13C]pyruvate, the [1-13C]lactate, and the [13C]bicarbonate were multiplied by 0.143, 10, and 80, respectively, relative to the [1-13C]pyruvate signal. Please click here to view a larger version of this figure.
| Heart No. | ATP (µmol) | LDH rate (nmol/s) | PDH rate (nmol/s) | LDH rate (nmol/s/µmol ATP) | PDH rate (nmol/s/µmol ATP) |
| 1 | 0.49 | 7.61 | 0.59 | 15.4 | 1.19 |
| 2 | 0.25 | 3.66 | 0.32 | 14.42 | 1.26 |
| 3 | 0.51 | 6.01 | 0.66 | 11.81 | 1.3 |
| 4 | 0.53 | 9.27 | 1.09 | 17.34 | 2.04 |
| 5 | 0.64 | 9.38 | 0.6 | 14.77 | 0.94 |
| Mean (SD) | 0.49 (0.13) | 7.19 (2.15) | 0.65 (0.25) | 14.75 (1.78) | 1.35 (0.37) |
| SD % Mean | 26.00% | 30.00% | 38.30% | 12.10% | 27.50% |
Table 1: ATP content and LDH and PDH rates in five hearts. Abbreviations: SD = Standard deviation; SD % Mean = the percentage of the standard deviation from the mean.
We demonstrate an experimental setup that is designed to investigate hyperpolarized [1-13C]pyruvate metabolism, tissue energetics, and pH in an isolated mouse heart model.
The critical steps within the protocol are as follows: 1) ensuring that the pH of the buffer is 7.4; 2) ensuring that all components of the buffer are included; 3) avoiding blood clotting in the cardiac vessels by heparin injections; 4) avoiding ischemic damage to the heart by reducing the metabolic activity (KCl injection and ice-cold buffer); 5) avoiding the introduction of air bubbles into the heart at any point of the procedure; 6) validating successful cannulation of the aorta by the color of the tissue, which changes from dark red to light pink; 7) making sure that the perfusion is continuous once the heart is moved to warm buffer; 8) closely monitoring the temperature inside the NMR tube in the spectrometer next to the heart and keeping it at 37 °C; 9) checking the magnetic field homogeneity throughout the measurement; and 10) using accurate and updated calibration for the RF pulses.
Modifications and troubleshooting of the technique
We note a couple of modifications that were made in this study: 1) the initiation of perfusion with ice-cold KHB further to surgery was employed to protect the heart; and 2) the validation of the buffer pH was performed throughout to make sure that this parameter was under control and was not a source of variation in the results. This was done in the various steps of preparation and experimentation using a pH meter, pH indicator strips, and the Pi signal on the 31P spectrum.
Sources of variability and how to correct for them
The mouse heart was chosen to fit into a 10 mm NMR tube. However, this small heart provides low signals, and the delicate surgical procedure for isolating and perfusing the heart is challenging. Overall, this leads to variable tissue viability and metabolic activity. To account for this variability, we normalized the metabolic rates of LDH and PDH to the ATP content (i.e., mole/s/ATP). A similar use of the ATP content as a reference was previously reported in xenograft breast tumor slices29. This type of normalization is beneficial because it allows for comparison with the results of other researchers and with other conditions. In addition, by using a conversion factor from the ATP amount to the tissue mass, one may derive the enzymatic activity per tissue weight (for the tissue in which metabolism occurs).
In addition to the variability between different isolated heart preparations (i.e., from different animals), the tissue Pi (Pih) chemical shift showed a non-homogeneous distribution in this study. Lutz et al.32 demonstrated a similar non-homogeneous distribution in xenograft tumors, and this distribution was analyzed using a multi-parametric approach. In this work, this methodology was implemented in the perfused mouse heart. We note that it is likely that the Pih signal reports predominantly on the intracellular pH, as indicated previously16.
Uncertainty
An underlying assumption in the quantification of and is that the hyperpolarized [1-13C]pyruvate solution is filling the entire volume detected by the NMR probe (Vp, Eq. 4A and Eq. 4B). The hyperpolarized [1-13C]pyruvate solution flows through the coronary arteries of the heart to fill the extracellular and intracellular compartments. Therefore, the heart volume is assumed to be filled with the hyperpolarized solution to the same extent as the rest of the Vp.
Using the hyperpolarized product selective saturating-excitations approach15,29, the enzymatic activity can be quantified independently of any variations in the T1 of the metabolites and the reversibility of the enzymatic reaction. This determination is robust and immune to variations in T1 and excitation profiles and is likely more reproducible across labs compared to area under the curve analyses, which are dependent on the specific acquisition conditions and setup in each lab.
Investigating [1-13C]pyruvate metabolism, which is at the crossroad of aerobic and anaerobic metabolism, is of great value for studying hypoxia, ischemia, reperfusion injury, starvation, and alteration in cardiac metabolism, such as in diabetic cardiomyopathy. Hyperpolarized 13C-labeled pyruvate analogs have been tested clinically34,35,36,37,38,39,40,41,42,43, and, therefore, the results of such studies are likely translational. Most importantly, our approach enables the quantification of in-cell enzyme activity in the whole organ.
The isolated rodent heart preparation and the procedures and methodologies involved in this research will help to further the understanding of the effect of a variety of stressors on cardiac function, energetics, and metabolism, as the measured parameters in this model are attributed solely to the heart. As opposed to the rat heart, the mouse heart is suitable for studying transgenic models.
