1. Flow Cell Preparation
- Coverslips (#1.5, 22×22 mm and 22×40 mm, VWR) are cleaned using sonication.
- Add the coverslips to a small glass container capable of holding coverslips and fitting in the sonicator (see step 2).
- Fill the container with isopropanol and sonicate in a bath sonicator for 20 minutes.
- Discard the isopropanol and rinse the coverslips with copious quantities of deionized water produced by a Barnsted MilliQ apparatus or similar device. Fill the container with water and sonicate for 20 minutes.
- After sonication, dry the coverslips in a stream of filtered, dust-free air. Use only coverslips that appear clean (i.e. no smudges).
- Gently flame the coverslips for a few seconds to clean them of any remaining dust and moisture: pass the coverslips through a gas flame produced with a Bunsen burner, taking care not to warp the coverslip due to excess heat. This step removes residual surface contaminants.
- Using double-sided scotch tape, attach the two coverslips together. Cut the tape ~3 cm in length, and 0.3 cm in width. Attach the tape on 22×40 mm coverslip leaving a 1.6 cm channel in the middle. Use a pipette tip to gently press down on the coverslip to ensure that the tape has properly adhered.
2. Magnetic Tweezers Setup and Calibration
- Magnetic tweezers were setup using permanent rare-earth magnets as described previously10,12. An aluminum L-bracket was constructed with a 1 mm diameter pinhole and mounted on a vertical z-translator (Thorlabs) to modulate the height of the tweezers. Two permanent rare-earth magnets were attached to the bracket on either side of the pinhole to create the magnetic trap (Figure 1).
- DNA preparation: DNA from lambda phage labeled at its 5′ and 3′ ends with biotin and digoxigenin (IDT DNA, San Diego, CA) was used to calibrate the magnetic tweezers.
- Mix 50 μL of 4 nM λ-DNA with 2 μL of 40 nM biotin conjugated oligonucleotide and heat at 60 °C for 10 minutes. Then slowly cool at room temperature over 1 hour.
- Add DNA ligase according to manufacturer’s specifications and ligate at room temperature for 3 hours.
- Add 2 μL of 400 nM digoxigenin conjugated oligonucleotide and incubate at room temperature for 45 minutes.
- Add 1.5 μL of 10 mM ATP and continue ligation of the digoxigenin conjugated oligonucleotide to the λ-DNA for 3 hours.
- Remove the excess oligonucleotides and the DNA ligase using 100 kDa spin filters (Microcon Ultracell YM-100). A total of 1000-fold buffer exchange in TE buffer is adequate to remove the excess oligos. Note: It is important not to use spin speeds >500xG because it will lead to the shearing of the DNA.
- Examine a sample of the DNA via electrophoresis on a 0.7% agarose gel to ensure that the DNA is not denatured or sheared.
- Measure concentration of DNA. The use of a Nanodrop UV-Vis spectrometer (Thermo Scientific) is recommended because the available sample volume may be very small.
- Prepare flow cells as described in section 1.
- For the attachment of the DNA to the flow cell, add anti-digoxigenin antibody (sheep IgG; 1 μg mL-1; Roche Bioscience, Manheim, Germany) and allow it to adhere to the glass surface for 15 minutes.
- Passivate the surface of the flow cell to prevent non-specific sticking of DNA by adding 2 mg mL-1 BSA, 0.1% Tween-20 in 1x PBS. Incubate at room temperature for 45 minutes.
- Repeat step 2.5.
- Add 50 pM of fuctionalized λ-DNA and allow to attach to the coverslip for 15 minutes.
- Wash away excess DNA with 1x PBS.
- Add streptavidin-coated superparamagnetic beads (1 μm beads = 2 μg mL-1; 2.8 μm beads = 20 μg mL-1) and allow them to attach to the immobilized DNA for 15 minutes.
- Wash away excess beads with 1x PBS.
- Magnetic Tweezers Calibration
- Move the permanent magnets to a position that is far away from the sample surface (>15 mm).
- Place the prepared flow cell in the microscope.
- Move the permanent magnets into position above the flow cell.
- Choose the focal plane of λ-DNA functionalized beads by focusing on the beads away from both glass surfaces. The correct focal plane is one in which the desired beads have a bright center.
- Take a video of bead motion at 80 Hz or greater for 500 frames.
- Move the magnet closer to the sample surface. For distances beyond 5 mm, move in 1 mm increments. For distances between 1 and 5 mm, move in 0.5 mm increments. For distances less than 1 mm, move in 0.25 mm increments.
- Repeat steps 2.11.5 and 2.11.6 at each new magnet position.
- For each data set, track the center of the beads using a 2D Gaussian fit.
- Calculate the force via Brownian fluctuations using:

where kBT is the Boltzmann thermal energy, L is the length of λ-DNA, and <x2> is the variance in centroid position.
- Confirm the accuracy of the forces by checking the force calculation via a power spectrum Lorentzian fit in order to find the rolloff frequency. Applied force is related to the rolloff frequency by the relation:
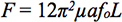
Where ƒ0 is the rolloff frequency, a is the bead radius, and μ is the fluid viscosity12.
3. Collagen Peptide Attachment to Flow Cells
In order to provide a concrete example for the application of our methodology, we describe recent work in our laboratory that characterizes the proteolysis of a trimeric collagen model peptide. We anticipate that this general approach may be broadly applied to other proteins and polynucleotides.
- The collagen model peptide consists of a N-terminal 6x His-tag for purification, followed by a 5x myc tag, (GPP)10 to enforce triple helix formation, the collagen α1 residues 772-786 (GPQGIAGQRGVVGL), which form the MMP-1 recognition site, the foldon sequence (GSGYIPEAPRDGQAYVRKDGEWVLLSTFL), and a C-terminal KKCK to facilitate labeling with biotin-maleimide. Foldon derives from the T4-phage protein fibritin, and stabilizes collagen model trimers when fused at either the N– or C-terminus13,14.
- The collagen peptide and MMP-1 proteins were expressed and purified as described previously4,15.
- Add anti-myc (15 μg mL-1) to the flow cell and incubate at room temperature for 20 minutes to allow the anti-myc to attach to the surface of the flow cell.
- Passivate the flow cell to prevent non-specific attachment of proteins using 5 mg mL-1 BSA in the same way as described in step 2.5.
- Add 150 pM collagen peptide and allow it to attach to the antibody via the myc tag for 45 minutes.
- Wash away excess collagen using PBS buffer.
- Add streptavidin coated superparamagnetic beads (1 μm beads = 2 μg mL-1and 2.8 μm beads = 20 μg mL-1) and allow them to attach to the collagen molecules for 45 minutes. The 1 μm beads should be diluted to the desired concentration in PBS. The 3 μm beads should be separated from the solution using strong magnets, then resolubilized in PBS. This process should be repeated 3 times. We noticed that this step is essential to get the 3 μm beads to bind to surface-immobilized collagen peptide.
4. Force Proteolysis Assay
- Once the flow cell is assembled with collagen peptide and magnetic beads, image the flow cell in the magnetic trap under low, ~1 pN force. In our experience, a subpopulation of the beads is sometimes weakly adhered to the surface in a non-specific fashion. The application of modest force ensures that these beads are liberated.
- Add activated enzyme to the flow cell. In this case MMP-1 was pre-activated by adding 3.5 mM APMA (4-aminophenylmercuric acetate) and incubated at 37 °C for 3 hours. The activation was verified using SDS-PAGE.
- As soon as the flow cell is re-introduced into the magnetic tweezers apparatus, record a video spanning a few fields of view, typically yielding several hundred attached beads. This will be t = 0.
- Repeat the same process of recording several fields of view (while returning to the same field of view) at regular time points, till all the beads detach or no further proteolysis is discernable.
- Kinetic data analysis
- Count the beads in the various fields of view at different time points and average them. Normalize the number of beads by dividing the average number of beads at each time point by the number of beads at t = 0. This ensures that we can compare the rates of proteolysis from different experiments, because the absolute number of beads will differ from experiment to experiment.
- Plot the ratio as a function of time. In this case, we fitted it to an exponential decay plus a constant.
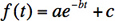
where ƒ(t) is the ratio of the beads attached (or collagen molecules unproteolyzed), t is time, a is the fraction of beads attached by a collagen tether, b is the decay rate constant, and c is the fraction of beads that are attached non-specifically.
- The same experiment is repeated at varying force and MMP-1 concentrations to elucidate the effect of force on collagen proteolysis by MMP-1.
5. Representative Results
The above protocol describes a novel use of magnetic tweezers (Figure 1) for studying the effect of force on enzymatic proteolysis. We calibrated the tweezers for 1 μm and 3 μm beads using both the magnitude of the observed Brownian fluctuations and calculation of the roll-off frequency at varying magnet positions (Figure 2). In the force proteolysis experiments, the setup is similar except that the DNA is replaced with collagen (Figures 3, 4). The normalized number of beads remaining can be plotted as function of time to find the proteolysis rates (Figure 5), and this process can be repeated for varying enzyme concentrations and forces.
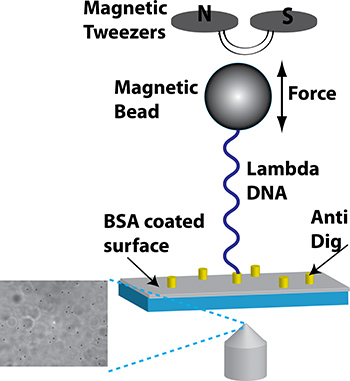
Figure 1. Schematic of the magnetic trap calibration process (not to scale). Two permanent rare earth magnets create a magnetic field that pulls on the superparamagnetic bead. Translating the magnet up and down adjusts the applied force. The beads are imaged using a conventional bright-field microscope with the light passing through a pinhole between the two magnets. Inset: Image taken with a 40x air objective. The sharp, round spots correspond to the beads attached to the coverslip surface. The out-of-focus objects are detached beads.
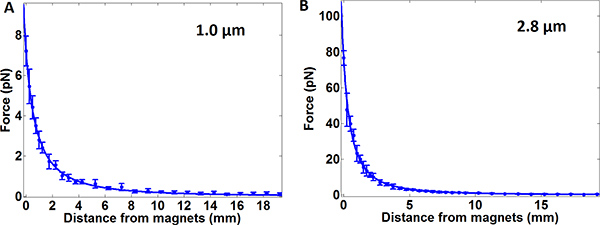
Figure 2. Plots of the calibrated force as a function of magnet distance from the sample surface for 1 μm (left) and 2.8 μm (right) beads. Data were fit to the empirical function 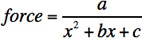 , where x is the distance from the magnet. a = 31.8, b= 5.61, and c = 4.39 for the 1 μm beads and a = 140, b = 3.10 and c = 1.86 for the 3 μm beads. These values are specific to our specific instrument and experimental geometry, and each instrument should be calibrated individually. The error bars at each point represent a ~10% variability in applied force on a bead to bead basis, due to the variability in bead size. The force applied is proportional to the volume of the beads, and the bead volume varies ~9% over the mean (according to manufacturer specifications).
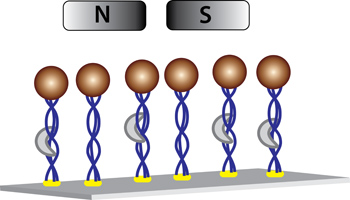
Figure 3. Force proteolysis assay setup (Not to scale). The collagen model trimer is attached to the surface of the coverslip via myc/anti-myc conjugation. The streptavidin-coated superparamagnetic beads are attached to the collagen trimers via a biotin-streptavidin linkage. Activated MMP-1 cuts the collagen over time, causing the beads to detach from the surface and move away from the focal plane.
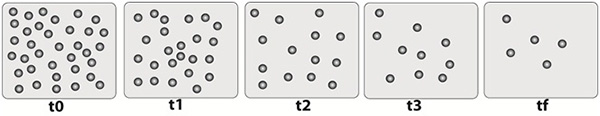
Figure 4. Schematic cartoon of proteolysis as a function of time. The cartoon shows a sample field of view over time as proteolysis occurs. Over time, MMP-1 cuts the collagen and the beads detach and move away from the focal plane under the influence of the magnetic field.
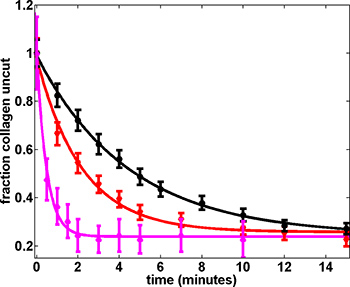
Figure 5. Proteolysis rates depend on applied force16. Shown are data collected at 1.0 pN (3 μM MMP-1; black), 6.2 pN (3 μM MMP-1; red) and 13 pN (0.2 μM MMP-1; magenta). The rates of proteolysis (fit parameters) are: 0.22 ± 0.02 min-1 (1 pN), 0.46 ± 0.09 min-1 (6.2 pN), and 2.08 ± 0.18 min-1 (13 pN). The fraction of beads unproteolyzed at long time points (> 15 minutes) remains approximately constant at ~0.25 across different experiments. Error bars correspond to the Poisson statistics reflecting the number of observations at each time point. The error at each time point for n beads is n1/2. The error in fraction of beads attached was calculated by error propagation.1 μm beads were used for 1.0 pN and 6.2 pN experiments and 2.8 μm beads were used for 13 pN experiments.
