A cyclic pressure bioreactor capable of subjecting heart valve tissue to physiological and pathological pressure conditions has been designed. A LabVIEW program allows users to control pressure magnitude, amplitude and frequency. This device can be used to study the mechanobiology of heart valve tissue or isolated cells.
The aortic valve, located between the left ventricle and the aorta, allows for unidirectional blood flow, preventing backflow into the ventricle. Aortic valve leaflets are composed of interstitial cells suspended within an extracellular matrix (ECM) and are lined with an endothelial cell monolayer. The valve withstands a harsh, dynamic environment and is constantly exposed to shear, flexion, tension, and compression. Research has shown calcific lesions in diseased valves occur in areas of high mechanical stress as a result of endothelial disruption or interstitial matrix damage1-3. Hence, it is not surprising that epidemiological studies have shown high blood pressure to be a leading risk factor in the onset of aortic valve disease4.
The only treatment option currently available for valve disease is surgical replacement of the diseased valve with a bioprosthetic or mechanical valve5. Improved understanding of valve biology in response to physical stresses would help elucidate the mechanisms of valve pathogenesis. In turn, this could help in the development of non-invasive therapies such as pharmaceutical intervention or prevention. Several bioreactors have been previously developed to study the mechanobiology of native or engineered heart valves6-9. Pulsatile bioreactors have also been developed to study a range of tissues including cartilage10, bone11 and bladder12. The aim of this work was to develop a cyclic pressure system that could be used to elucidate the biological response of aortic valve leaflets to increased pressure loads.
The system consisted of an acrylic chamber in which to place samples and produce cyclic pressure, viton diaphragm solenoid valves to control the timing of the pressure cycle, and a computer to control electrical devices. The pressure was monitored using a pressure transducer, and the signal was conditioned using a load cell conditioner. A LabVIEW program regulated the pressure using an analog device to pump compressed air into the system at the appropriate rate. The system mimicked the dynamic transvalvular pressure levels associated with the aortic valve; a saw tooth wave produced a gradual increase in pressure, typical of the transvalvular pressure gradient that is present across the valve during diastole, followed by a sharp pressure drop depicting valve opening in systole. The LabVIEW program allowed users to control the magnitude and frequency of cyclic pressure. The system was able to subject tissue samples to physiological and pathological pressure conditions. This device can be used to increase our understanding of how heart valves respond to changes in the local mechanical environment.
1. Tissue Harvest and Preparation
2. Pressure Studies
3. Representative Results:
The pressure system is capable of simulating the maximum transvalvular pressures observed under normotensive, stage I and stage II hypertensive conditions. However, the pressure was not able to mimic the systolic pressure gradient, which is essentially zero in vivo. Frequency is maintained at 1Hz, with an air inlet time of 0.6s and an exhaust time of 0.4s. Representative pressure waveforms of normal and elevated pressure conditions obtained from the system can be seen in figure 3.
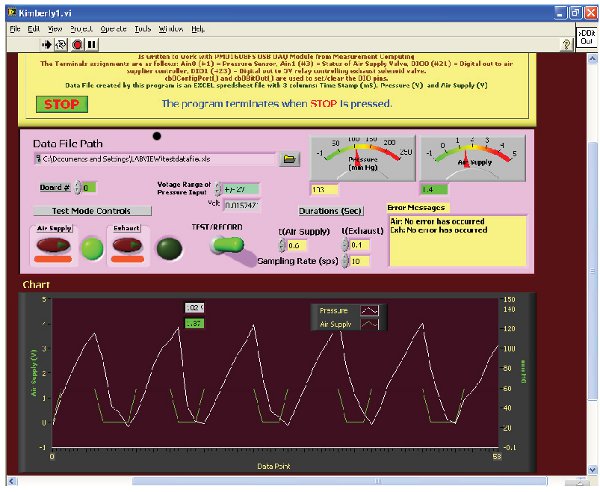
Figure 1: Screen shot of the LabVIEW interface.
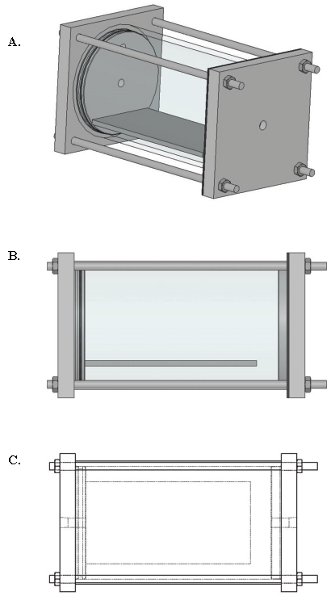
Figure 2: Schematic drawing of the pressure chamber A. Isometric view of pressure chamber; B. Side view of pressure chamber; C. Top view of pressure chamber.
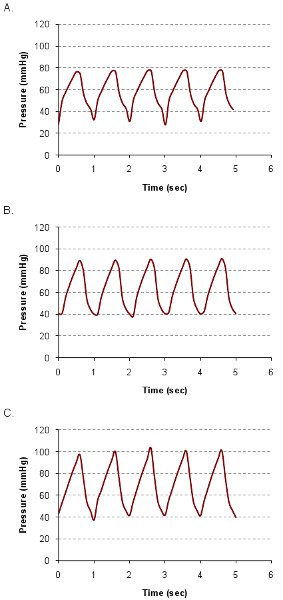
Figure 3: Graph of pressure simulation within the pressure chamber at (A) normotensive, (B) Stage I hypertensive, and (C) Stage II hypertensive conditions.
The pressure system successfully exposed aortic valve leaflets to cyclic pressures that were representative of diastolic transvalvular pressure. However, it was not able to mimic systolic transvalvular pressure, as the pressure only dropped to 40 mmHg. Transvalvular pressure is the difference between pressure in the ascending aorta and the left ventricle. During diastole, when the valve is closed, the pressure difference is 80mmHg under normotensive conditions and 90 mmHg and 100mmHg in stage I and stage II hypertension, respectively. During systole, when the valve is open, the pressure difference between the left ventricle and the ascending aorta is zero. The cellular changes that occur in aortic valve disease are believed to be associated with high diastolic pressure; therefore, the fact the pressure did not fall to zero may not be a major concern. This is based on the assumption that it is pressure magnitude and not pressure amplitude that is the driving force behind biological responses. Reducing the pressure from 100 mmHg to 0 mmHg requires 1.20 ± 0.04s, reported from data analysis of 20 pressure cycles. Since the amount of time the aortic valve is closed is approximately 2/3 of the cardiac cycle, the influx of air into the pressure chamber would require 2.4s to create the same balance of valve opening and closing experienced in physiological conditions. As a result, a frequency of 0.28 Hz would be used for testing the effects of both systolic and diastolic transvalvular pressure levels on aortic valve mechanobiology. However, if both systolic and diastolic transvalvular pressure are to be simulated at a physiological frequency of 1 Hz, a vacuum pump and reservoir could be fitted to the exhaust solenoid valve. The vacuum pump could be set to remove a fixed amount of pressure so when the exhaust valve opens, the amount of air required to completely reduce the pressure from the set pressure level would be drawn into the vacuum reservoir. The removal of the pressure would create a 0 mmHg environment, synonymous with systolic transvalvular pressure. Conversely, when the exhaust valve closes, the vacuum will no longer affect the chamber and would allow the pressure to increase via pressurized air. Besides using a vacuum pump to closer mimic physiological conditions, an exhaust valve with a larger diameter can be used to drop the pressure within the bioreactor more quickly. Currently, the 3/8″ diameter exhaust solenoid valve has a flow rate of 3.3 gallons per minute (at 60°F, specific gravity of 1); whereas, an exhaust valve with a 2″ diameter has a flow rate of 28.0 gallons per minute. A larger diameter solenoid valve is more cost effective than using a vacuum pump, however it may not be able to drop the pressure completely to zero within physiological range and should therefore be investigated further. Alternatively, several solenoid valves triggered by the same control circuit that open simultaneously could be added, thereby “parallel-processing” the gas outflow.
The system could be operated continuously using in-house compressed air. Previous studies have shown that acute changes in gene and protein expression can occur within two hours16, 17. However, this duration may not be sufficient to study transient gene/protein expression or changes in cellular phenotype as a result of mechanical stress. The drawback of using compressed air is that the gas does not contain 5% CO2, which is important for controlling the pH of the culture medium. This can be overcome by adding hepes buffer to the medium. Also, cells produce CO2 as a metabolic waste product. Secretion of CO2 from the tissue will also prevent the medium becoming basic.
In addition to testing aortic valves at varying pressures, it may be prudent to study the effects of varying frequencies as well. For example, the effects of changes in heart rate before, during, and after surgery could elucidate changes in protein expression within the valve. Postoperative arrhythmias occur in up to 20% of patients18-21. The LabVIEW program used for this system allows the user to choose the length of time air enters and leaves the chamber; therefore, the frequency of the cycle can easily be adjusted. The device allows for a maximum frequency of 1.5Hz (90bpm) due to the amount of time required to exhaust the pressure from the chamber. As seen in Figure 3, a major pressure decrease occurred in the first 0.2s after exhaust valve activation, then gradually declined to the residual pressure for the remaining 0.2s of exhaust. The average pressure drop in the initial 0.2s of exhaust was 45.8 ± 0.34mmHg, measured over 20 pressure cycles. Given that testing Stage II hypertensive conditions only requires cycling pressure between at least 60-100 mmHg, a frequency of 1.5 Hz allows 0.22s for exhaust, which is ample time to drop 40 mmHg of pressure. If a vacuum pump is attached to the exhaust valve, it could facilitate a faster drop in pressure and would allow higher frequency testing. The minimum frequency of the bioreactor is not limited, however, because the pressure regulator could allow slow influx of air and the exhaust valve would have sufficient time to drop the pressure within the reactor.
In conclusion, a sterile culture system has been constructed to allow the ex vivo study of porcine aortic heart valve mechanobiology. The pressure within the bioreactor cycled between diastolic transvalvular pressure levels for physiological and pathological conditions. To meet system requirements, the bioreactor was compact and could therefore be contained within a humidified incubator to maintain tissue temperature at 37°C. Furthermore, the pressure magnitude and frequency were controlled independently, allowing a wide range of conditions to be studied.
The authors have nothing to disclose.
The authors are grateful to Shad Schipke and Daniel Chesser for their assistance with the design and fabrication of the system and Valtresa Myles for assistance with preparing the manuscript.
Name of the reagent | Company | Catalogue number | Comments (optional) |
---|---|---|---|
DMEM | Sigma | D5671 | |
Dulbecco’s PBS | Sigma | D5652 | |
Anti-mycotic/antibiotic solution | Sigma | A5955 | |
Fetal Bovine Serum | ThermoScientific | SH30070 | |
Viton diaphragm solenoid valves | McMaster Carr | 4868K11 | |
Pressure Transducer | Omega Engineering, Inc. | PX302-200GV | |
Load cell conditioner | Encore Electronics, Inc. | 4025-101 | |
Data Acquisition (DAQ) Module | Measurement Computing | PMD1608 |