Isolated pancreatic acini retain their in vivo morphology and activity and offer powerful ways for monitoring and manipulating secretion. This work demonstrates how acini can be isolated from the mouse pancreas, and how their secretory capacities can be assessed.
Pancreatic acinar cells produce and secrete digestive enzymes. These cells are organized as a cluster which forms and shares a joint lumen. This work demonstrates how the secretory capacity of these cells can be assessed by culture of isolated acini. The setup is advantageous since isolated acini, which retain many characteristics of the intact exocrine pancreas can be manipulated and monitored more readily than in the whole animal. Proper isolation of pancreatic acini is a key requirement so that the ex vivo culture will represent the in vivo nature of the acini. The protocol demonstrates how to isolate intact acini from the mouse pancreas. Subsequently, two complementary methods for evaluating pancreatic secretion are presented. The amylase secretion assay serves as a global measure, while direct imaging of pancreatic secretion allows the characterization of secretion at a sub-cellular resolution. Collectively, the techniques presented here enable a broad spectrum of experiments to study exocrine secretion.
The exocrine pancreas constitutes most of the mass of the mammalian pancreas and is dedicated to production and secretion of digestive enzymes1. The functional unit of the exocrine pancreas, the acinus, is a cluster of epithelial cells which forms and shares a joint lumen. Upon hormonal or neuronal stimulation, vesicles filled with enzymes are transported to the apical cell surface, fuse with it and expel their content into the lumen1-3. The secreted enzymes are then drained by a coalescing set of ducts into the small intestine, where they catalyze the breakdown of food into nutrients.
This video demonstrates how intact acini are isolated from the whole pancreas and how their secretory capacity can be assessed. Using this setup, pancreatic secretion is quantified by measuring the relative amount of amylase that was released following stimulation. Alternatively, secretion can be imaged live by the use of different sensors and dyes.
The ex vivo setup of pancreatic acini is advantageous since isolated acini, which retain many characteristics of the intact pancreas, can be manipulated and monitored more readily than in the whole animal4-6. This setup was originally developed in the late 1970’s and was since extended for the study of several exocrine tissues such as the salivary and mammary glands3-7. Notably, it allows the study of secretion with minimal interference to the complex cellular organizations of these polarized epithelia.
NOTE: Procedures involving animal subjects have been approved by the Institutional Animal Care and Use Committee (IACUC) at the Weizmann Institute of Science.
1. Sample Preparation
2. Amylase Secretion Assay
NOTE: The amylase secretion assay serves as a global measure for the secretory capacity of pancreatic acini. This is achieved by collecting the medium in which the pancreatic acini were incubated, and determining the amylase activity of the medium, usually by using a commercial kit.
3. Live Imaging of Pancreatic Secretion
Secretion from pancreatic acini can be monitored directly by live imaging. Using various fluorescent dyes and sensors, live imaging allows the characterization of secretion at a sub-cellular resolution.
4. O/N Culture of Pancreatic Acini (Alternate Cell Culture Technique)
NOTE: O/N culturing is often used for Adeno virus infection. Infection is carried out at 106-107 pfu/ml for 9 – 16 hr before examination.
Pancreatic acini that were isolated properly display a stereotypic morphology when viewed by transmitted light. Their basolateral domains should appear round and devoid of blebs. The apical domain is surrounded by hundreds of secretory vesicles and appears darker in color (Figure 2A, B). The nuclei are located basal to the vesicular area. Cell debris and components of the pancreatic ductal system and of the endocrine pancreas, which can be detected at early stages of acini isolation (Figure 2C, D), should be absent from the final acinar suspension (Figure 2A, B). Improper isolation may result in generation of basolateral blebs and breakage of cells which discharge their digestive enzymes into the medium (Figure 2E, F).
Amylase release from pancreatic acini depicts a bi-phasic curve when plotted against the concentration of secretagogues (Figure 3A). Without stimulation about 5% of the initial content is released during 30 min of incubation. Following stimulation, this number is elevated by up to 5 fold. Acini which were cultured O/N, display a lower ratio of stimulated vs. basal amylase release when compared to freshly isolated acini. Importantly, cultured acini that were infected by Adeno viruses display a high basal amylase secretion and a sensitized stimulated secretion (Figure 3B, C). It is thus critical to infect control acini with a similar dose of control virus.
Live imaging of acini should allow clear identification of the basolateral and apical domains of acinar cells. Lipophilic dyes can be instrumental for distinguishing between the narrow apical domain and the lateral and basolateral aspects of the cells (Figure 4). Under physiological stimulation, secretion is directed exclusively to the apical surface1,9. Use of the F-actin probe Lifeact-GFP allows live visualization of secretory vesicles, since pancreatic zymogen vesicles undergo actin coating shortly before exocytosis (Figure 4).
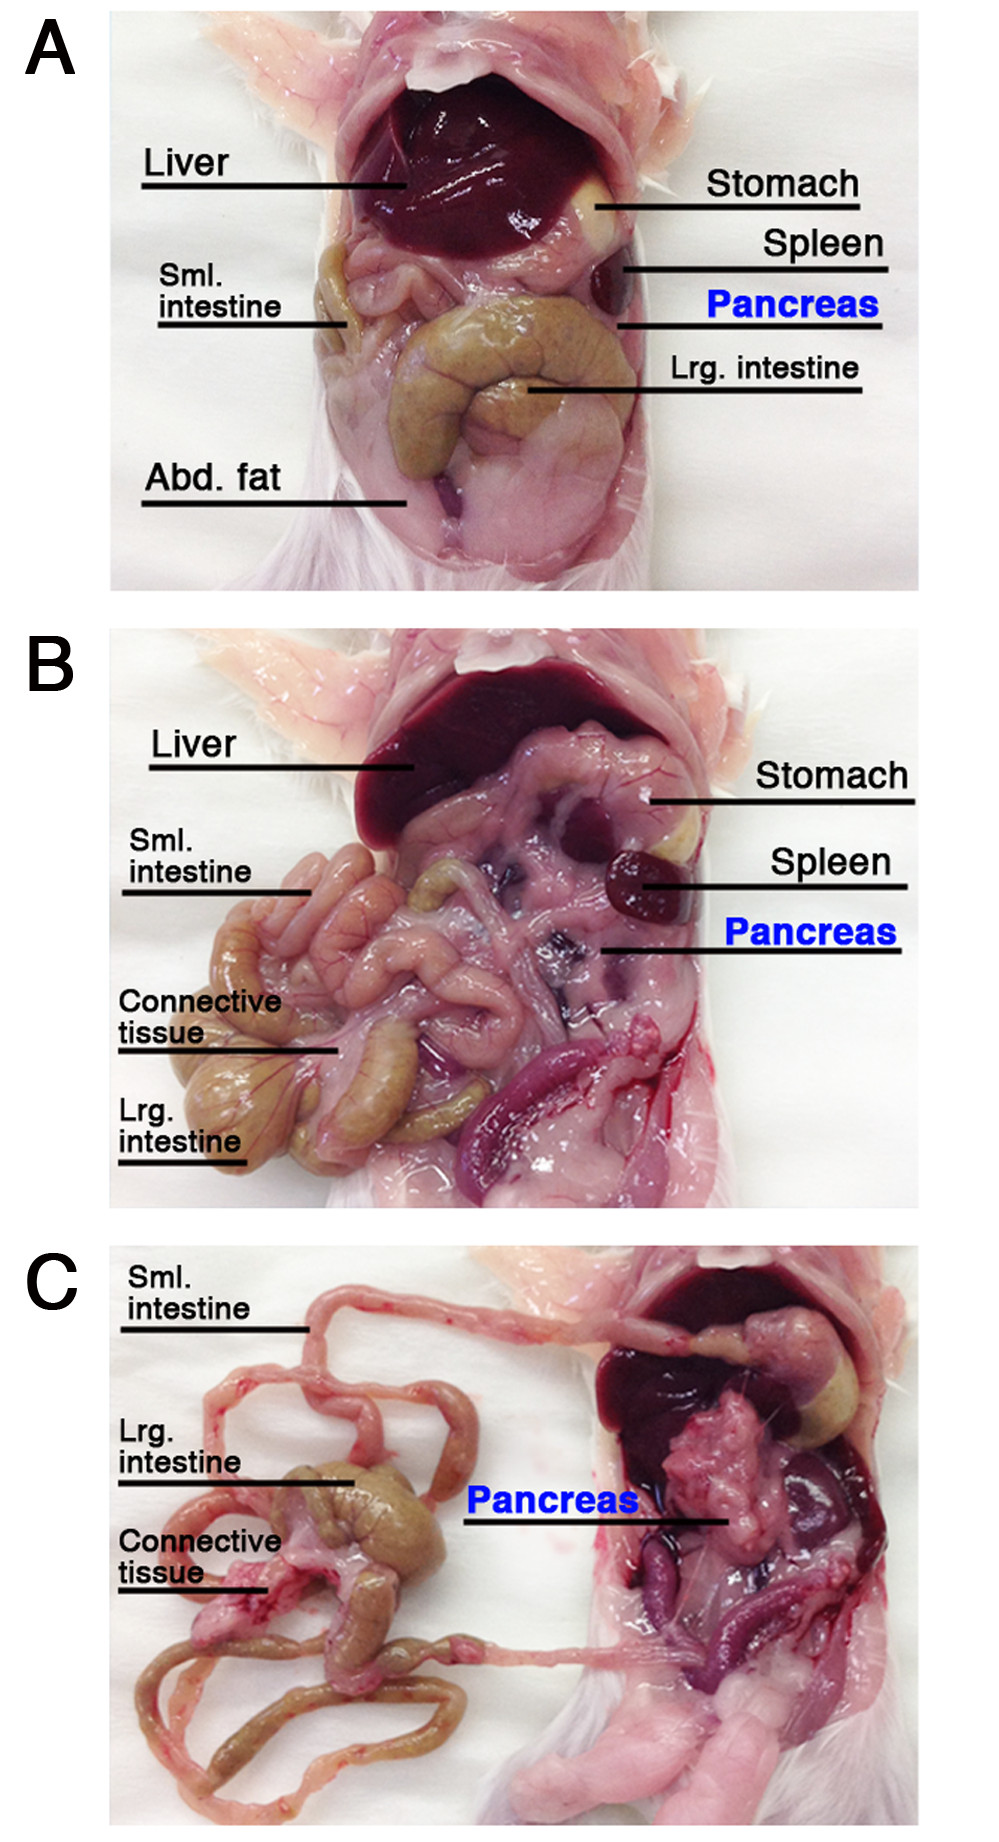
Figure 1. Localization of the pancreas and adjacent organs. (A-C) The pancreas and adjacent organs after the incision of the abdominal skin and subcutaneous layer (A), before and after pancreatic separation from neighboring organs, (B) and (C), respectively. Please click here to view a larger version of this figure.
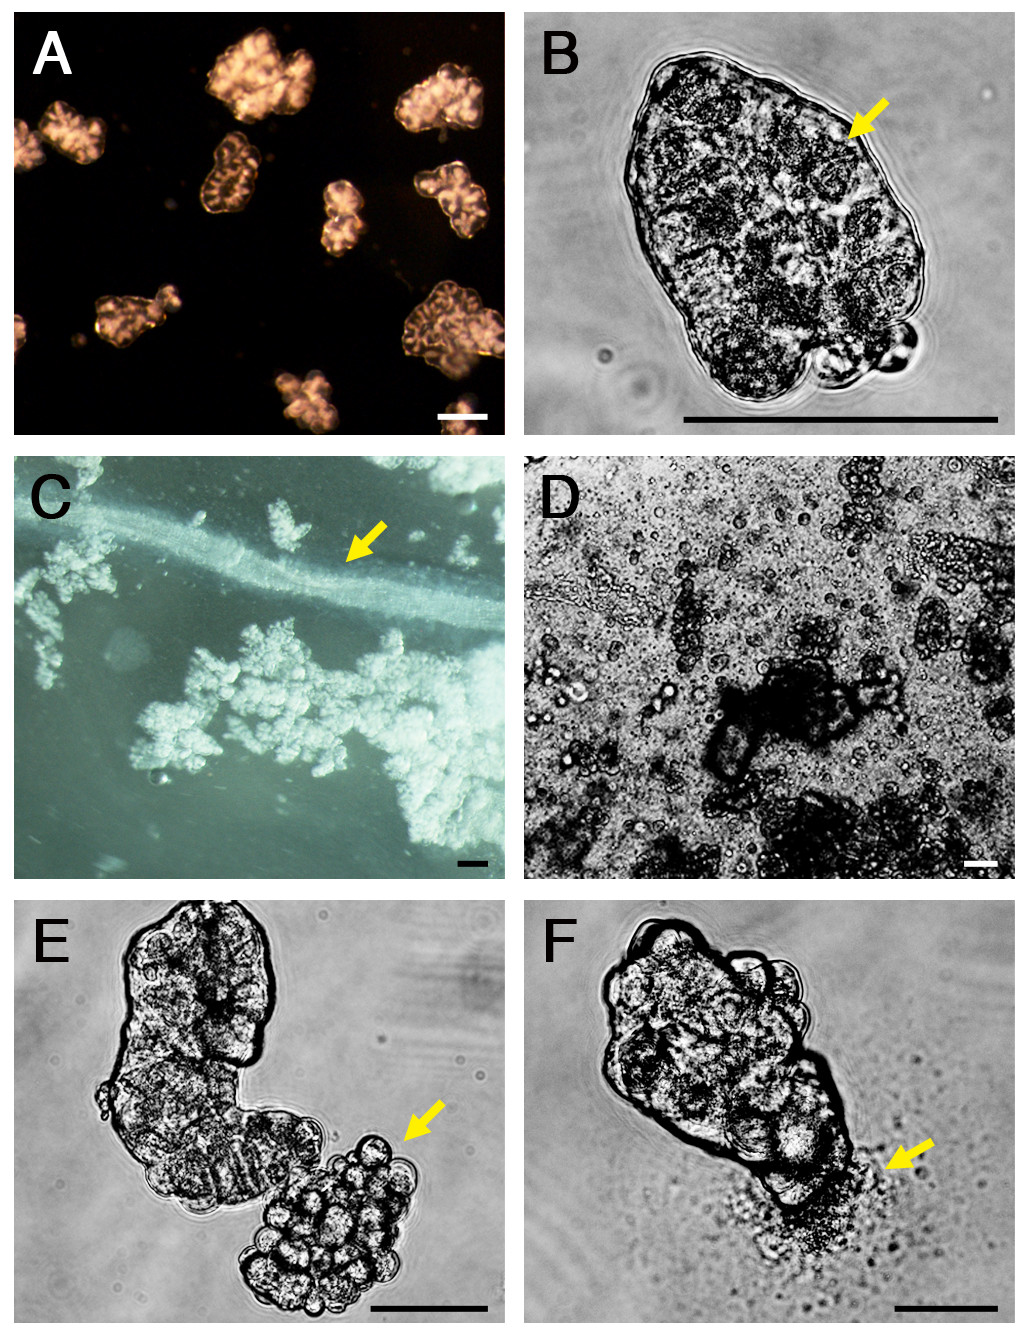
Figure 2. Isolation of pancreatic acini. (A) and (B) Pancreatic acini isolated properly display a stereotypic morphology; their basolateral domains appear round and devoid of blebs, while their apical domain are surrounded by hundreds of secretory vesicles and appears darker in color (arrow). (C) and (D) Cell debris and components s of the pancreatic ductal system can be detected at early stages of acini isolation (arrow points to an exocrine duct). (E) and (F) Improper isolation results in generation of basolateral blebs (E, arrow), and breakage of cells, which discharge their digestive enzymes into the medium (F, arrow). Scale bars represent 100 µm. Please click here to view a larger version of this figure.
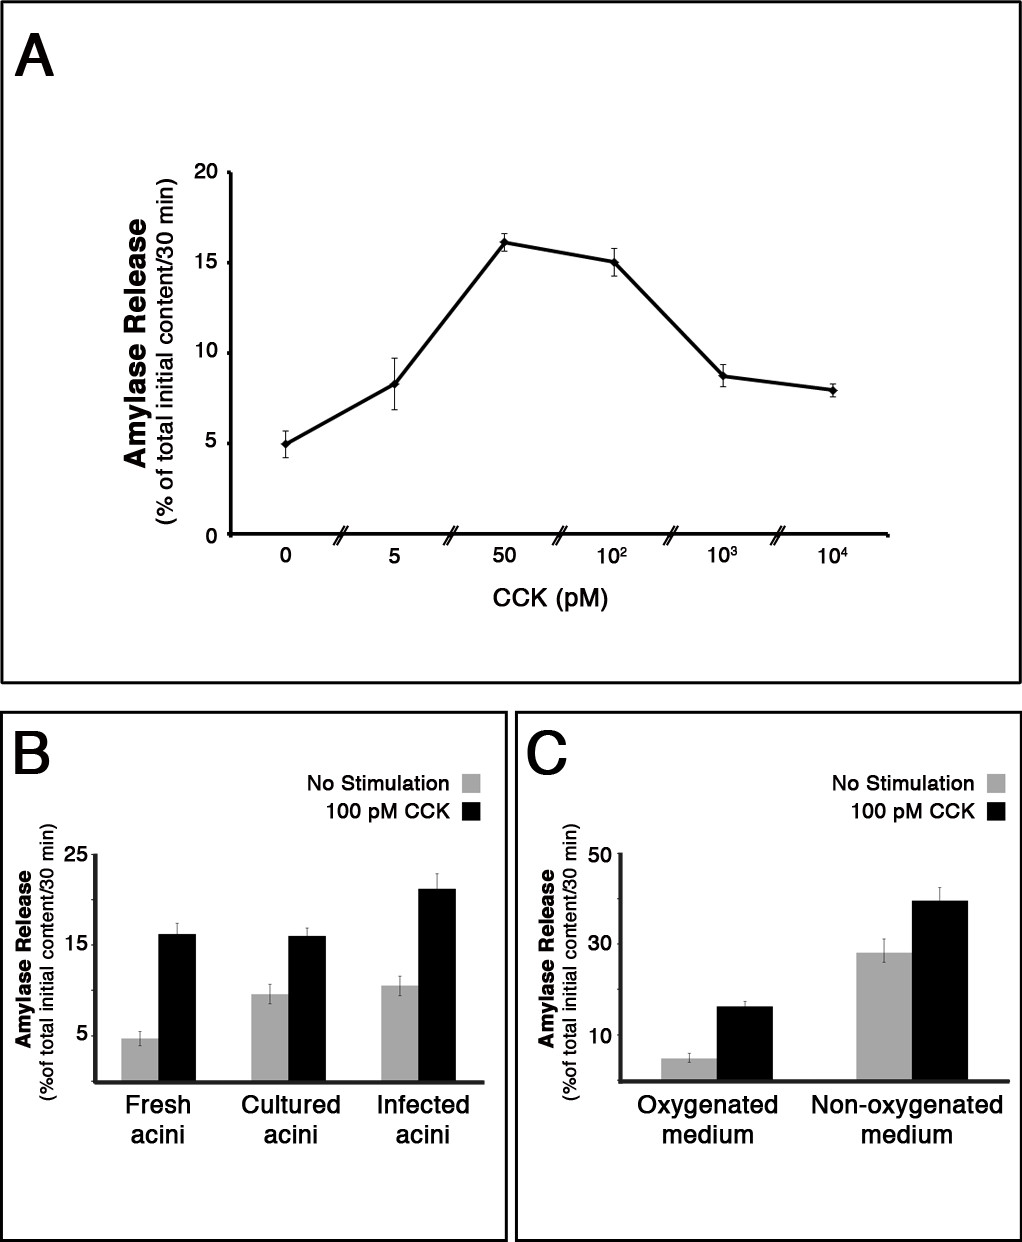
Figure 3. Measurement ofamylase release from isolated acini. (A) Amylase release from pancreatic acini depicts a bi-phasic curve when plotted against the concentration of a secretagogue. Acini were isolated and left to recover for 30 min before stimulation with the indicated concentrations of Cholecystokinin (CCK). Results represent the average and s.e.m. of three independent experiments. (B) Acini which were cultured O/N, display a lower ratio of stimulated vs. basal amylase release when compared to freshly isolated acini. Cultured acini that were infected by Adeno viruses display a high basal amylase secretion and a sensitized stimulated secretion. (C) Non-oxygenating culture conditions lead to excessive discharge of amylase, which masks the stimulatory effect of the secretagogue.
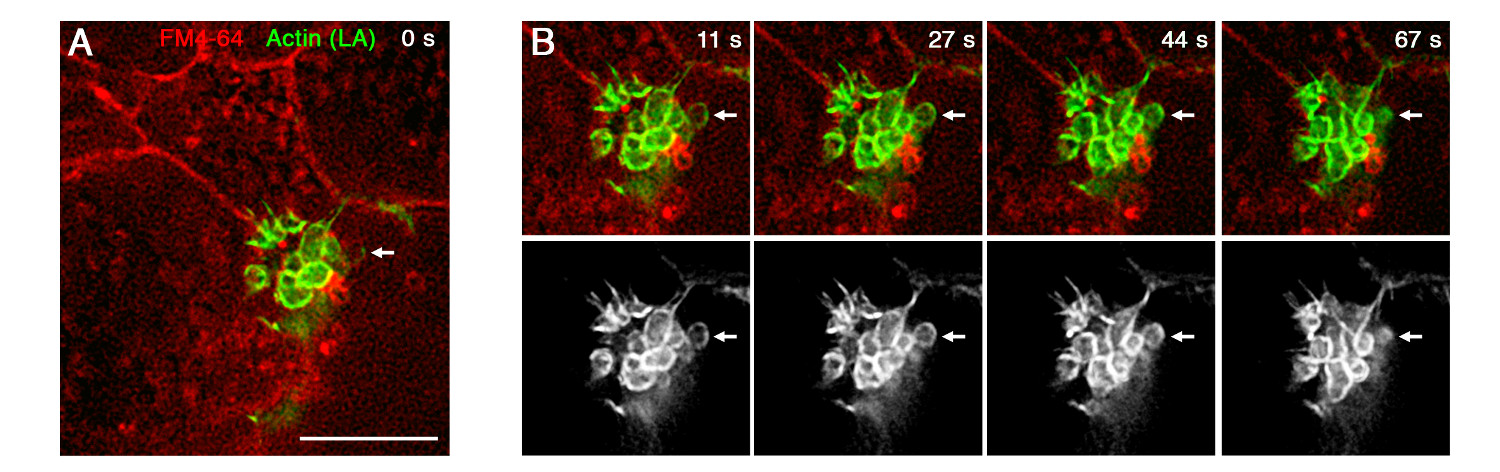
Figure 4. Live imaging of pancreatic secretion. Live stimulated acinar cells, expressing Lifeact-GFP (LA, green, gray) and stained with the lipophilic dye FM4-64 (red). Use of the Lifeact probe allows live visualization of single fusion events of actin-coated vesicles (arrows). Cells were infected O/N with adenovirus-Lifeact-GFP (Ad-Lifeact-GFP), stained and stimulated briefly with 100 pM CCK before the initiation of imaging. Scale bar represents 5 µm. Please click here to view a larger version of this figure.
Besides the ex vivo culture, alternative setups for the study of exocrine secretion include intravital microscopy and measurement of fluids from the pancreatic duct. Intravital microscopy was shown to operate well in the mouse salivary glands10. This method can record secretion in real time in the intact animal, but is limited in its resolution and by the means for manipulating the exocrine tissue. Assessing secretion by collecting fluids from the pancreatic duct was achieved in anesthetized rats11. However, since cannulation of the pancreatic duct is extremely difficult, this method is seldom used.
Compared with these setups, the ex vivo culture of pancreatic acini is simple, rapid and allows accessible means for monitoring and manipulating the cells, without interfering with the organization of the intact tissue4,5. Nevertheless, this setup has its shortcomings. Pancreatic acinar cells are delicate in nature and very sensitive to variations in culture conditions. Since the cells are loaded with proteolytic enzymes, they are prone to lysis and cell death. As a consequence, this culture is short lived and usually does not last over 20 hr.
It is always best to identify and troubleshoot problems as they arise. The key methodological step is to isolate intact pancreatic acini without significant signs of cell damage and mortality. Such signs are readily apparent, and include excessive cell debris and acini with basolateral blebs or intracellular vacuoles. In the amylase secretion assay, cell damage will lead to a low stimulated/non-stimulated secretion ratio. In order to prevent such damage, it is recommended to handle the tissue gently, add BSA and STI to the medium, and to enrich it with oxygen. For example, without oxygenation, excessive cell discharge of amylase masks the stimulatory effect of the secretagogue (Figure 3C). Yet, due to the fragility of the exocrine tissue, some tissue damage is almost inevitable – such preparations should be discarded.
For the amylase secretion assay, the supernatant, which contains the secreted amylase but is free from cells, can be kept at 4 °C for 1 – 2 days. This supernatant should then be assayed by a commercial kit. Many available kits rely on a cleavage of an artificial amylase substrate and the subsequent release of a chromophore. Thus, higher amylase concentrations lead to a faster change in the solution’s color. Since the secreted amylase will eventually release all the chromophore from the substrate, it is essential to follow the reaction over time, and use only the data collected during the linear phase.
Live imaging of pancreatic acini can be a frustrating experience for the researcher. Some cell preparations, especially those of infected acini, may not be suitable for live imaging due to compromised morphology of the acini or to insufficient levels of the fluorescent sensors. Even in suitable preparations, it may take time to locate appropriate specimens. Thus imaging may require considerable time. Lifeact-GFP, an F-actin probe, is noteworthy12. This tool allowed us to follow the dynamics of F-actin during pancreatic secretion for up to 16 hr after infection, at a level of resolution that could not be attained in fixed acinar samples. In addition, use of the Lifeact probe enabled tracking of single exocytosis events, as pancreatic zymogen vesicles undergo actin coating shortly before exocytosis3,13.
Collectively, when mastered, the techniques described here offer the researcher means to evaluate pancreatic secretion, and by harness it to identify novel participants in this multi-step process. In addition, in view of the structural and functional similarities between the pancreas and other exocrine organs, these techniques can be applied to other exocrine tissues as well3.
The authors have nothing to disclose.
This work was funded by a grant from the US-Israel BSF to B.S. and E.D.S. B.S. is an incumbent of the Hilda and Cecil Lewis professorial chair in Molecular Genetics.
ICR mice | Harlan | Any strain will do | |
HBSS | Sigma Aldrich | H8264 | Can substitude for KRB |
BSA | Sigma Aldrich | A7906 | Fraction V |
Trypsin inhibitor | Sigma Aldrich | T9003 | |
Collagenase XI | Sigma Aldrich | C0130 | |
Nylon mesh | BD Falcon | 352360 | 70-100µm |
Amylase infinity reagent | Thermo | TR25421 | |
CCK | Sigma Aldrich | C2175 | |
FM4-64 | Lifetechnologies | F34653 | Diluted to 16µM |
20mL scintillation vial | Sigma Aldrich | Z190527 | |
DeltaVision system | Applied Precision | Consisting of an inverted microscope IX71 equipped with 60x/1.4 or 100x/1.3 objectives (Olympus) | |
Zeiss 510 or 710 confocal microscope | Zeiss | 60x/1.4 or 100x/1.4 objectives | |
Ultra Microplate reader | BioTek | ELx808 |