Fatigue failure in metal structures that undergo cyclic loading can occur without warning at loads significantly below the ultimate strength of a structure. It is difficult to model this behavior, so it is important to assess fatigue characteristics in the laboratory and to monitor fatigue cracks in the field.
The collapse of the Silver Bridge over the Ohio River brought the importance of metal fatigue to the attention of the engineering community in 1967. The bridge failed in a brittle fashion due to corrosion fatigue, killing 46 people. The fatigue failure occurred in an eyebar connection not visible to inspectors, and was probably due to a manufacturing flaw.
Fatigue failure can happen as materials experience many cycles of loads at stresses that may only be 30 to 40% of their ultimate strength. Crack growth and propagation during this type of cyclic loading can result in sudden fatigue failure with few warning signs. Fatigue is a complex process with many factors effecting fatigue resistance.
High cycle, low stress range conditions occur in equipment or structures with moving parts or loads, like cars on bridges or rotating machinery in a manufacturing plant. Low cycle, high stress range fatigue occurs in situations such as earthquakes.
This video will illustrate the need for laboratory testing of materials and monitoring of structures subjected to repeated low stress, high cycle loading to avoid catastrophic fatigue failures.
A fatigue crack usually initiates at an angle to the normal stress, but then turns and grows perpendicular to the principle tensile stress. The crack propagates under tensile, or sheer stress, but not under compressive stress.
After repeated loading, the crack reaches a critical length and it suddenly propagates at the speed of sound, leading to immediate failure. The initial crack growth produces characteristic beach marks on the fatigue fracture surface. A rougher fracture surface is produced on the material surface that fails suddenly.
Fatigue failure is defined by the number of cycles and the stress range to failure. As the applied stress range increases, the number of cycles to failure decreases. Most metals and ferrous alloys have an endurance limit below which they will not fail regardless of the number of cycles. The cycles at a particular stress range is random in real life cyclic loading. Because of this, there is more than one stress range and more than one corresponding number representing cycles to failure.
Miner’s rule is used by defining a set of stress ranges and grouping cycles into these ranges. The number of loading cycles expected is divided by cycles to failure for each stress range and summed. If the sum is greater than 1, fatigue failure is possible. Although there is no physical basis for this equation, it is useful for engineering design purposes. A large number of stress ranges and cycles to failure can be tested using a rotating beam test.
In this test, a cantilever bending configuration is used while the specimen is rotated. The load to be applied is determined using the yield strength to calculate a set of stress ranges. For example, a typical structural steel has a yield strength of 50 ksi, and the calculation for the first stress range of plus or minus 15% gives a load of plus or minus 7.5 ksi. This load is applied and the specimen experiences full tension and full compression during each revolution.
An S-N curve is produced relating the stress range to the log value of the number of cycles to failure. In the next section, we will test steel specimens using a more rotating beam machine to produce an S-N curve for the material.
Obtain five A572 grade specimens to be tested using a rotating cantilever setup on a Moore rotating beam machine. The dimensions of the specimens used and the distances to the loading points are particular to the testing machine being used.
These dimensions may vary with your own test setup. Our specimens are 2.40 inches in length and 0.15 inches in diameter. The small necked section of each specimen is 0.50 inches in length and 0.04 inches in diameter.
Mount the first specimen in the machine with the necked section near the middle of the beam. Measure the distance from the center of the specimen to the load point. Carefully align the specimens so that the beam rotates freely and without wobbling, and then apply a load at the cantilever end. The cantilever specimen is loaded at the tip by using a point load generated by a set of springs and whose value is monitored by a load cell. The load is applied through a bearing so that the force is always downwards as the beam rotates.
The machine speed is set at 1400 rpms, the cycle counter is set to 0, and the test is started. The speed, specimen size, and applied stress will vary with the testing machine. Wait until the specimen fails and record the number of cycles to failure. Remove the failed specimen from the test machine and inspect its fracture surfaces.
Repeat, testing one specimen at each of the stress ranges to be tested. Many more specimens would need to be tested at each stress range to obtain statistically valid data.
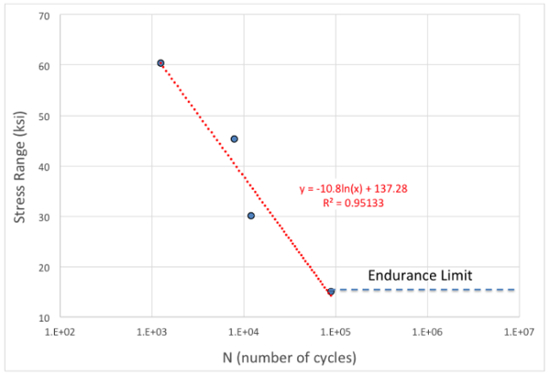
Tabulate stress ranges and number of cycles and plot the results. The actual yield stress of the specimen was 65.3 ksi, and its tensile strength was 87.4 ksi. Stress ranges shown here correspond to between 23% and 92% of yield.
The data shows that for a stress range above 15 ksi and cycles less than 100,000, there is a decrease in linear relationship between the stress range and the log of the number of cycles. The best fit line then indicates for a stress range of 25 ksi, the number of cycles to failure is about 31,000.
Below a stress range of 15 ksi, no failure is indicated. This is considered the endurance limit. The reliability of the endurance limit can be improved by testing more specimens between 10 ksi and 20 ksi.
If the cyclic load history of a bridge is assumed to consist of a number of cycles and stress ranges, and we know the fatigue behavior of the material, we can use Miner’s rule to calculate the cycles to failure.
As expected, percentage wise, the higher stress ranges have a much larger impact on the damage accumulation. The structure seems to be near its design fatigue life capacity as the value is close to 1.0.
Now that you appreciate the roles of cyclic loading, testing, and monitoring in fatigue failure, let’s take a look at examples of how fatigue effects structures that we use everyday.
Bridges experience cyclic loading daily. A catastrophic failure was luckily avoided on the Brandywine River bridge in Wilmington Delaware. A significant crack discovered by a jogger on the trail below in 1997 was found propagating from a wield defect. Repairs have been made and the bridge continues to carry 6 lanes of traffic while being monitored in its use.
Engineers submerged fuselage in a swimming pool to simulate pressurization and depressurization after 3 airplanes exploded in flight in the 1950s. It was determined that after repeated loading due to stress concentrations at the corners of the windows, fatigue failure occurred. As a result, modern day design of airplanes includes rounder corners to counteract this force and reduce the stress concentrations.
You have just watched JoVE’s Introduction to the Fatigue of Metals. You should now understand the idea of cyclic loading and its effect on fatigue failure of metals.
Thanks for watching!