Using two methods to estimate gene expression in the major gustatory appendages of Aedes aegypti, we have identified the set of genes putatively underlying the neuronal responses to bitter and repulsive compounds, as determined by electrophysiological examination.
Electrophysiological recording of action potentials from sensory neurons of mosquitoes provides investigators a glimpse into the chemical perception of these disease vectors. We have recently identified a bitter sensing neuron in the labellum of female Aedes aegypti that responds to DEET and other repellents, as well as bitter quinine, through direct electrophysiological investigation. These gustatory receptor neuron responses prompted our sequencing of total mRNA from both male and female labella and tarsi samples to elucidate the putative chemoreception genes expressed in these contact chemoreception tissues. Samples of tarsi were divided into pro-, meso- and metathoracic subtypes for both sexes. We then validated our dataset by conducting qRT-PCR on the same tissue samples and used statistical methods to compare results between the two methods. Studies addressing molecular function may now target specific genes to determine those involved in repellent perception by mosquitoes. These receptor pathways may be used to screen novel repellents towards disruption of host-seeking behavior to curb the spread of harmful viruses.
Compounds like DEET, Picaridin, Citronellal and IR3535 have been shown to effectively repel mosquitoes, including the important disease vector Aedes aegypti1,2. We record action potentials from sensory neurons associated with specific gustatory sensilla to determine the cells involved with mosquito repellency. Coupled with downstream sequencing of expressed genes in these tissues, we may identify the genes most likely mediating the responses of these cells in order to screen new compounds for improved repellency capabilities.
RNA-seq is a powerful tool, quickly becoming standard for tracking temporal and spatial changes in gene expression. RNA-seq analyses of insect chemosensory appendages and organs have been used to uncover molecular receptors in several insect species3-5, greatly improving on conventional PCR-based searches gene by gene6. Insects represent the most diverse animal class, presenting many opportunities to study the connection between genes and unique phenotypes. RNA-seq technology can be employed on any living insect tissue. Likewise, electrophysiological recording from sensory cells within uniporous gustatory sensilla can be achieved in many different insect species. The pairing of these two techniques allows researchers to narrow the set genes involved in an observed chemosensory phenotype. Different species will present specific challenges, but may inform the connection between chemosensory receptor genes and a chemosensory adaptation. The size and morphology of chemosensory sensilla is variable and may require extensive troubleshooting when recording action potentials to reduce noise and identify repeatable signals. Dissections of chemosensory organs may be trivial or delicate and time consuming, depending on morphology and size of the insect. Recovery of high-quality RNA may require some troubleshooting as well, such as avoiding certain pigments during tissue collection.
While demonstrating the effects of repellent compounds through behavioral trials is direct and informative, this approach is time intensive and broad with respect to mechanism of action. Electrophysiology coupled with RNA-seq allows for more specific analyses of what drives avoidance behaviors in insects. Once the “toolkit” of chemical discrimination has been identified in an insect species, more specific attempts to improve on known repellents are possible. Receptors and associated proteins in sensory cells responsible for these behaviors may be expressed heterologously for direct chemical screening. Furthermore, molecular modeling can predict which chemicals will elicit strong responses from these receptors7.
The snapshot of all active genes in a narrow set of chemosensory tissues may also be useful in identifying similar genes in other species. Using sequence homology and expression similarities, researchers may form sets of molecular receptors most likely mediating responses to repellents that are broadly effective on insects. We present the following protocol to aid researchers in deconstructing insect chemosensory pathways and to persuade more to delve into the neuroethology of non-model and economically important insects.
1. Rearing Ae. aegypti adults
2. Preparation of Chemicals
3. Electrophysiology (tip recording8; Figure 1)
4. RNA Isolation and Sequencing (Figure 2)
5. Quantitative RT-PCR Validation of RNA Sequencing (Figure 3)
The trace recordings of action potentials from Ae. aegypti gustatory sensilla (Figure 1) demonstrate the effectiveness of direct stimulation with a range of chemicals. This technique can be used to quantify responses to any stimulating chemical by counting spikes of a given amplitude and duration over a reasonable time range (generally less than 500 ms). Trace recordings must be readily reproducible under a given set of experimental conditions. Otherwise, the observed physiological responses may represent uncommon phenotypes among individuals of the test species.
Raw RNA-seq data requires filtration and accurate mapping before being presented as rounded RPKM (the number of mapped reads per kilobase length of transcript per million reads mapped) or FPKM (the number of read fragments per kilobase length of transcript per million reads mapped) numerical values (Figure 2). The distinction between these two RNA-seq normalization methods has been described in two seminal works10,11. One advantage of total mRNA sequencing is the ability to detect the expression of large gene families simultaneously. The visual presentation of the expression of many genes at once allows for a unique understanding of the molecular toolset for a given tissue. Comparisons between sexes, developmental stages or tissue types can be made rapidly.
Biological replicates for RNA-seq datasets may be limited by cost or difficulty of tissue collection. qRT-PCR offers the ability to validate small subsets of total gene expression at less cost and requires less source RNA. Side by side data comparisons (Figure 3A) allow for greater confidence in RNA-seq results, as the two methods rely on different chemistries for gene abundance estimation. Statistical equivalence functions (Figure 3B) demonstrate the limits of certainty in each case.
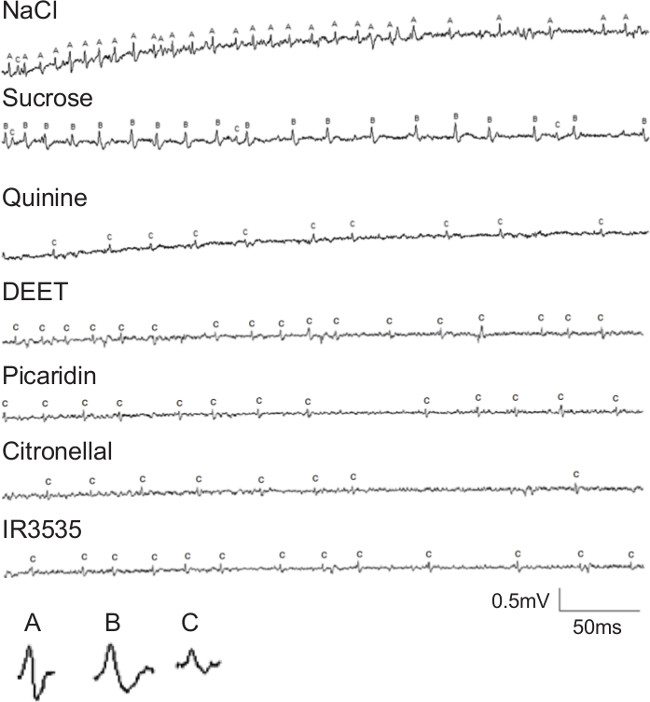
Figure 1: Electrophysiological recordings from a medium-sized sensillum on the labellum of Ae. aegypti females, modified from cited work12. Traces show responses to 100 mM NaCl, 100 mM sucrose, 1 mM quinine, 0.8% DEET, 0.8% Picaridin, 0.8% Citronellal and 0.8% IR3535. The three spikes with differing amplitudes or shapes are labeled a, b or c. These three spikes correspond with three sensory neuron subtypes with differing sensitivities: salt, sugar, and bitter, respectively.
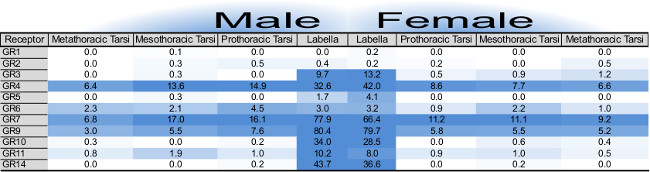
Figure 2: Table of gustatory receptor gene expression as determined by RNA-seq for 8 tissue samples, modified from cited work13. Individual cells report RPKM values for each gustatory gene annotation, male tissues (left) and female tissues (right). Numerical values are rounded to the nearest tenth. Heat-map color intensity is capped at highest RPKM and the midpoint is scaled for each gene family individually. There is only one gene family shown in this case. Please click here to view a larger version of this figure.
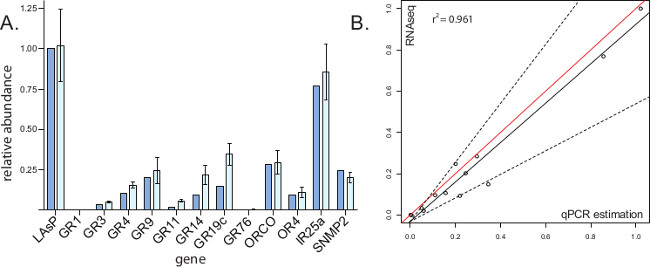
Figure 3: Comparison of qRT-PCR data and RNA-seq data, modified from cited work13. (A) Each chemoreception gene of the horizontal axis is represented by two data columns. The left column represents relative expression as determined by RNA-seq; RPKM values of chemoreception genes were divided by that of housekeeping gene AaegLAsP to generate numerical proportions in this tissue. The right column represents relative expression as determined by qRT-PCR. First, biological replicate Ct values for labella genes were normalized using AaegLAsP as a standard. Second, replicate Ct values for each gene were used to calculate relative expression values (Etarget-(Ct[target]-Ct[reference])). The error bars indicate standard deviation of individually calculated relative expression values. (B) RNA-seq and qRT-PCR datasets were compared in a separate analysis. The vertical axes represent relative gene abundance as demonstrated by RNA-seq data, with a value of 1 being attributed to housekeeping gene AaegLAsP and all other gene expression being reported relative to this value. The horizontal axes represent relative gene abundance as predicted by qRT-PCR, with a value of 1 being attributed to housekeeping gene AaegLAsP and all other gene expression being reported relative to this value. Red lines represent exact equivalence. Dashed lines represent boundaries of the 'region of similarity' for slope, calculated by the statistical equivalence algorithm9. Solid black lines represent the least-squares regression of qRT-PCR equivalence to RNA-seq quantification for the 12 target genes and AaegLAsP housekeeping gene, each represented by circle data point. Please click here to view a larger version of this figure.
The most challenging aspect of recording action potentials from gustatory sensilla is deciding which responses are “normal.” When employing single gustatory sensillum tip recording the first time for a given insect species, the total number and sensitivities of the gustatory receptor neurons (GRNs) are likely unknown. Many preliminary recordings are first required to decide the range and concentrations of chemicals to test. In this instance, we began with the observation that a single GRN responded to low concentrations of DEET (Figure 1). Subsequently, we examined responses within the same sensillum to a range of concentrations of chemicals known to be bitter or aversive to other insects and observed a similar spike shape and amplitude (Figure 1). These observations suggested that a single GRN subtype responds to these aversive compounds. For comparison, we tested sugary compounds known to stimulate feeding in mosquitoes to see if a similar spike occurred. We observed a different, larger spike in this case. Similarly, we observed a third, intermediate-sized spike in response to salt stimulation, bringing the total GRN subtype count to three.
Electrophysiological recording preparations in insects are inherently variable. Target gustatory sensilla are typically very small and must be positioned at the appropriate angle to access with the recording electrode without touching glass to the cuticle. To establish a conductive bridge to gustatory neurons, the terminal pore of the sensillum must be open to the contained lymph to establish direct contact with the recording electrode’s electrolyte. We have observed blockage of sensilla openings either by foreign debris or excreted and dried material from within the target sensillum. To avoid these impediments, care must be taken when rearing and handling insects to avoid contact with the target sensilla. In addition to choosing undamaged, healthy test insects, biological factors such as age, feeding state, mating state and zeitgeber time should be considered when establishing controls to reduce variability in recordings.
It may be difficult to obtain a responsive preparation consistently. Many trials may be necessary to improve the signal-to-noise ratio enough to resolve individual spikes. Experimental variations on the aforementioned preparations may lead to better results. It is advisable to establish a robust response on your recording apparatus for your test species using a common insect spike elicitor, like sucrose or quinine. Once a gustatory sensillum is responding, these responses should be reproducible. The minimum length of time between stimulations should be experimentally determined examining spike dynamics under different temporal constraints. Excessive stimulation should be avoided to preserve GRN health and to prevent sensillum lymph degradation. In the case that response sensitivity decreases rapidly after first stimulation, a greater number of preps must be obtained to provide confidence that these responses are physiologically typical for the given species.
The solubility of some test chemicals can create difficulty making stimulating electrodes, as some solvents may affect GRN activity, even at low final concentrations. These considerations can be addressed through trial and error and with appropriate controls. Any solvent used should be added to the control electrolyte and other test solutions to ensure consistency of responses. Immobilizing small insects, thus providing direct access to target sensilla without damaging fragile tissues, may require trial and error.
The main limitation of electrophysiology is the unfortunate separation of observed neuronal responses and potential downstream behavioral responses. Therefore, it is advantageous to test responses to chemicals that have been shown to elicit specific behavioral responses in order to discuss the significance of the results in an ecological context. Tip recordings allow for very accurate detection of cellular activity, making this technique ideal for assessing transgenic animals or those exhibiting phenotypic differences in behavior. These recordings also offer more information about neuronal responses, such as temporal and amplitude dynamics, than systems relying on visual reporters of neuronal activity. In some instances, neural responses can be quantified more easily than behavioral data12.
Tissue collection for RNA-seq and qRT-PCR is straightforward but requires continuous concentration and attention to preserving cellular material through cold storage and avoidance of excess moisture. RNase activity can affect RNA quality; therefore tissue must only contact clean surfaces throughout collection and RNA extraction. Though the troubleshooting required for qRT-PCR is well documented, the most likely pitfalls occur early in the process when designing primers and selecting target and housekeeping genes. Genes that predictably represent evenly spaced points along a line of relative expression level are useful for comparing RNA-seq and qRT-PCR datasets (Figure 3). For example, selecting genes for qPCR that show RPKM values of 0, 10, 20, 30, etc., respectively, offer a predictable order of abundance to be tested.
RNA-seq was successful at highlighting lowly expressing genes in our survey of gustatory tissues (Figure 2). The reliable gene build for Ae. aegypti (AaegL1.3, http://aaegypti.vectorbase.org/GetData/Downloads/) and prior chemoreception gene identification14 made scoring gene expression relatively easy. For these purposes, insects with available gene annotations and identified gene families of interest are valuable model systems. Determining an accurate threshold for gene expression vs. background noise is speculative, but methods of determining reasonable cutoffs are available15-17. Here we determined an RPKM level of complete confidence and a lower RPKM level of decreased confidence based on precedent9 by which we framed our discussion of results.
In the future we hope to dissect other chemosensory tissues in both the mosquito and other economically important insects to extend our knowledge of the genes mediating insect repellency. We have established several candidate gustatory genes that are most likely mediating responses to aversive compounds by comparing gene sequences to species with available functional data13. We are generating transgenic lines of mosquitoes missing these individual chemosensory genes. We will use tip recordings to assess the role of these genes on the animal’s ability to detect known repellents and assess behavioral responses of these mutants to repellents. In the instance that these candidate genes do not significantly affect repellency, more resolution may be necessary to more precisely determine gene expression or protein presence in a single sensillum or cell. Lowly expressed receptors may be critical targets for screening novel repellents, along with ubiquitously expressed co-receptors. Unfortunately, in situ hybridization and immunolocalization has proven incredibly difficult in insect gustatory tissue18.
Once we have established which genes mediate these physiological responses and behaviors, we may express these genes in cell systems that are amenable to high-throughput screening of candidate repellents. In silico approaches that use structural modeling7 may also be useful in predicting which types of compounds will elicit strong responses from specific receptors.
The authors have nothing to disclose.
The authors thank Bryan T. Vinyard of the USDA, Agricultural Research Service, Henry A. Wallace Beltsville Agricultural Research Center, Biometrical Consulting Service, Beltsville, MD for statistical analyses. This work was supported in part by a grant to J.C.D. from the Deployed War Fighter Protection (DWFP) Research Program funded by the Department of Defense through the Armed Forces Pest Management Board (AFPMB).
Name of Material/ Equipment | Company | Catalog Number | Comments/Description |
Glass capillary | A-M Systems | 628000 | Standard, 1.5mm X 0.86mm, 4" |
Silver wire | A-M Systems | 7875 | .015" bare |
Tungsten wire | Alfa Products | 369 | 0.127mm diameter |
Fine forceps | Fine Science Tools | 11252 | #5SF Inox |
Refridgerated stage | BioQuip Products | 1429 | Chill Table |
Preamplifier | Syntech | Taste Probe | preamplifier |
Software for electrophysiology | Syntech | Autospike | software for electrophysiology |
TetraMin fish food | Tetra | Tropical fish food granules | fish food ground to fine powder |
TRIzol | Life Technologies | 15596-026 | RNA isolation reagent |
RNeasy Plus Mini Kit | Qiagen | 74136 | includes gDNA eliminator and RNeasy spin columns |
Nanodrop spectrophotometer | Nano Drop Products | ND-1000 | tabletop spectrometer |
R statistics | freeware (created by Robert Gentleman and Ross Ihaka) | www.r-project.org | Use the lm function of the stats package and the equiv.boot function of the equivalence package in the R computing environment. |
1.5ml tube rack | Evergreen | 240-6388-030 | Pour liquid nitrogen into a few empty wells to freeze and grind tissue. |
1.5mL collection tubes with pestle | Grainger | 6HAX6 | RNase free |
Centrifuge | Thermo Scientific | 11178160 | Spin down frozen tissue to keep at bottom of 1.5 mL tube. |
Primer-BLAST Primer Designing tool | NCBI | n/a |